Method for displaying a visual representation of mapping between a source schema and a destination schema emphasizing visually adjusts the objects such that they are visually distinguishable from the non-relevant and non-selected objects

a mapping and destination schema technology, applied in the field of visualizing mappings, can solve the problems of transforming data from one extensible markup language into another, difficult to define an xslt style sheet, schema into another, etc., and achieve the effect of effectively visualizing mapping

Inactive Publication Date: 2009-01-13
MICROSOFT TECH LICENSING LLC
View PDF27 Cites 30 Cited by
  • Summary
  • Abstract
  • Description
  • Claims
  • Application Information

AI Technical Summary

Benefits of technology

[0006]Embodiments of the present invention provide the ability to effectively visualize the mapping between two schemas, regardless of the size or complexity of the schemas and mappings. According to one aspect of the present invention, a method for visually representing a mapping between a first schema and a second schema is provided. The method includes receiving a selection of an object, emphasizing the selected object and identifying a plurality of objects that are relevant to the selected object. The objects that are identified as being relevant to the selected object are also emphasized.

Problems solved by technology

A common problem in electronic business applications is transforming data from one Extensible Markup Language (“XML”) schema into another.
However, for complex schemas and mappings, defining an XSLT style sheet is very difficult.
While the existing graphical representation techniques, such as that depicted in FIG. 1, work for representing the mappings between simple schemas, they do not scale well to larger schemas.
For large mappings, such as that depicted in FIG. 2, this becomes very difficult and the potential of selecting the wrong link, or not following all links, increases.

Method used


Image

  • Method for displaying a visual representation of mapping between a source schema and a destination schema emphasizing visually adjusts the objects such that they are visually distinguishable from the non-relevant and non-selected objects
  • Method for displaying a visual representation of mapping between a source schema and a destination schema emphasizing visually adjusts the objects such that they are visually distinguishable from the non-relevant and non-selected objects
  • Method for displaying a visual representation of mapping between a source schema and a destination schema emphasizing visually adjusts the objects such that they are visually distinguishable from the non-relevant and non-selected objects

Examples


Embodiment Construction

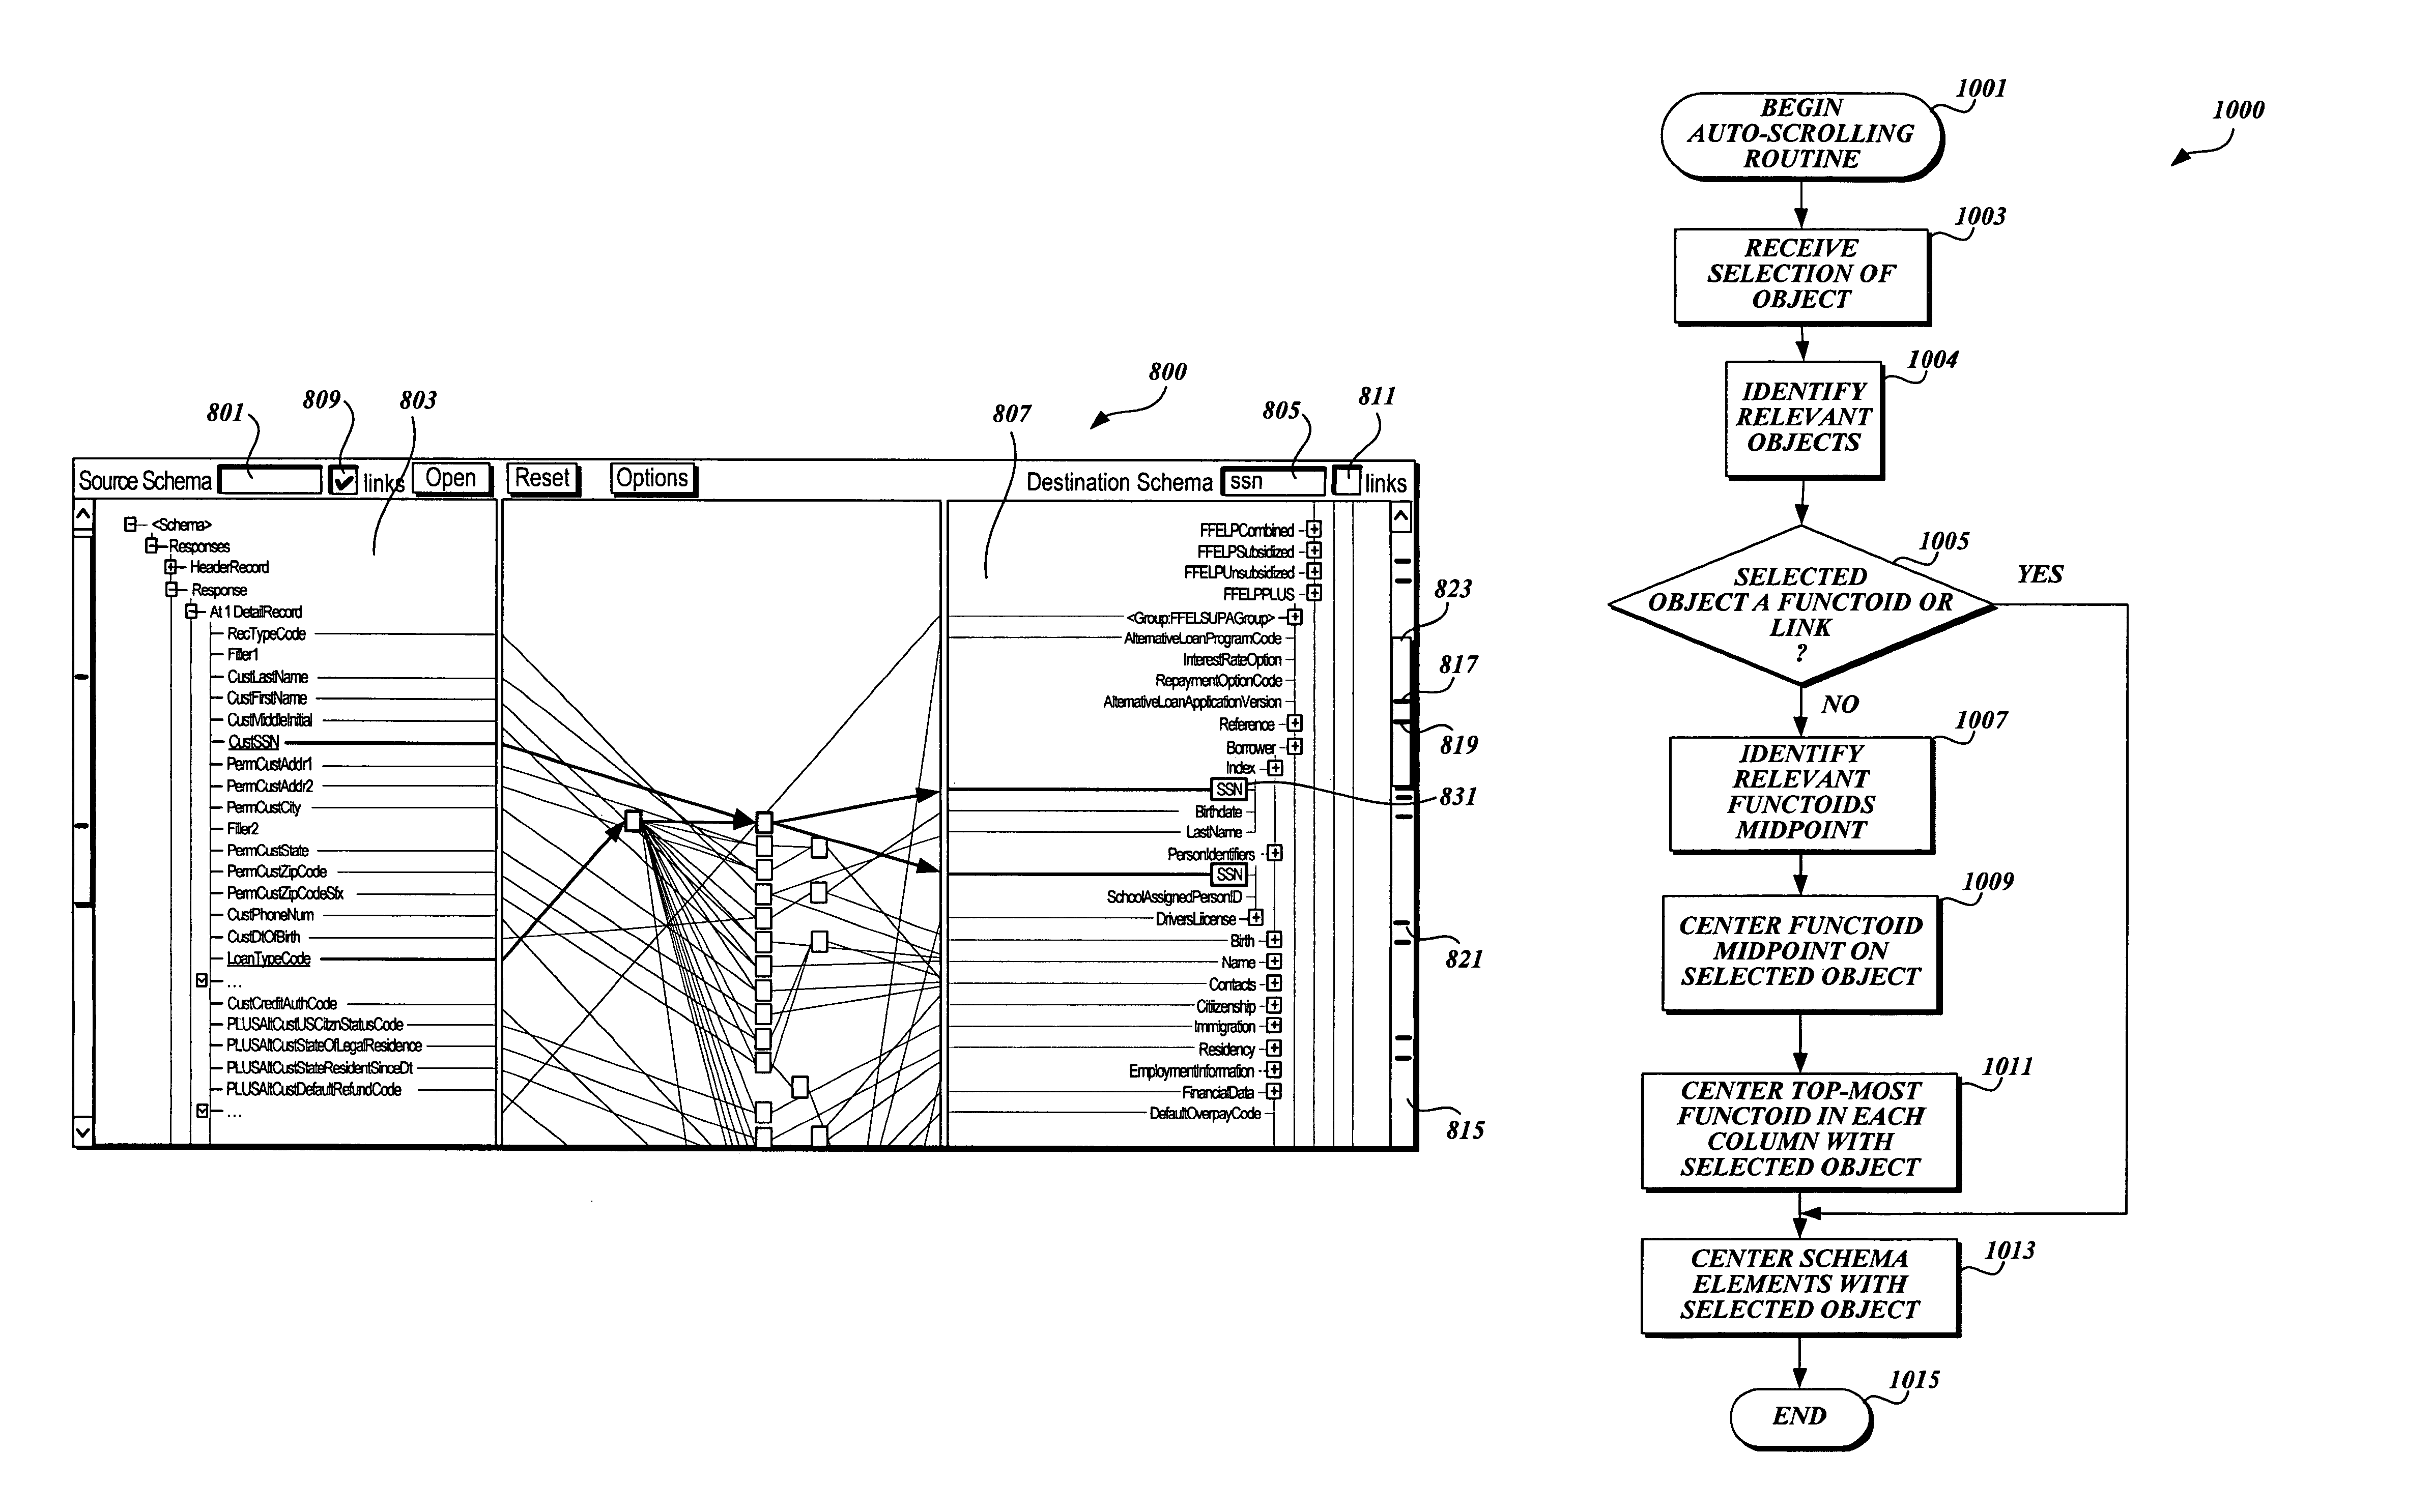
[0025]Embodiments of the present invention provide the ability to effectively visualize the mapping between two schemas, referred to herein as a source schema and a destination schema, regardless of the size or complexity of the schemas and mappings. According to one embodiment, the approach to visualizing large schemas and mappings is to graphically focus on relevant objects of interest and graphically de-emphasize or remove objects of lesser relevance for a particular interaction. As will be described in more detail below, there are several different techniques that may be used to efficiently visualize mappings between schemas including, but not limited to, emphasis propagation, auto-scrolling, coalescing, multi-select, incremental searching, and bendable links. Each of these techniques may be used alone or in combination.

[0026]FIG. 3 is a pictorial diagram of a schema mapping display generated using emphasis propagation to visualize the mappings between a source schema and a dest...


PUM


Abstract

Embodiments of the present invention provide the ability to effectively visualize the mapping between two schemas, referred to herein as a source schema (or first schema) and a destination schema (or second schema), regardless of the size or complexity of the schemas and mappings. According to one aspect of the present invention a method for visually representing a mapping between a first schema and a second schema is provided. The method includes receiving a selection of an object, emphasizing the selected object and identifying a plurality of objects that are relevant to the selected object. The objects that are identified as being relevant to the selected object are also emphasized.

Description

FIELD OF THE INVENTION[0001]In general, the present invention is related to the visualization of mappings, and in particular to the visualization of mappings between multiple schemas.BACKGROUND OF THE INVENTION[0002]A common problem in electronic business applications is transforming data from one Extensible Markup Language (“XML”) schema into another. For example, data may come into a company in some industry-standard schema that needs to be transformed into a company-specific and / or need-specific schema. Typically, this is done with an extensible stylesheet Language: Transformations (“XSLT”) style sheet. However, for complex schemas and mappings, defining an XSLT style sheet is very difficult.[0003]One technique for resolving this problem is by visually building a graphical representation of the mappings from a source schema to a destination schema. For example, FIG. 1 shows a pictorial diagram 100 of a graphical representation of mappings between a source schema 101 and destinati...

Claims


Application Information

Patent Timeline
Patent Type & Authority Patents(United States)
IPC IPC(8): G06F17/30G06F17/00G06F3/048
CPCG06F17/30292G06F17/3056G06F17/3092G06F17/30994G06F16/904G06F16/211G06F16/88G06F16/252Y10S707/99943Y10S715/966Y10S707/99931
Inventor ROBERTSON, GEORGE G.CHURCHILL, JOHN E.CZERWINSKI, MARY P.PANDITHARADHYA, PRASAD SRIPATHIBHASKARA, UDAYA K.
Owner MICROSOFT TECH LICENSING LLC
Why Eureka
Try Eureka