System for configuring audio system

a technology for configuring systems and audio systems, applied in the field of systems, can solve problems such as single location, affecting the frequency response performance, and affecting the low-frequency performance of the sound system, and causing problems such as single location, affecting the frequency response performance, and correcting amplitude deviations

Active Publication Date: 2009-04-28
HARMAN INT IND INC
View PDF15 Cites 38 Cited by
  • Summary
  • Abstract
  • Description
  • Claims
  • Application Information

AI Technical Summary

Problems solved by technology

Thus, the room can change the acoustic signal that was reproduced by the subwoofer and adversely affect the frequency response performance, including the low-frequency performance, of the sound system.
Global equalization, however, may only correct amplitude deviations at a single listening position.
Moreover, attempting to equalize for a single location potentially creates problems.
While peaks may be reduced at the average listening position, attempting to reduce the dips requires significant additional acoustic output from the subwoofer, thus reducing the maximum acoustic output of the system and potentially creating large peaks in other areas of the room.
However, this method merely focuses on a single, specific listening position in order to reduce the effects of standing waves in the listening environment; it does not consider multiple listening positions or a listening area.
In practice, the presence of other axial, tangential, and oblique room modes make prediction using this method unreliable.
However, the symmetric “mode canceling” configuration assumes an idealized room (i.e., dimensionally and acoustically symmetric) and does not account for actual room characteristics including variations in shape or furnishings.
Moreover, the symmetric positioning of the loudspeakers may not be a realistic or desirable configuration for the particular room setting.
However, this mathematical method does not account for the acoustical properties of a room's furniture, furnishings, composition, etc.
Further, this mathematical method cannot effectively compensate for partially enclosed rooms and may become computationally onerous if the room is not rectangular.
The values in H, however, may be such that an inverse may be impossible to calculate or unrealistic to implement (such as unrealistically high gains for some loudspeakers at some frequencies).
As an exact mathematical solution is not always feasible to determine, prior approaches have attempted to determine the best solution calculable, such as the solution with the smallest error.
However, this mathematical methodology requires a tremendous amount of computational energy, yet only solves for a two-parameter solution.
Acoustical problems that examine a greater number of parameters are increasingly difficult to solve.

Method used


Image

  • System for configuring audio system
  • System for configuring audio system
  • System for configuring audio system

Examples


example 1

[0197]The first system investigated is not a dedicated home theater. Therefore, the existing subwoofer locations are a compromise between low frequency performance and aesthetic concerns. FIG. 15 is the layout for the room in Example 1, the scale of which is approximately 100:1. The square boxes represent the two subwoofer locations and the circles represent the three listening positions. The room depicted in FIG. 15 is approximately 27′×13′, with a 45° angle for one of the walls, and has a 9′ ceiling. The walls and ceiling are constructed of drywall and 2″×6″ studs. The floor is constructed of a concrete slab and is covered with ceramic tile. An area rug covers a large portion of the floor.

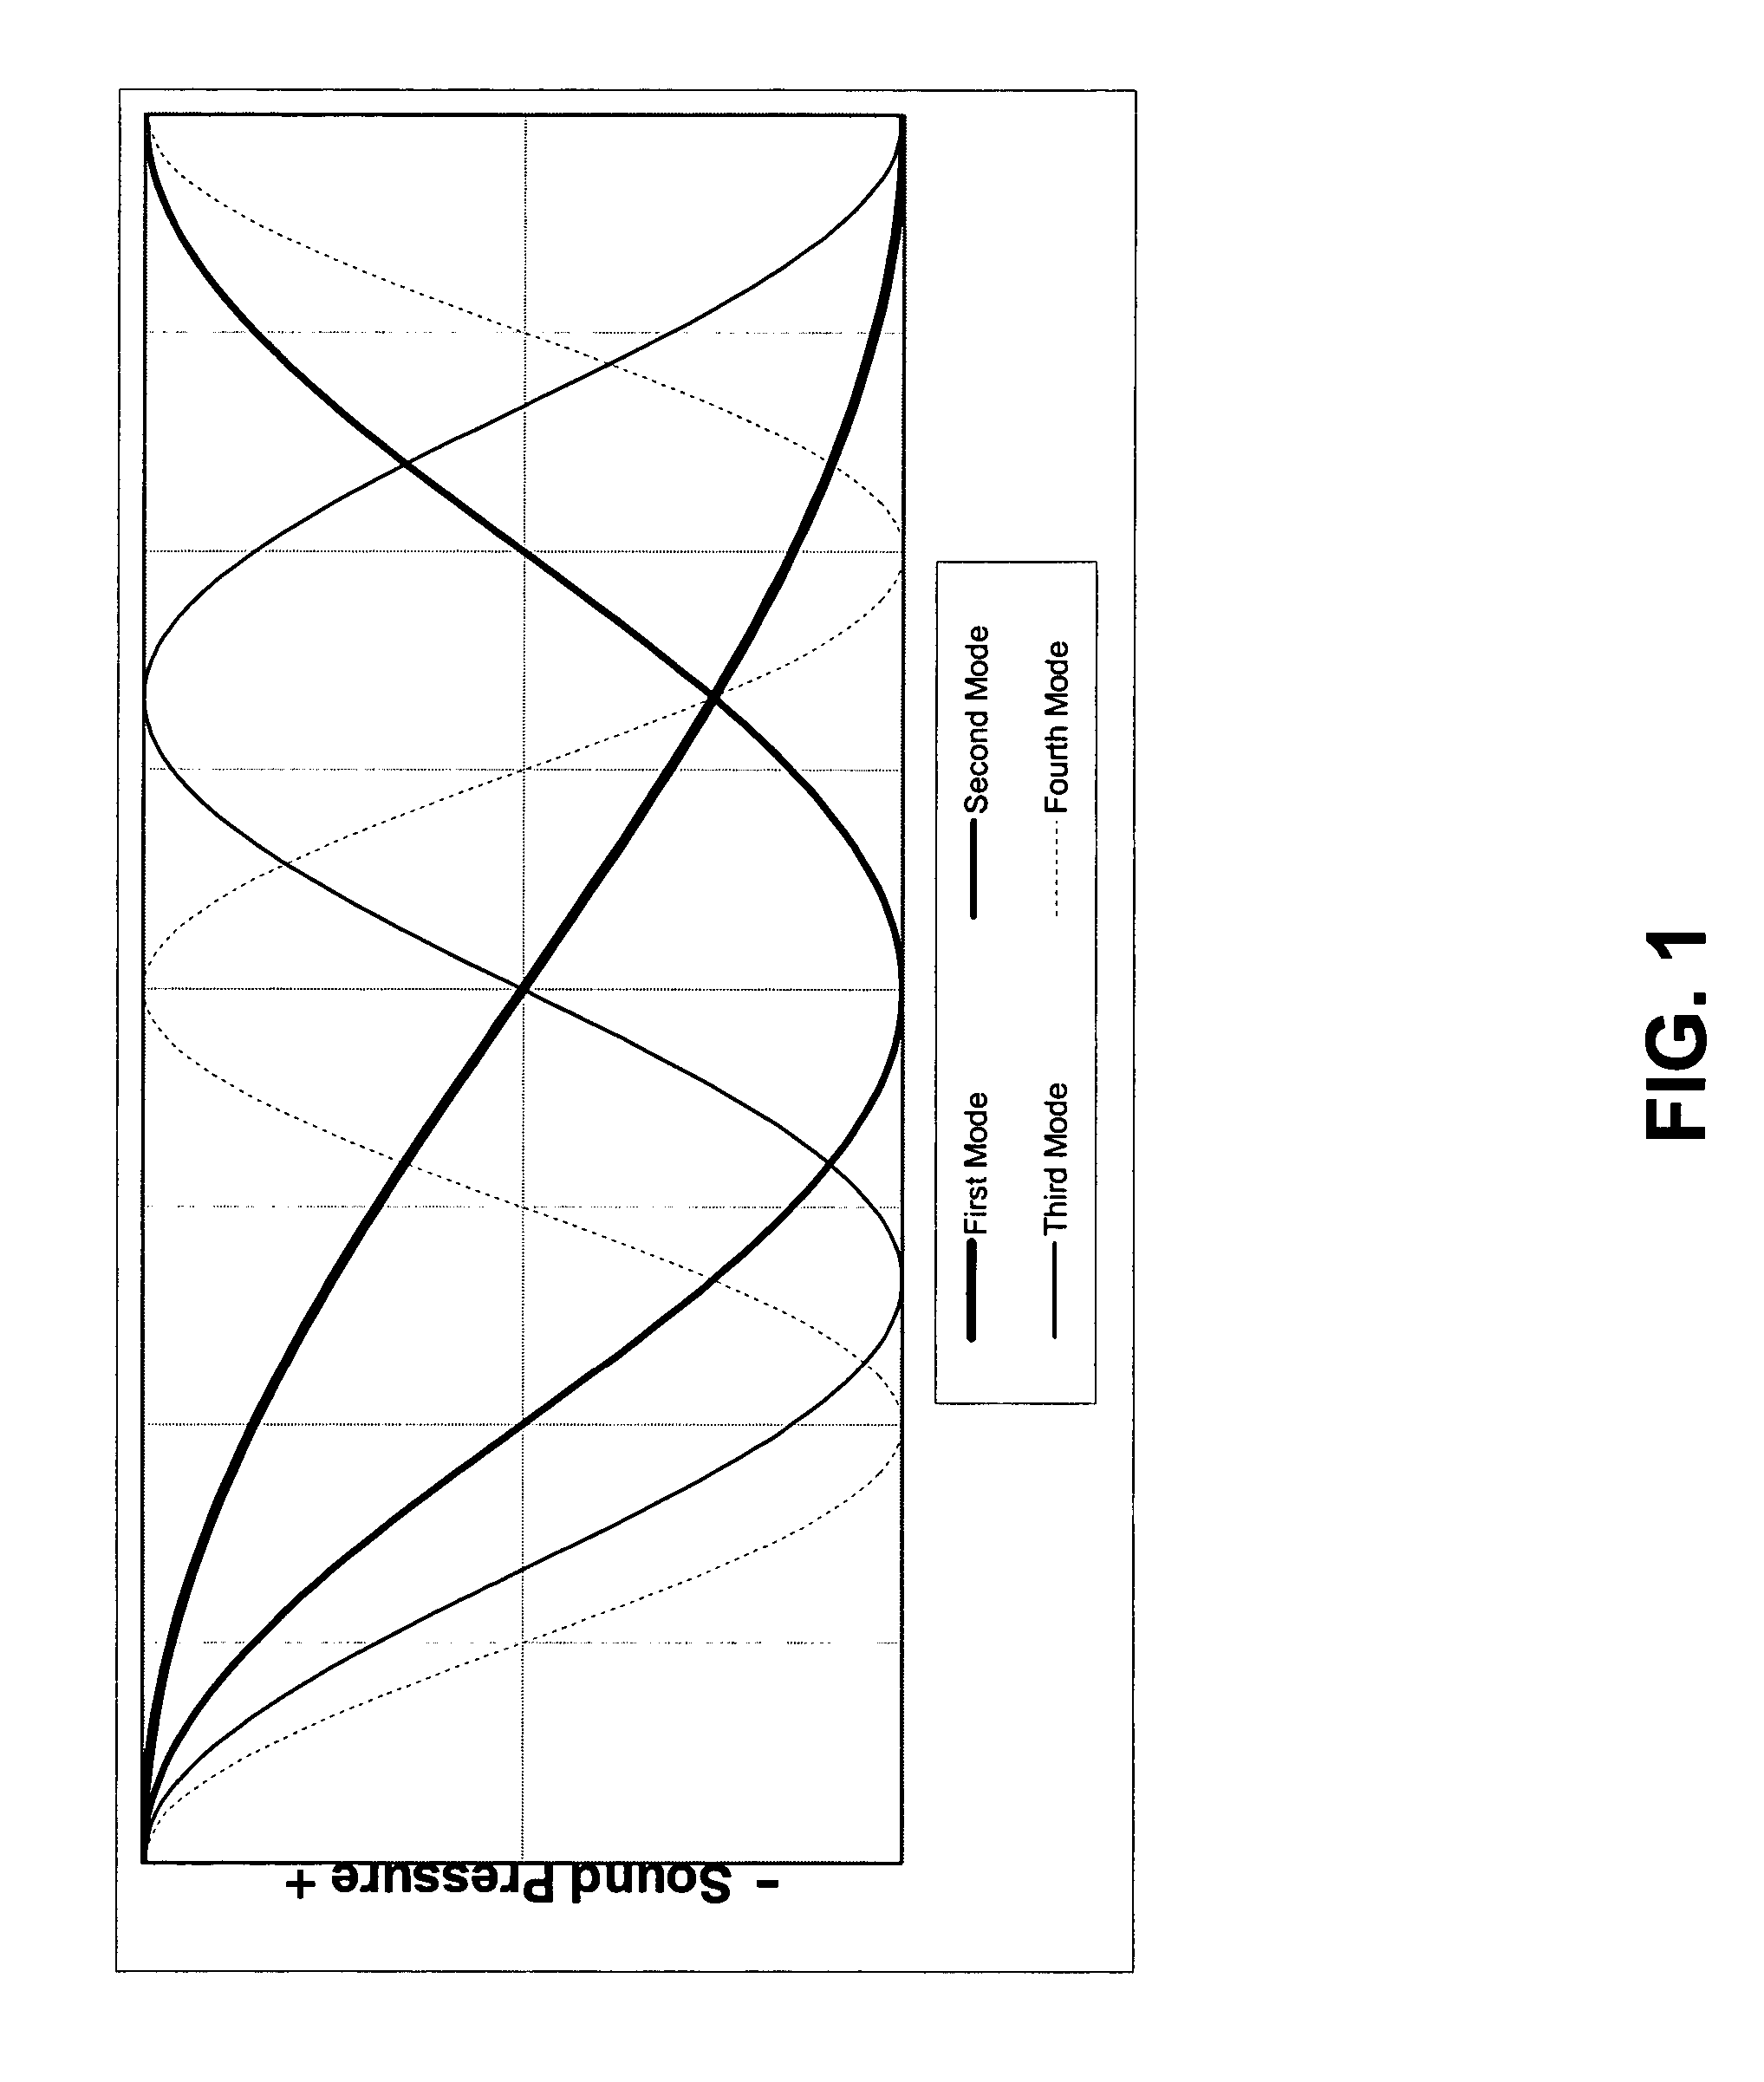
[0198]FIG. 16 describes the low frequency performance of the system before low-frequency analysis was applied. The heavy solid curve in the middle of FIG. 16 is the average amplitude response for the three listening positions. The lighter middle curves are the responses at each listening position...

example 2

[0201]The second system investigated in Example 2 is a $300,000+ dedicated home theater. FIG. 18 describes the layout of the room in Example 2. The system features one subwoofer in each corner of the room, a front-projection video system and a riser for the second row of seating. The room is approximately 26′×17′ and has a 9′ ceiling. Two of the walls are constructed of concrete blocks and two of the walls are constructed from drywall and 2″×4″ studs. The floor is a carpeted concrete slab. The second row of seating is on an 8″ riser constructed of plywood and 2″×4″ studs. The room features extensive damping on all walls. FIGS. 19 and 20 define the low frequency performance before and after low-frequency analysis. Table 2 compares the performance of the system in Example 2 before and after low-frequency analysis.

[0202]

TABLE 2Low-frequencyMeanVariance ofActiveanalysisSpatialthe spatialAcousticSubwoofers(yes / no)VarianceaverageEfficiency1, 2, 3, 4No5.1 dB21.3 dB−17.3 dB1, 2, 3, 4Yes2.1 ...

example 3

[0204]The third system in Example 3 comprises a home theater set-up in a family room. FIG. 21 shows the layout of the room in Example 3. The room is approximately 22′×21′ and features a sloped ceiling. The walls and ceiling are constructed of drywall and 2″×4″ studs. The floor is a concrete slab with the perimeter covered by tile and the central area carpeted. The left side wall features several windows which can be (and were) covered by heavy drapes. The system originally featured two subwoofers in the front of the room. FIG. 22 describes the low frequency performance in the original configuration before low-frequency analysis was applied, with the system constrained to using subwoofers 1 and 2 in the front of the room. FIG. 23 describes the low frequency performance after low-frequency analysis was applied, with the system constrained to using subwoofers 1 and 2. Two additional subwoofers were placed in the back of the room and low-frequency analysis was applied, the results of wh...


PUM


Abstract

A system is provided for configuring an audio system for a given space. The system may statistically analyze potential configurations of the audio system to configure the audio system. The potential configurations may include positions of the loudspeakers, numbers of loudspeakers, types of loudspeakers, listening positions, correction factors, or any combination thereof. The statistical analysis may indicate at least one metric of the potential configuration including indicating consistency of predicted transfer functions, flatness of the predicted transfer functions, differences in overall sound pressure level from seat to seat for the predicted transfer functions, efficiency of the predicted transfer functions, or the output of predicted transfer functions. The system also provides a methodology for selecting loudspeaker locations, the number of loudspeakers, the types of loudspeakers, correction factors, listening positions, or a combination of these schemes in an audio system that has a single listening position or multiple listening positions.

Description

RELATED APPLICATIONS[0001]This application claims priority to U.S. Provisional Application Ser. No. 60 / 492,688 entitled “In-Room Low Frequency Optimization” filed on Aug. 4, 2003, and is incorporated by reference in its entirety. This application claims priority to U.S. Provisional Application Ser. No. 60 / 509,799 entitled “In-Room Low Frequency Optimization,” filed on Oct. 9, 2003, and is incorporated by reference in its entirety.[0002]The following commonly assigned U.S. patent applications have been filed on the same day as this application. All of these applications relate to and further describe other aspects of this invention and are incorporated by reference in their entirety.[0003]U.S. patent application Ser. No. 10 / 684,222, entitled “Statistical Analysis of Potential Audio System Configurations,” filed on Oct. 10, 2003.[0004]U.S. patent application Ser. No. 10 / 684,152, entitled “Statistical Analysis of Potential Audio System Configurations,” filed on Oct. 10, 2003.[0005]U.S....

Claims


Application Information

Patent Timeline
Patent Type & Authority Patents(United States)
IPC IPC(8): H04R29/00H04R5/02H04R5/04H04S7/00
CPCH04R5/02H04S7/30H04R5/04H04R2205/024H04R2420/03H04S7/302H04S7/307
Inventor DEVANTIER, ALLAN O.WELTI, TODD S.
Owner HARMAN INT IND INC
Why Eureka
Try Eureka