
Method of volume visualization

a volume visualization and volume technology, applied in the field of volume visualization, can solve the problems of difficult use, time-consuming and error-prone, and the intuitive interface of the interactive navigation mode provided, and achieve the effect of cheap implementation

Inactive Publication Date: 2009-08-18
FRAUNHOFER GESELLSCHAFT ZUR FOERDERUNG DER ANGEWANDTEN FORSCHUNG EV
View PDF6 Cites 20 Cited by
  • Summary
  • Abstract
  • Description
  • Claims
  • Application Information

AI Technical Summary

Benefits of technology

[0021]In contrast, the present invention enables to visualise these images in an intuitive and easy to interpret way. This is due to the fact that the patient's anatomy is used as a reference for defining the image region to be visualised. Further the anatomy tends to be almost homogeneous near prominent inner surfaces in the body. Thus the invention enables to produce images which show almost homogenous naturally curved layers of the body, wherein a pathology is easily noticed.
[0031]The computer system of the invention is provided with a user interface for interactive selection of desired distance. The user interface has a wheel mouse. By rotating the wheel of the wheel mouse the user can enter the desired distance from the reference surface in order to define voxel x of the volumetric data whose data values are to be visualized. This way a user is enabled to interactively navigate through a given body region by using the surface of an organ as a reference for the navigation in an intuitive, ergonomic an cheap to implement way.

Problems solved by technology

The conventional way of looking at single axial slices for diagnostic purposes is very tedious, time consuming and error prone.
A common disadvantage of such prior art system is that the interactive navigation mode that is provided is not intuitive and difficult to use.

Method used


Image

  • Method of volume visualization
  • Method of volume visualization
  • Method of volume visualization

Examples


Embodiment Construction

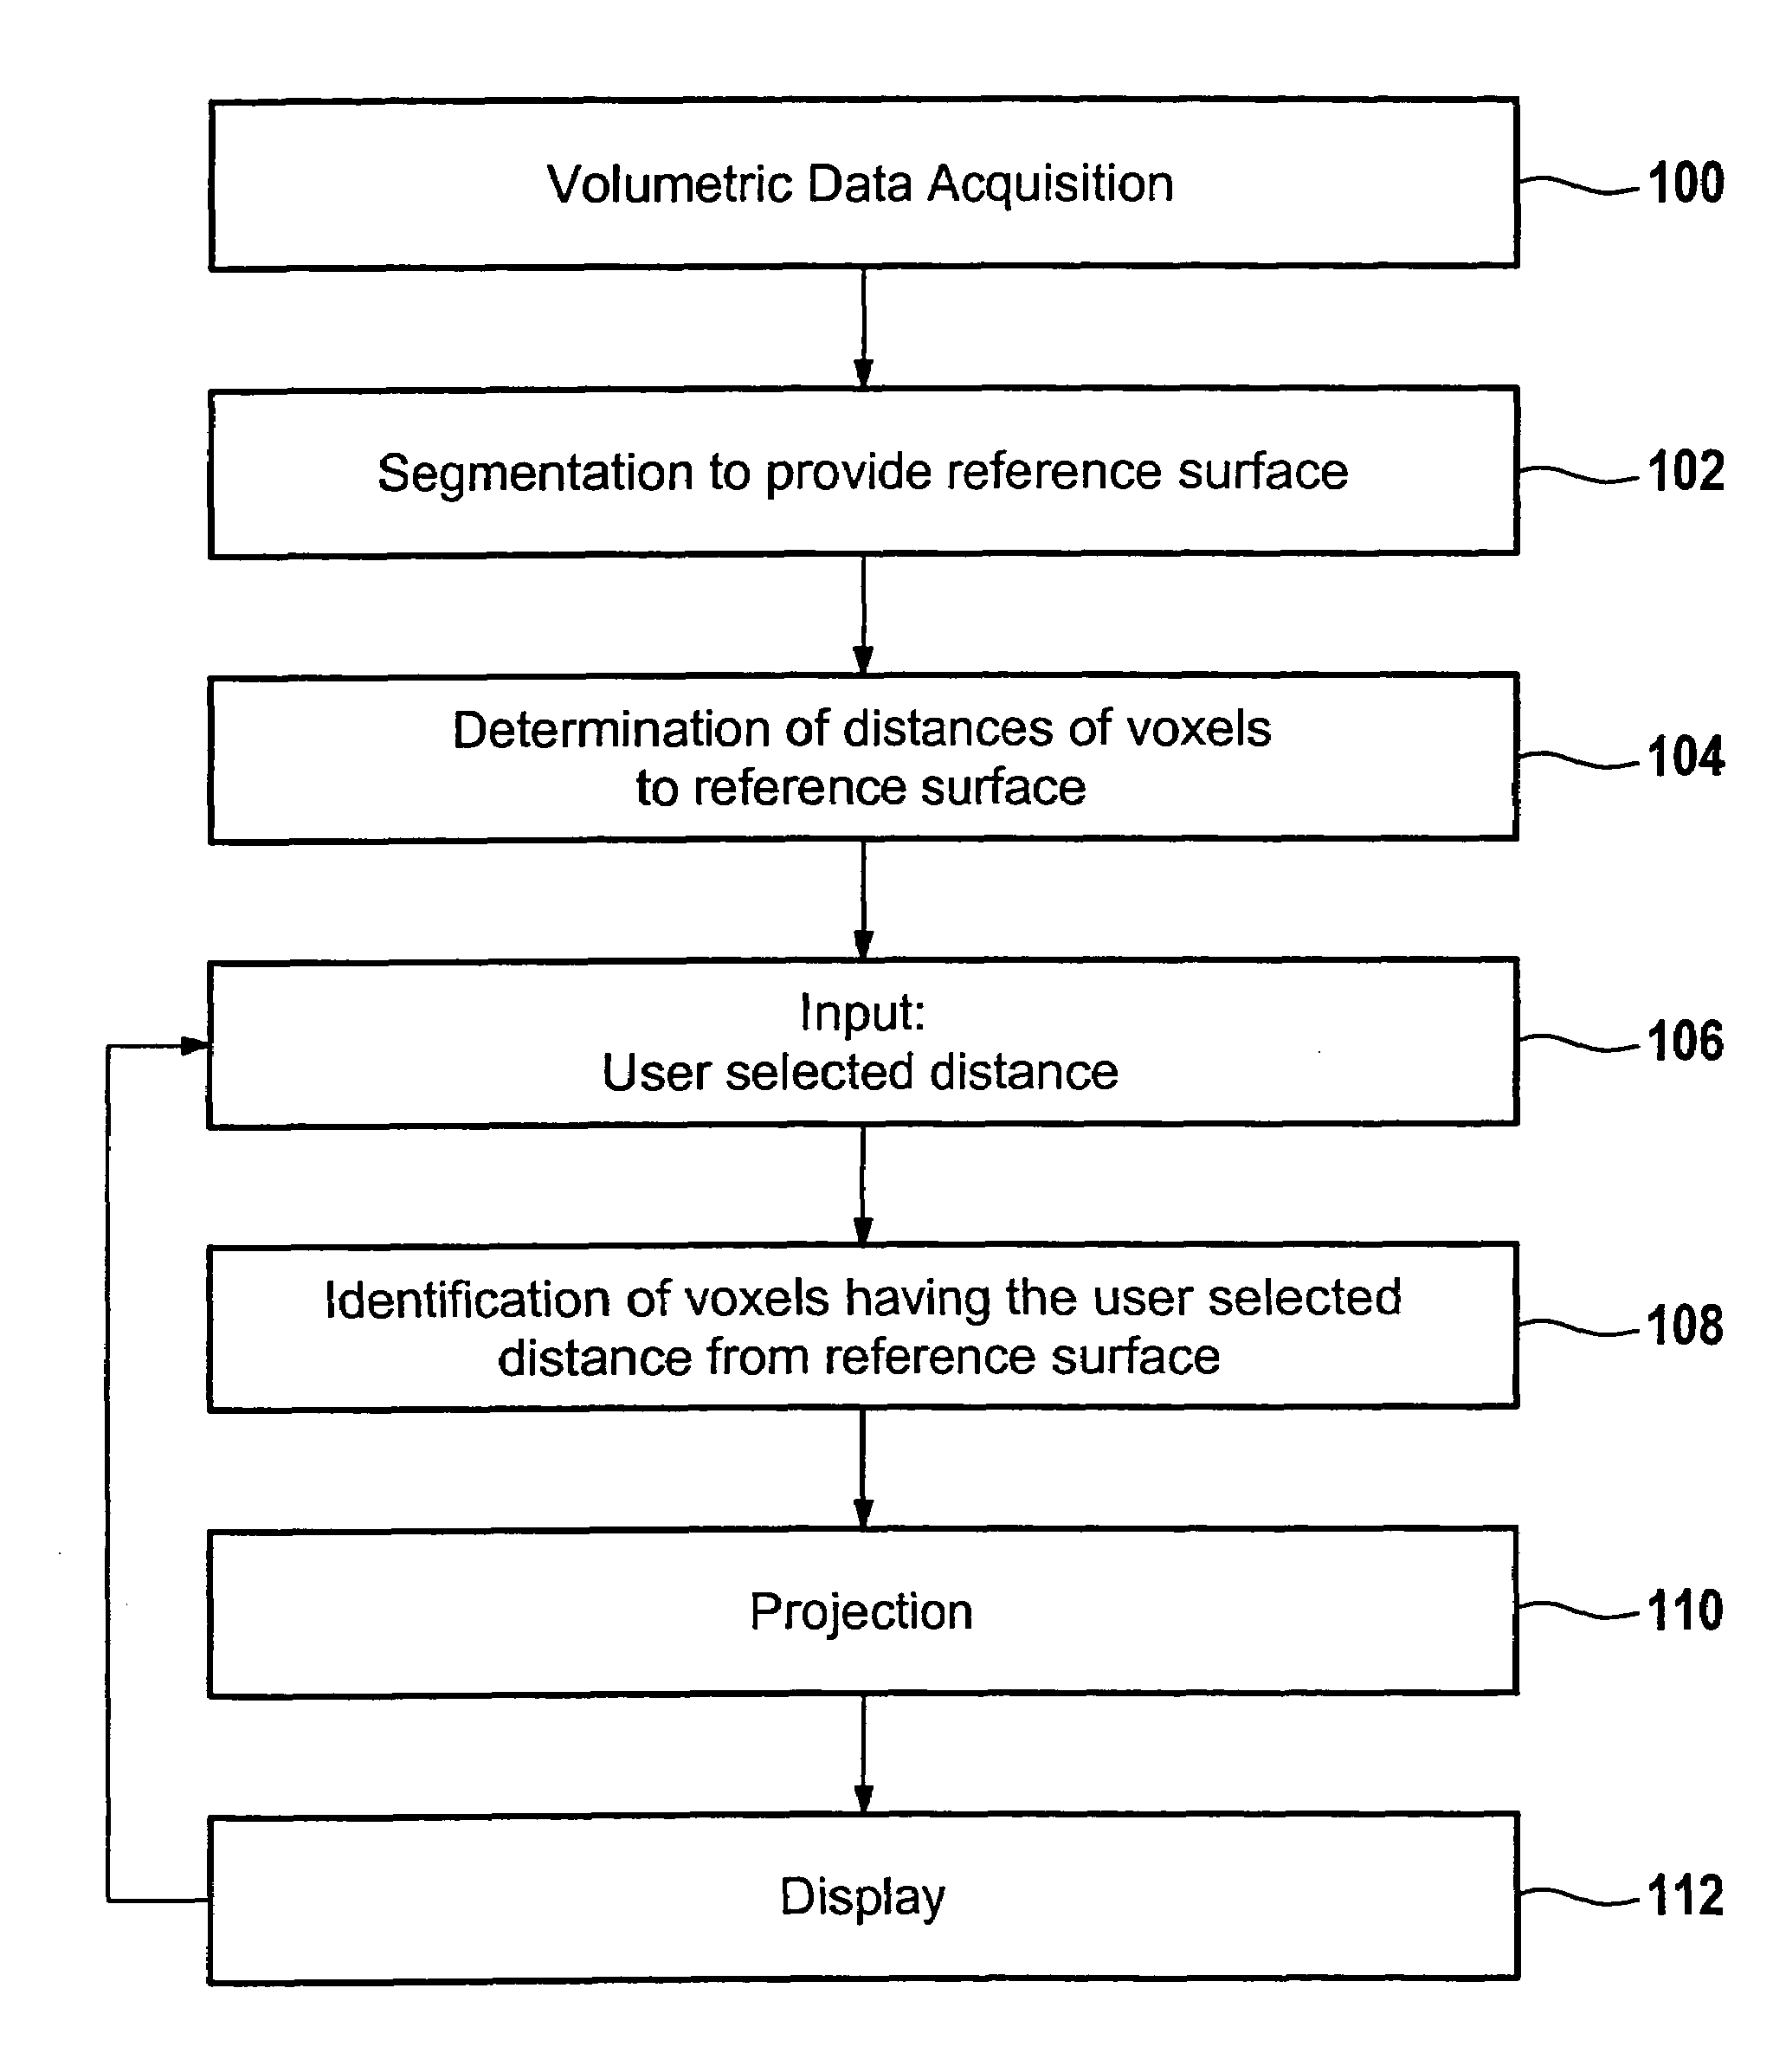
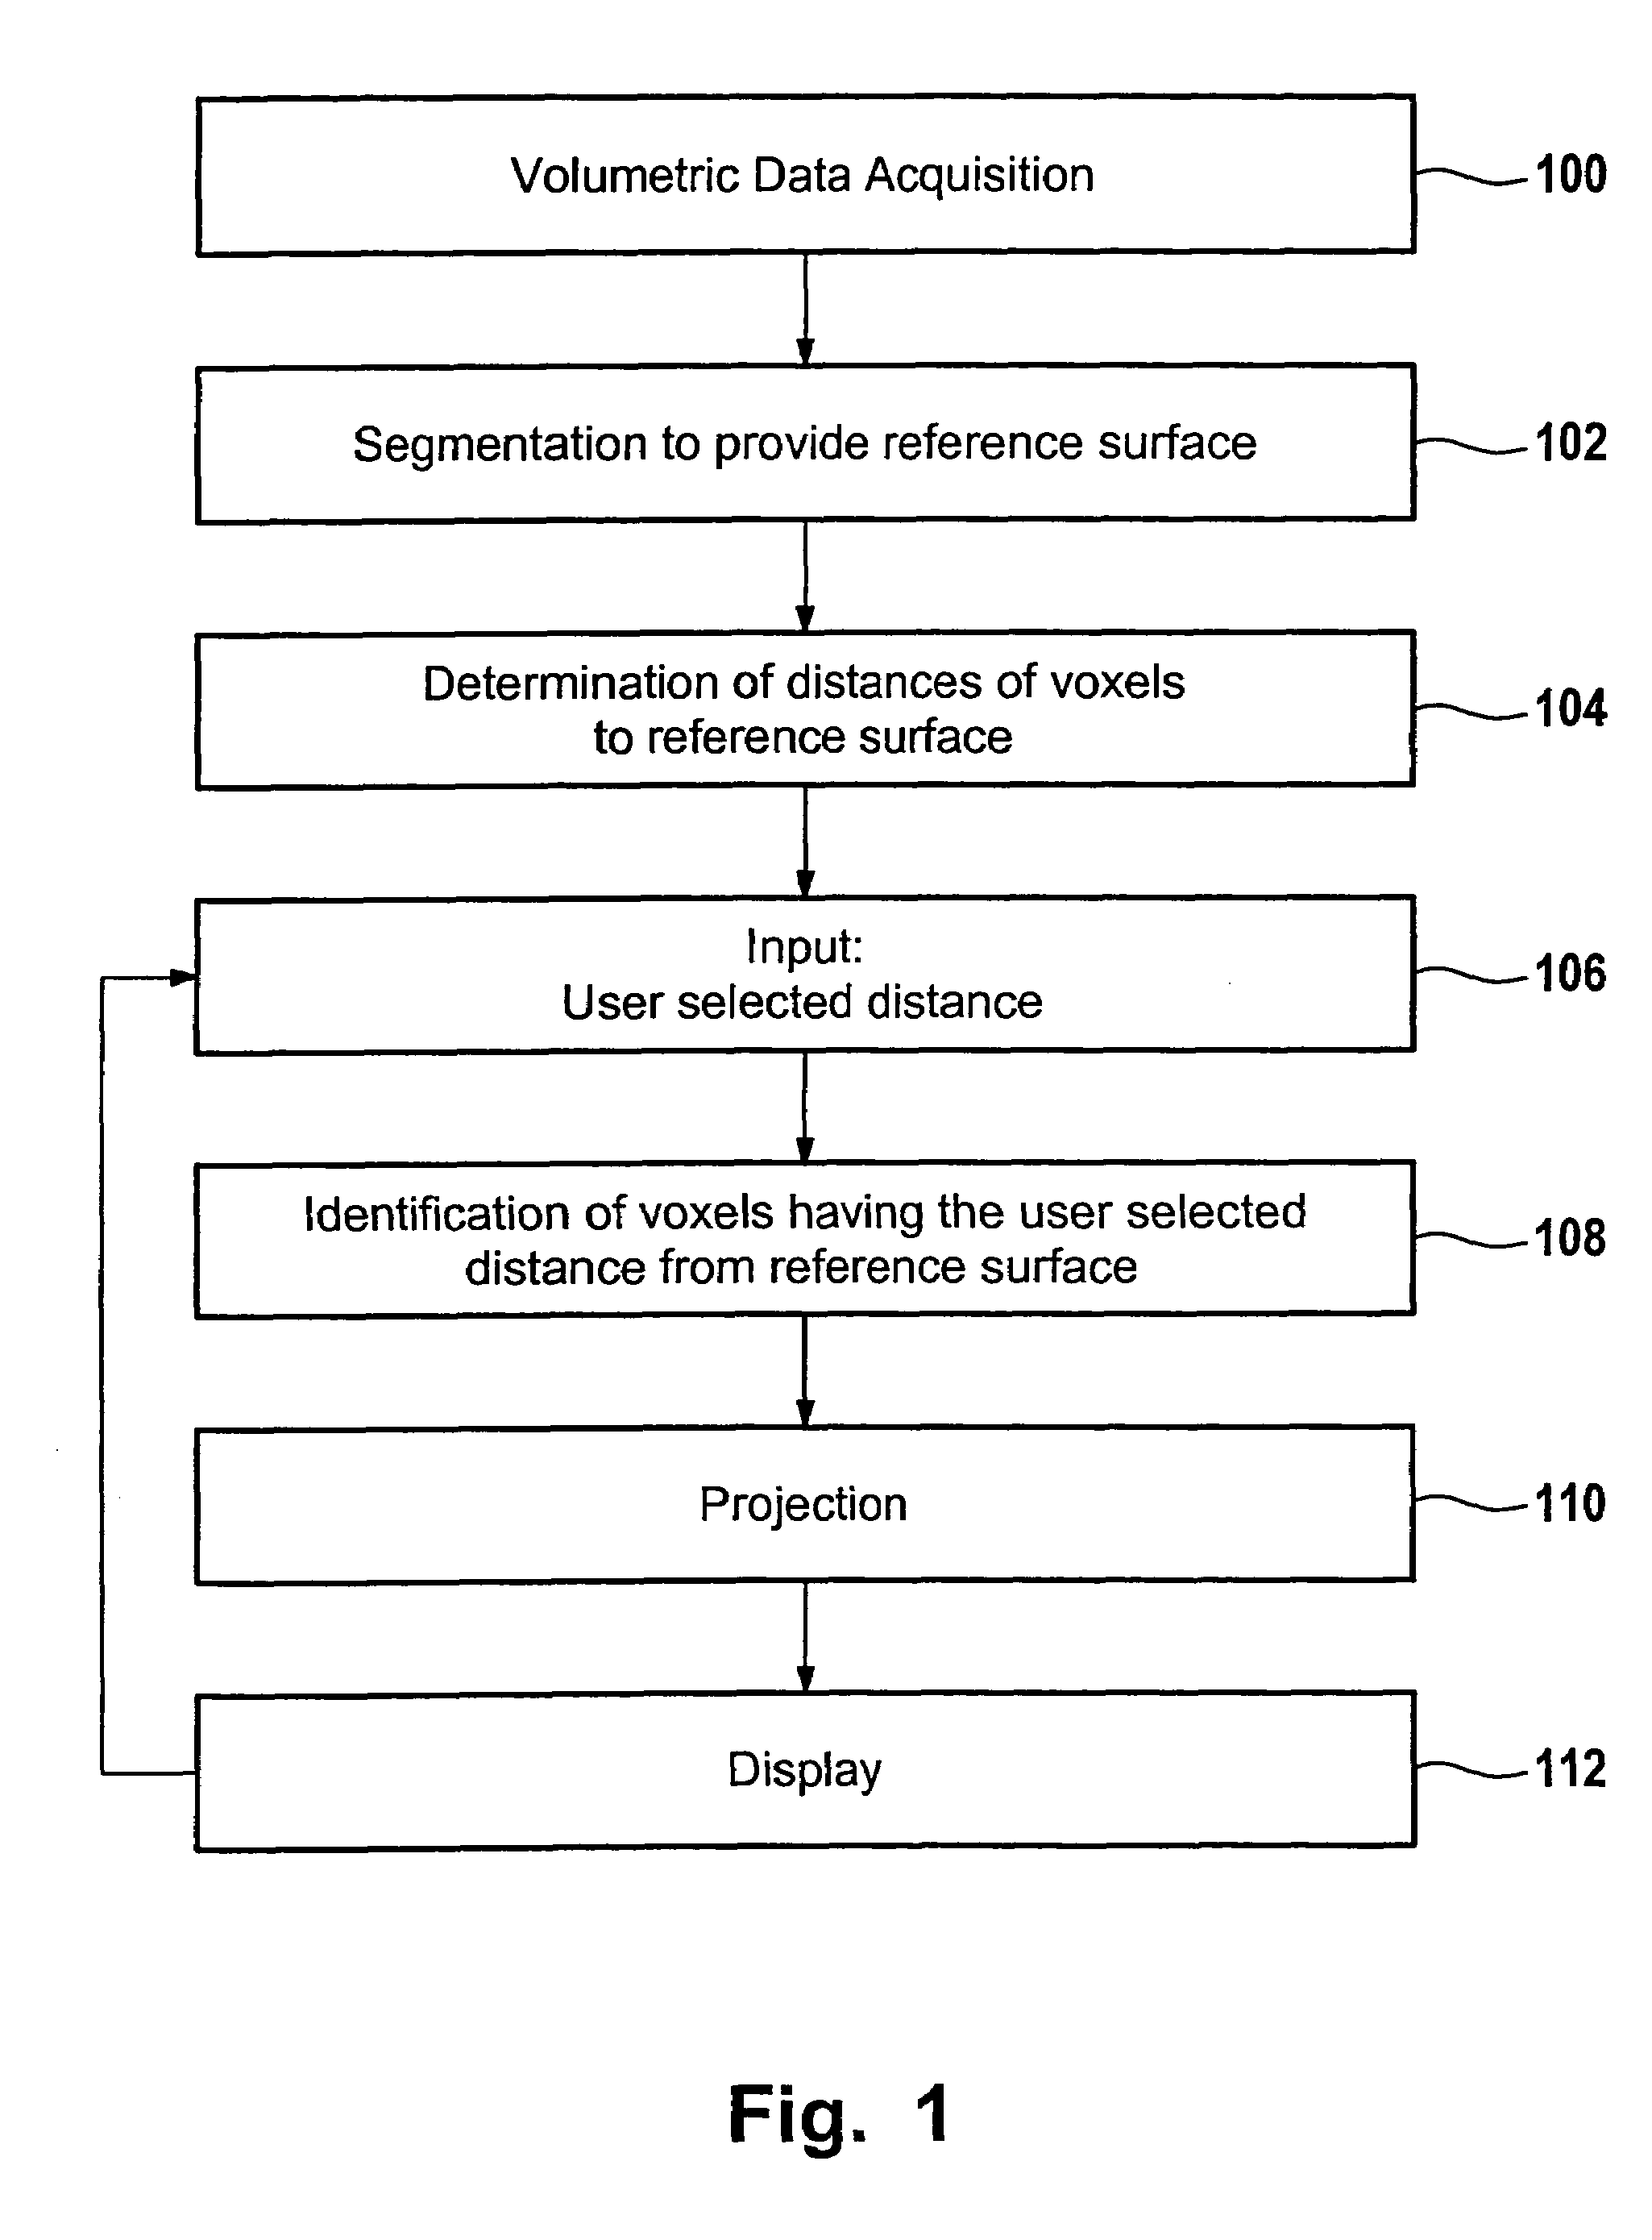
[0038]FIG. 1 shows a flow chart of a method for visualising of volumetric data. In step 100 a volumetric data acquisition is performed. For example, in the case of medical data this can be done by means of CT or MR data acquisition. Alternatively 3D microscopy or any other image data source can be used. In general, any three or more dimensional data can be used as an input data set for the visualisation.

[0039]In step 102 the segmentation of the volumetric data is performed. The segmentation can have the purpose of segmenting a particular anatomic region, such as an organ. Any known segmentation method can be used for this purpose.

[0040]For example the result of the segmentation is provided as a binary mask which identifies those voxels of the volumetric data belonging to the segmented structure, object or organ. The binary mask defines the envelope of the segmented structure. The surface of the segmented structure can be identified from the binary mask by any suitable prior art meth...


PUM


Abstract

The present invention relates to a method of volume visualization in which volumetric data is provided, the volumetric data having first voxels belonging to a reference surface. Second voxels of the volumetric data are determined having a user selected distance from the reference surface. The second voxels are visualized.

Description

BACKGROUND OF THE INVENTION[0001]1. Field of the Invention[0002]The present invention relates to the field of volume visualisation, and more particularly without limitation to volume rendering.[0003]2. Prior Art[0004]Volumetric data is typically a set S of samples (x, y, z, v), representing the value v of some property of the data, at a 3D location (x, y, z). If the value v is simply a 0 or a 1, e.g. with a value of 0 indicating background and a value of 1 indicating the object, then the data is referred to as binary data. The data may instead be multivalued, with the value representing some measurable property of the data, including, for example, colour, density, heat or pressure.[0005]In general, samples may be taken at purely random locations in space, but in most cases the set S is structured, containing samples taken at regularly spaced intervals along three orthogonal axes. When spacing between samples along each axis is a constant, the set S is isotropic. If there are differe...

Claims


Application Information

Patent Timeline
IPC IPC(8): G06T17/00G06K9/00G06T15/40
CPCG06T15/40
Inventor DICKEN, VOLKER
Owner FRAUNHOFER GESELLSCHAFT ZUR FOERDERUNG DER ANGEWANDTEN FORSCHUNG EV
Learn More