

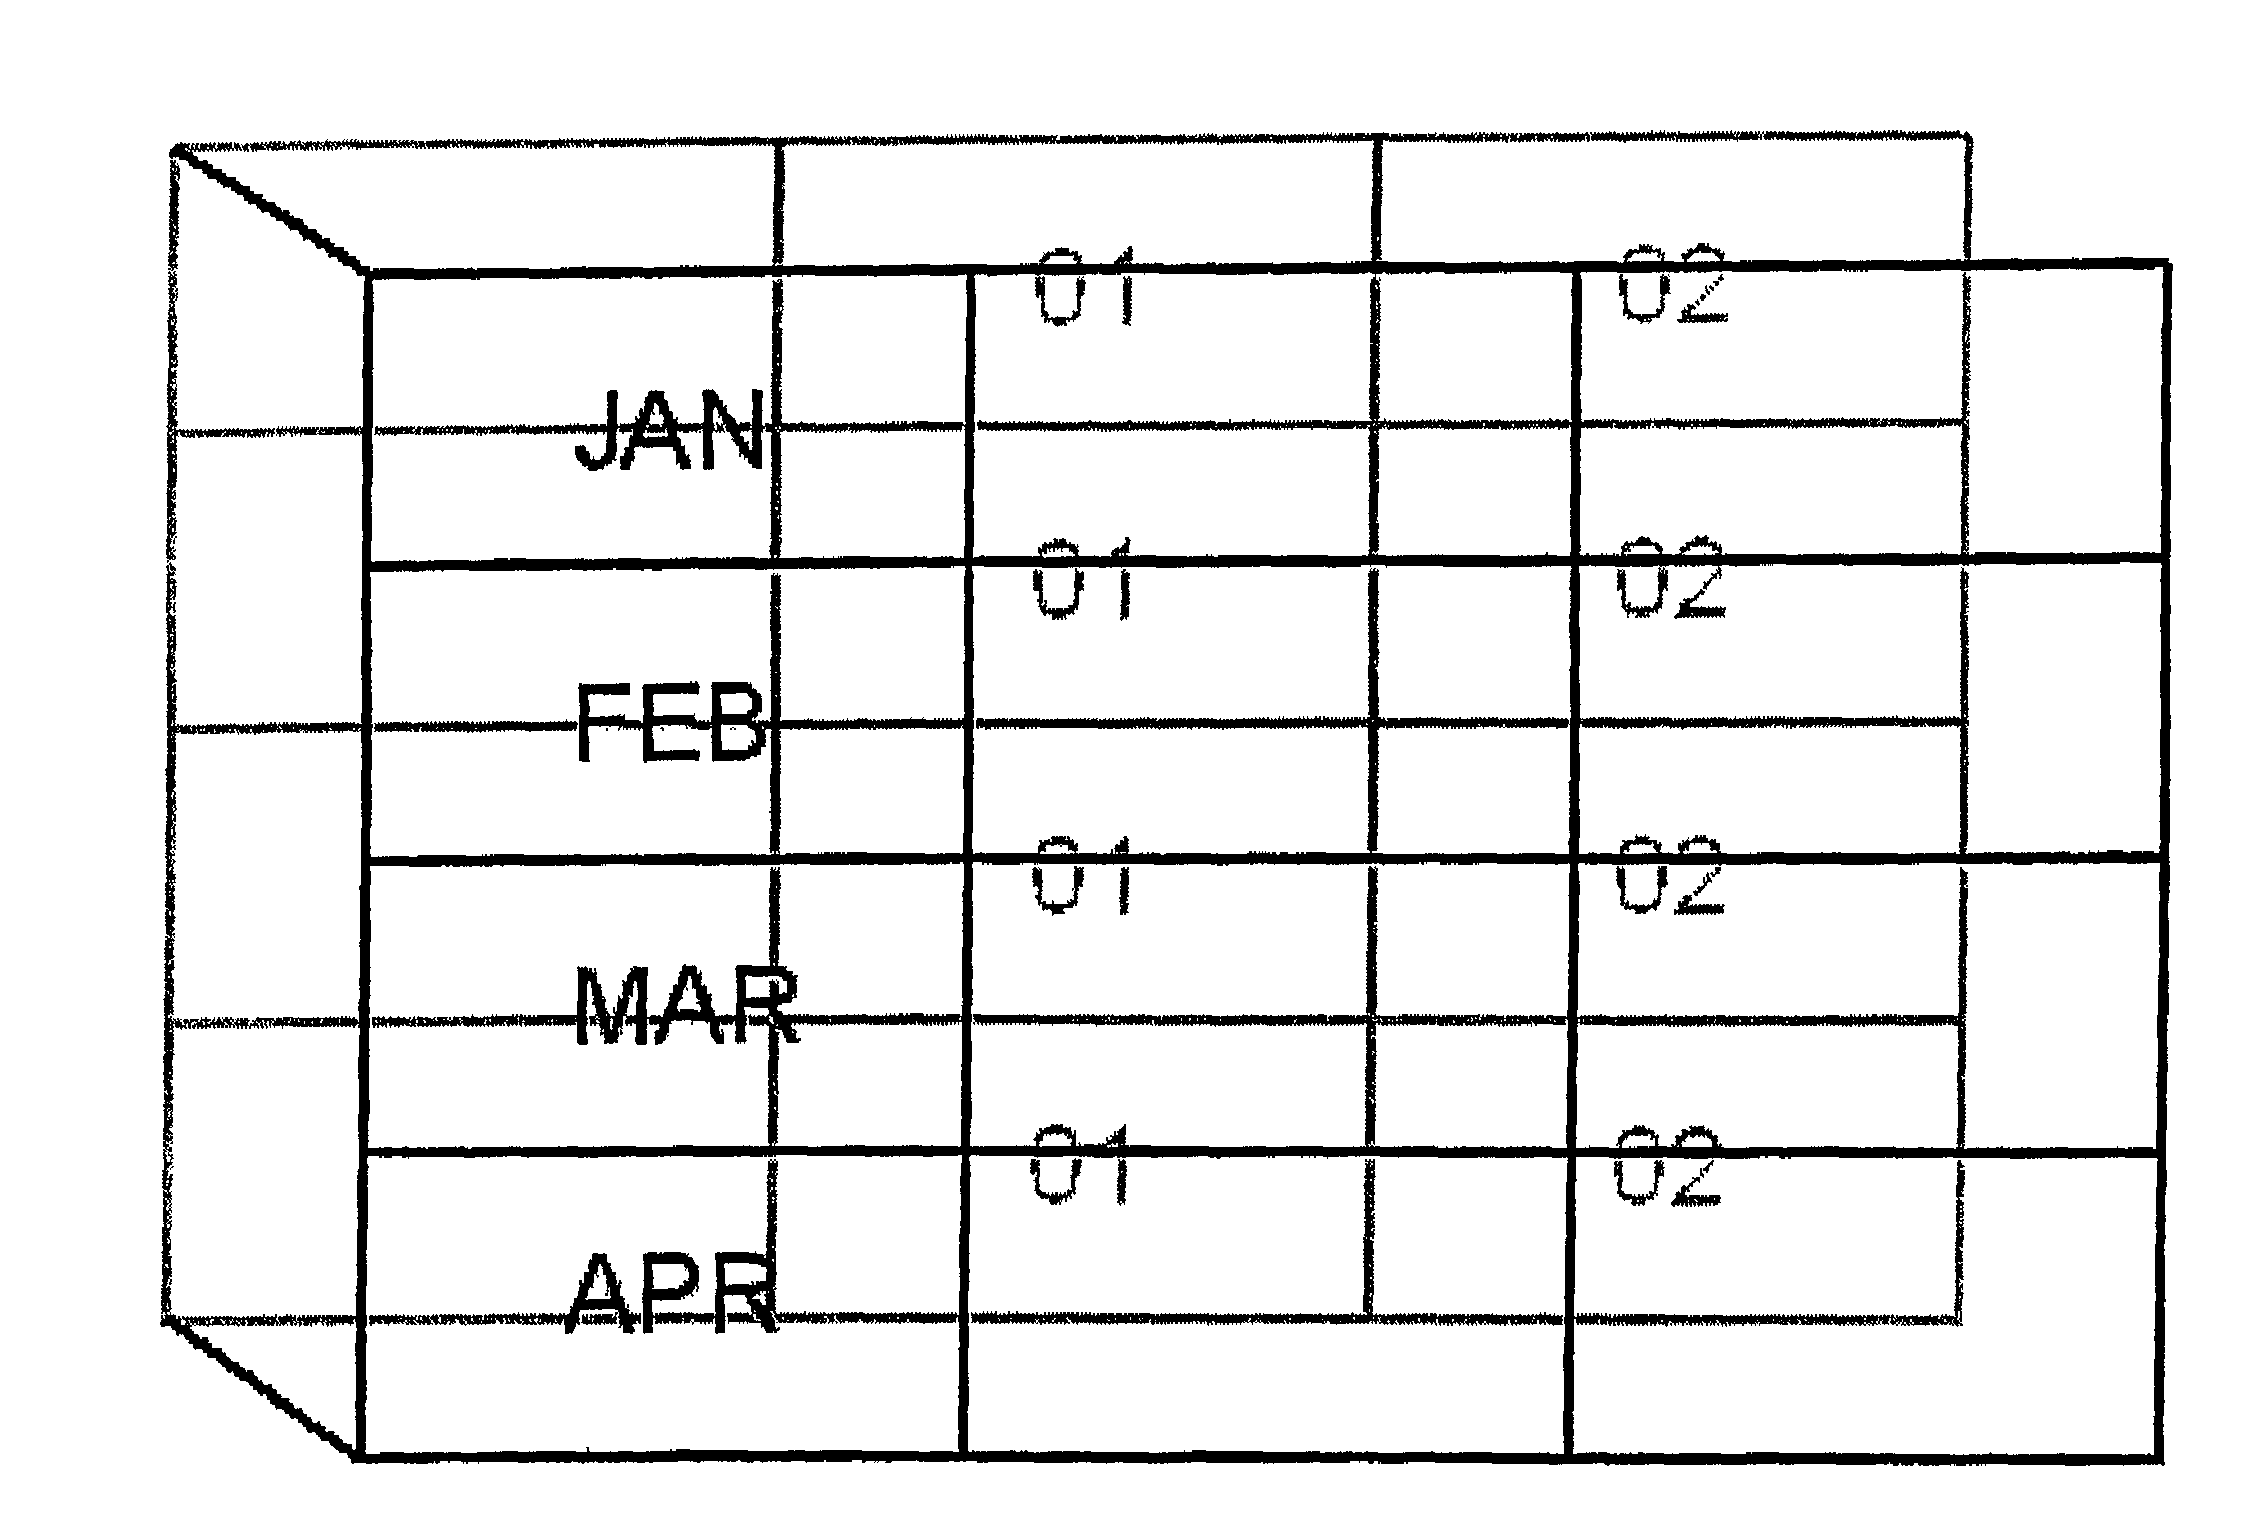
Data display for multiple layered screens
a data display and layered technology, applied in the field of data display, can solve the problems of user inability to see the effect of changing a cell on one spreadsheet on another cell on the other spreadsheet, user's time-consuming and laborious,
- Summary
- Abstract
- Description
- Claims
- Application Information
AI Technical Summary
Benefits of technology
Problems solved by technology
Method used
Image

Examples
Embodiment Construction
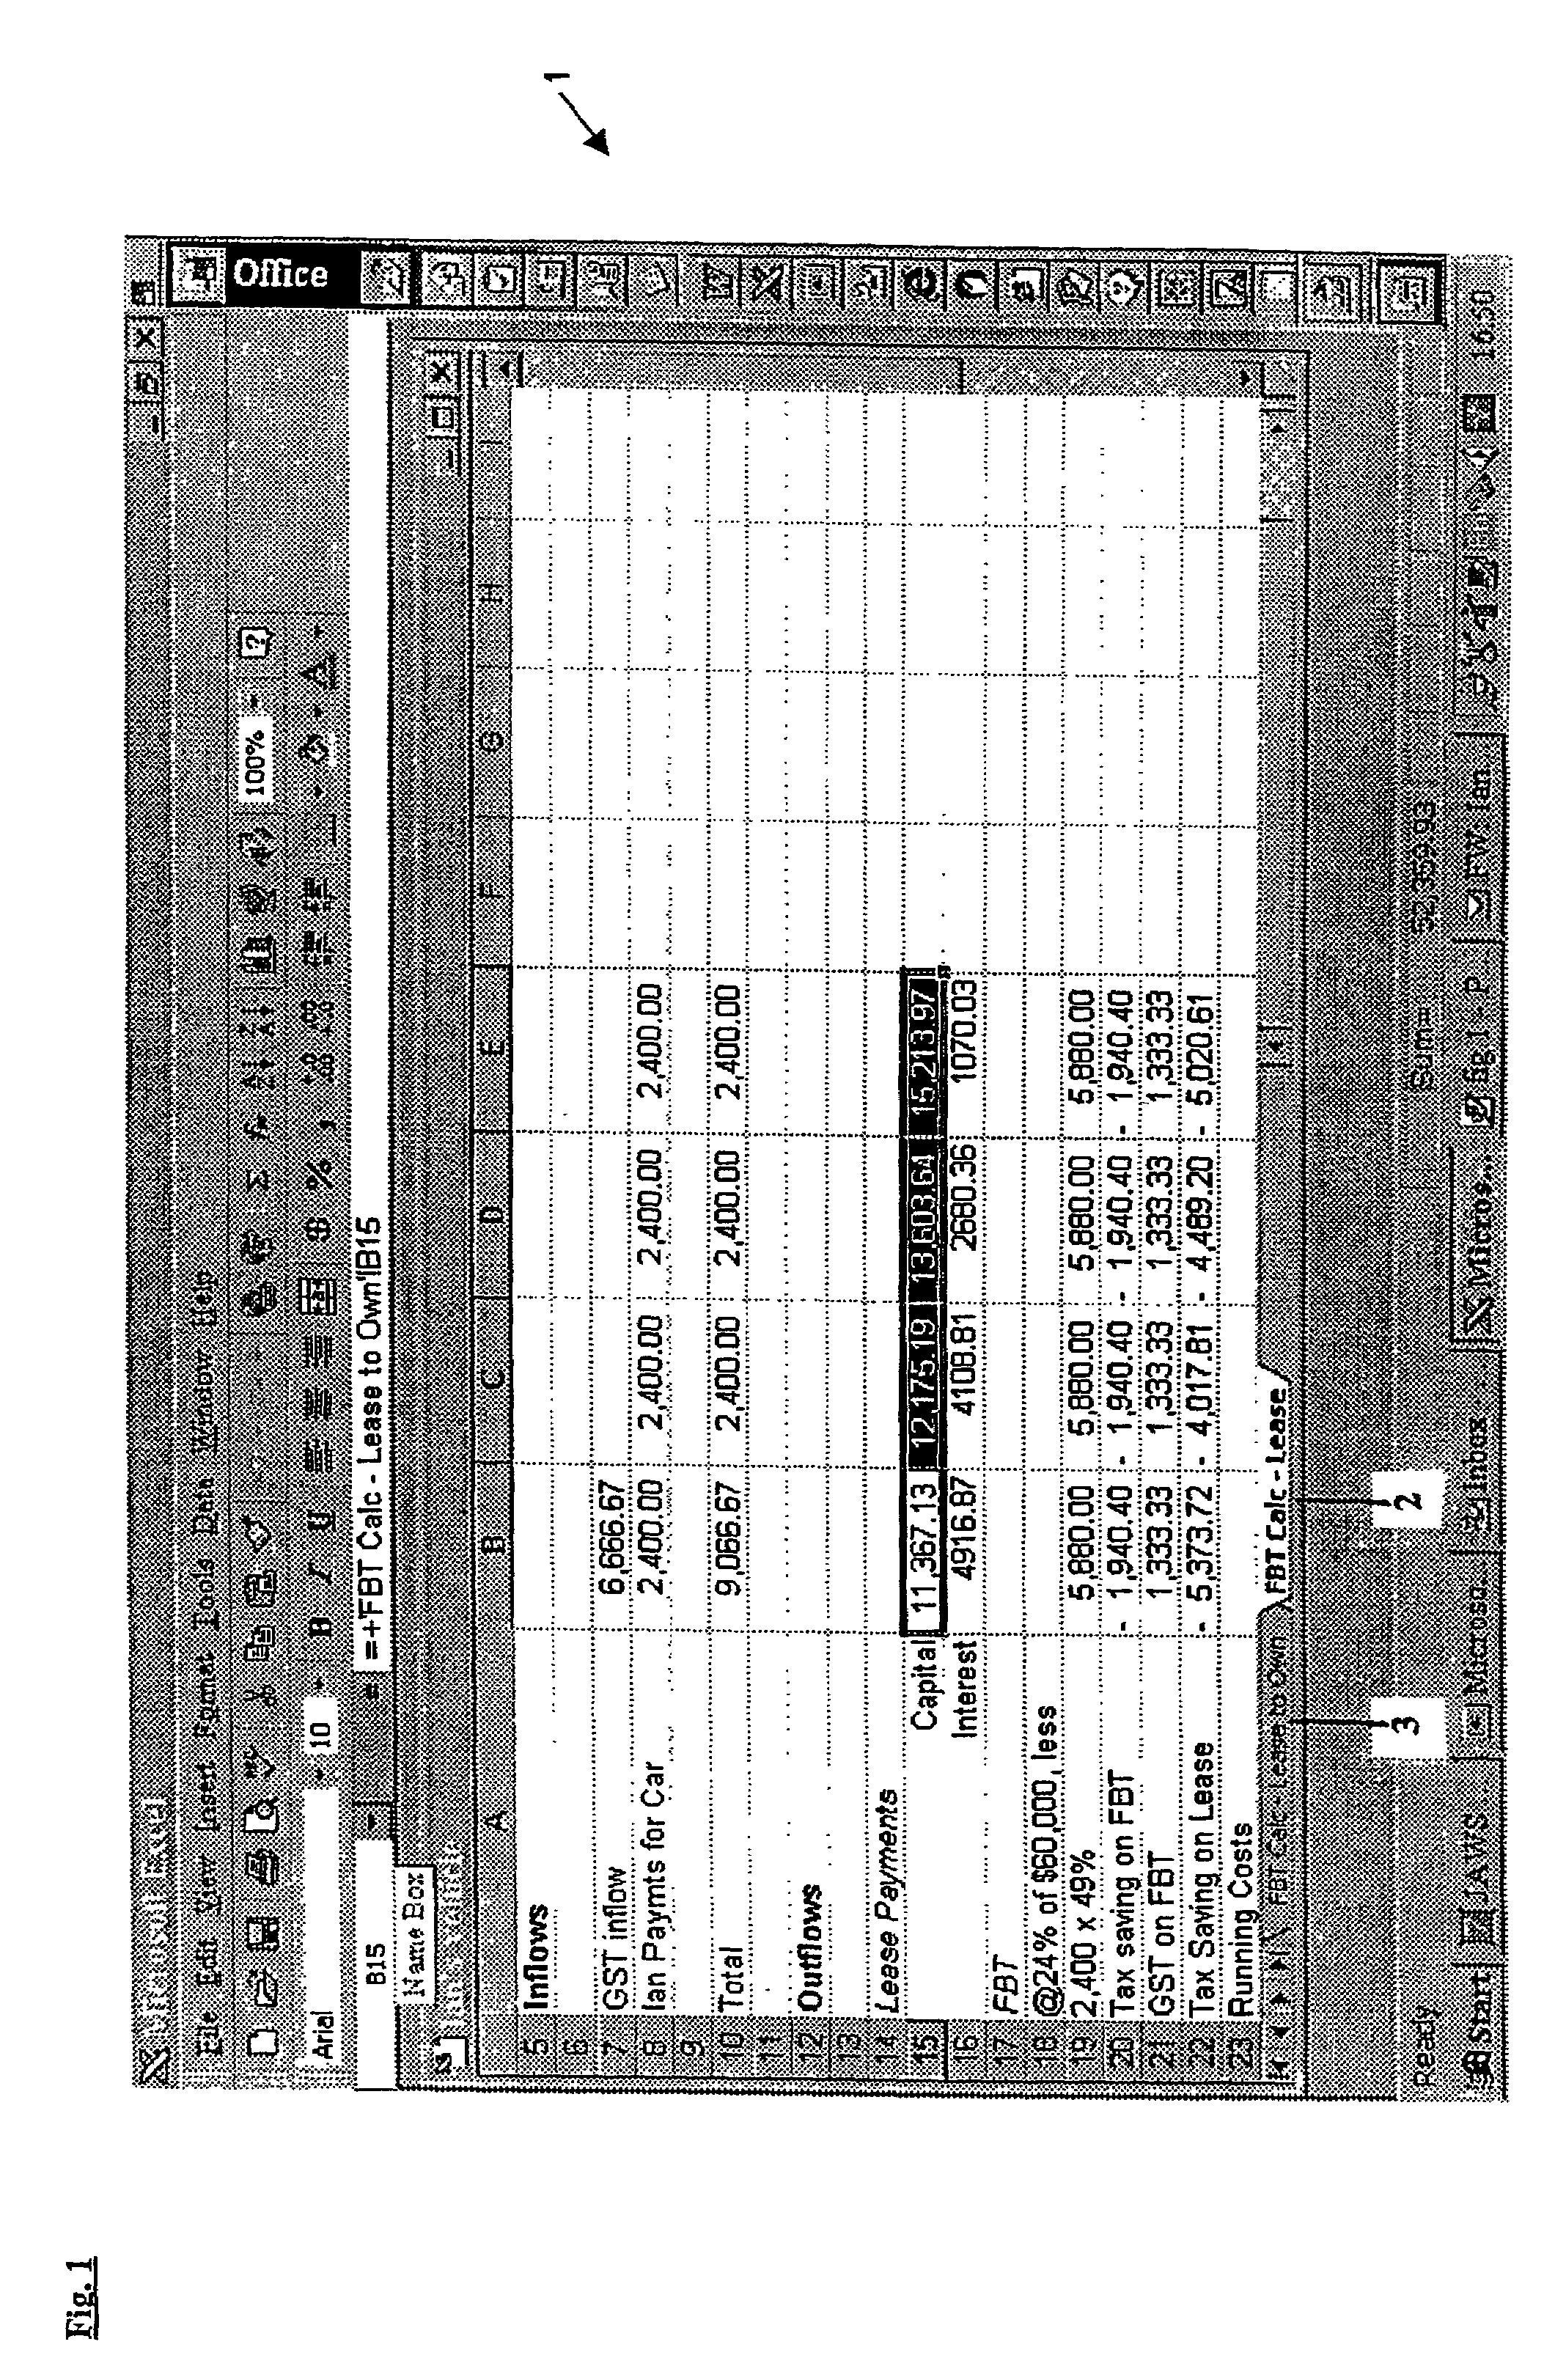
[0057]FIG. 1 is a screen display from a MICROSOFT EXCEL program. This illustrates a group of data on a spreadsheet generally indicated by arrow 1 on the screen. The associated tab (2) indicates that the data we are looking at relates to “FBT Calc—Lease”.
[0058]The screen also shows that there is a second group of data (not shown) and positioned visually under the first group of data. The indicator that there is a second group of data is the tab (3) which reads “FBT Calc—Lease to Own”.
[0059]To view the second group of data, it is necessary to select the tab (3). However, in doing so the first group of data is obscured by the second group of data. Thus, the effect of a change on one group of data is not immediately discernable as the user cannot see the other group of data.
[0060]It can also be seen that it can be difficult for the user to select a particular cell given that half of the data is obscured at any one time.
[0061]It should also be appreciated that spreadsheet programs of thi...
PUM
 Abstract
Description
Claims
Application Information