System and method for displaying graphs

a graph and graphing function technology, applied in the field of computer system displays, can solve problems such as difficult reading of graphs on paper

Inactive Publication Date: 2009-12-29
BLUE YONDER GRP INC
View PDF24 Cites 37 Cited by
  • Summary
  • Abstract
  • Description
  • Claims
  • Application Information

AI Technical Summary

Benefits of technology

[0010]According to the present invention, a system and method for displaying graphs on a computer display organize the data and axes of the display hierarchically. The user is allowed to select which levels of the hierarchy are to be displayed, thereby controlling the look of the display. Data at lower hierarchical levels is aggregated at the level chosen for display. By varying the chosen display levels, the user changes the nature of the display on the computer monitor.

Problems solved by technology

Such graphs are difficult to read on paper, but software rotation techniques and 3-dimensional perspective displays make this approach viable.

Method used


Image

  • System and method for displaying graphs
  • System and method for displaying graphs
  • System and method for displaying graphs

Examples


Embodiment Construction

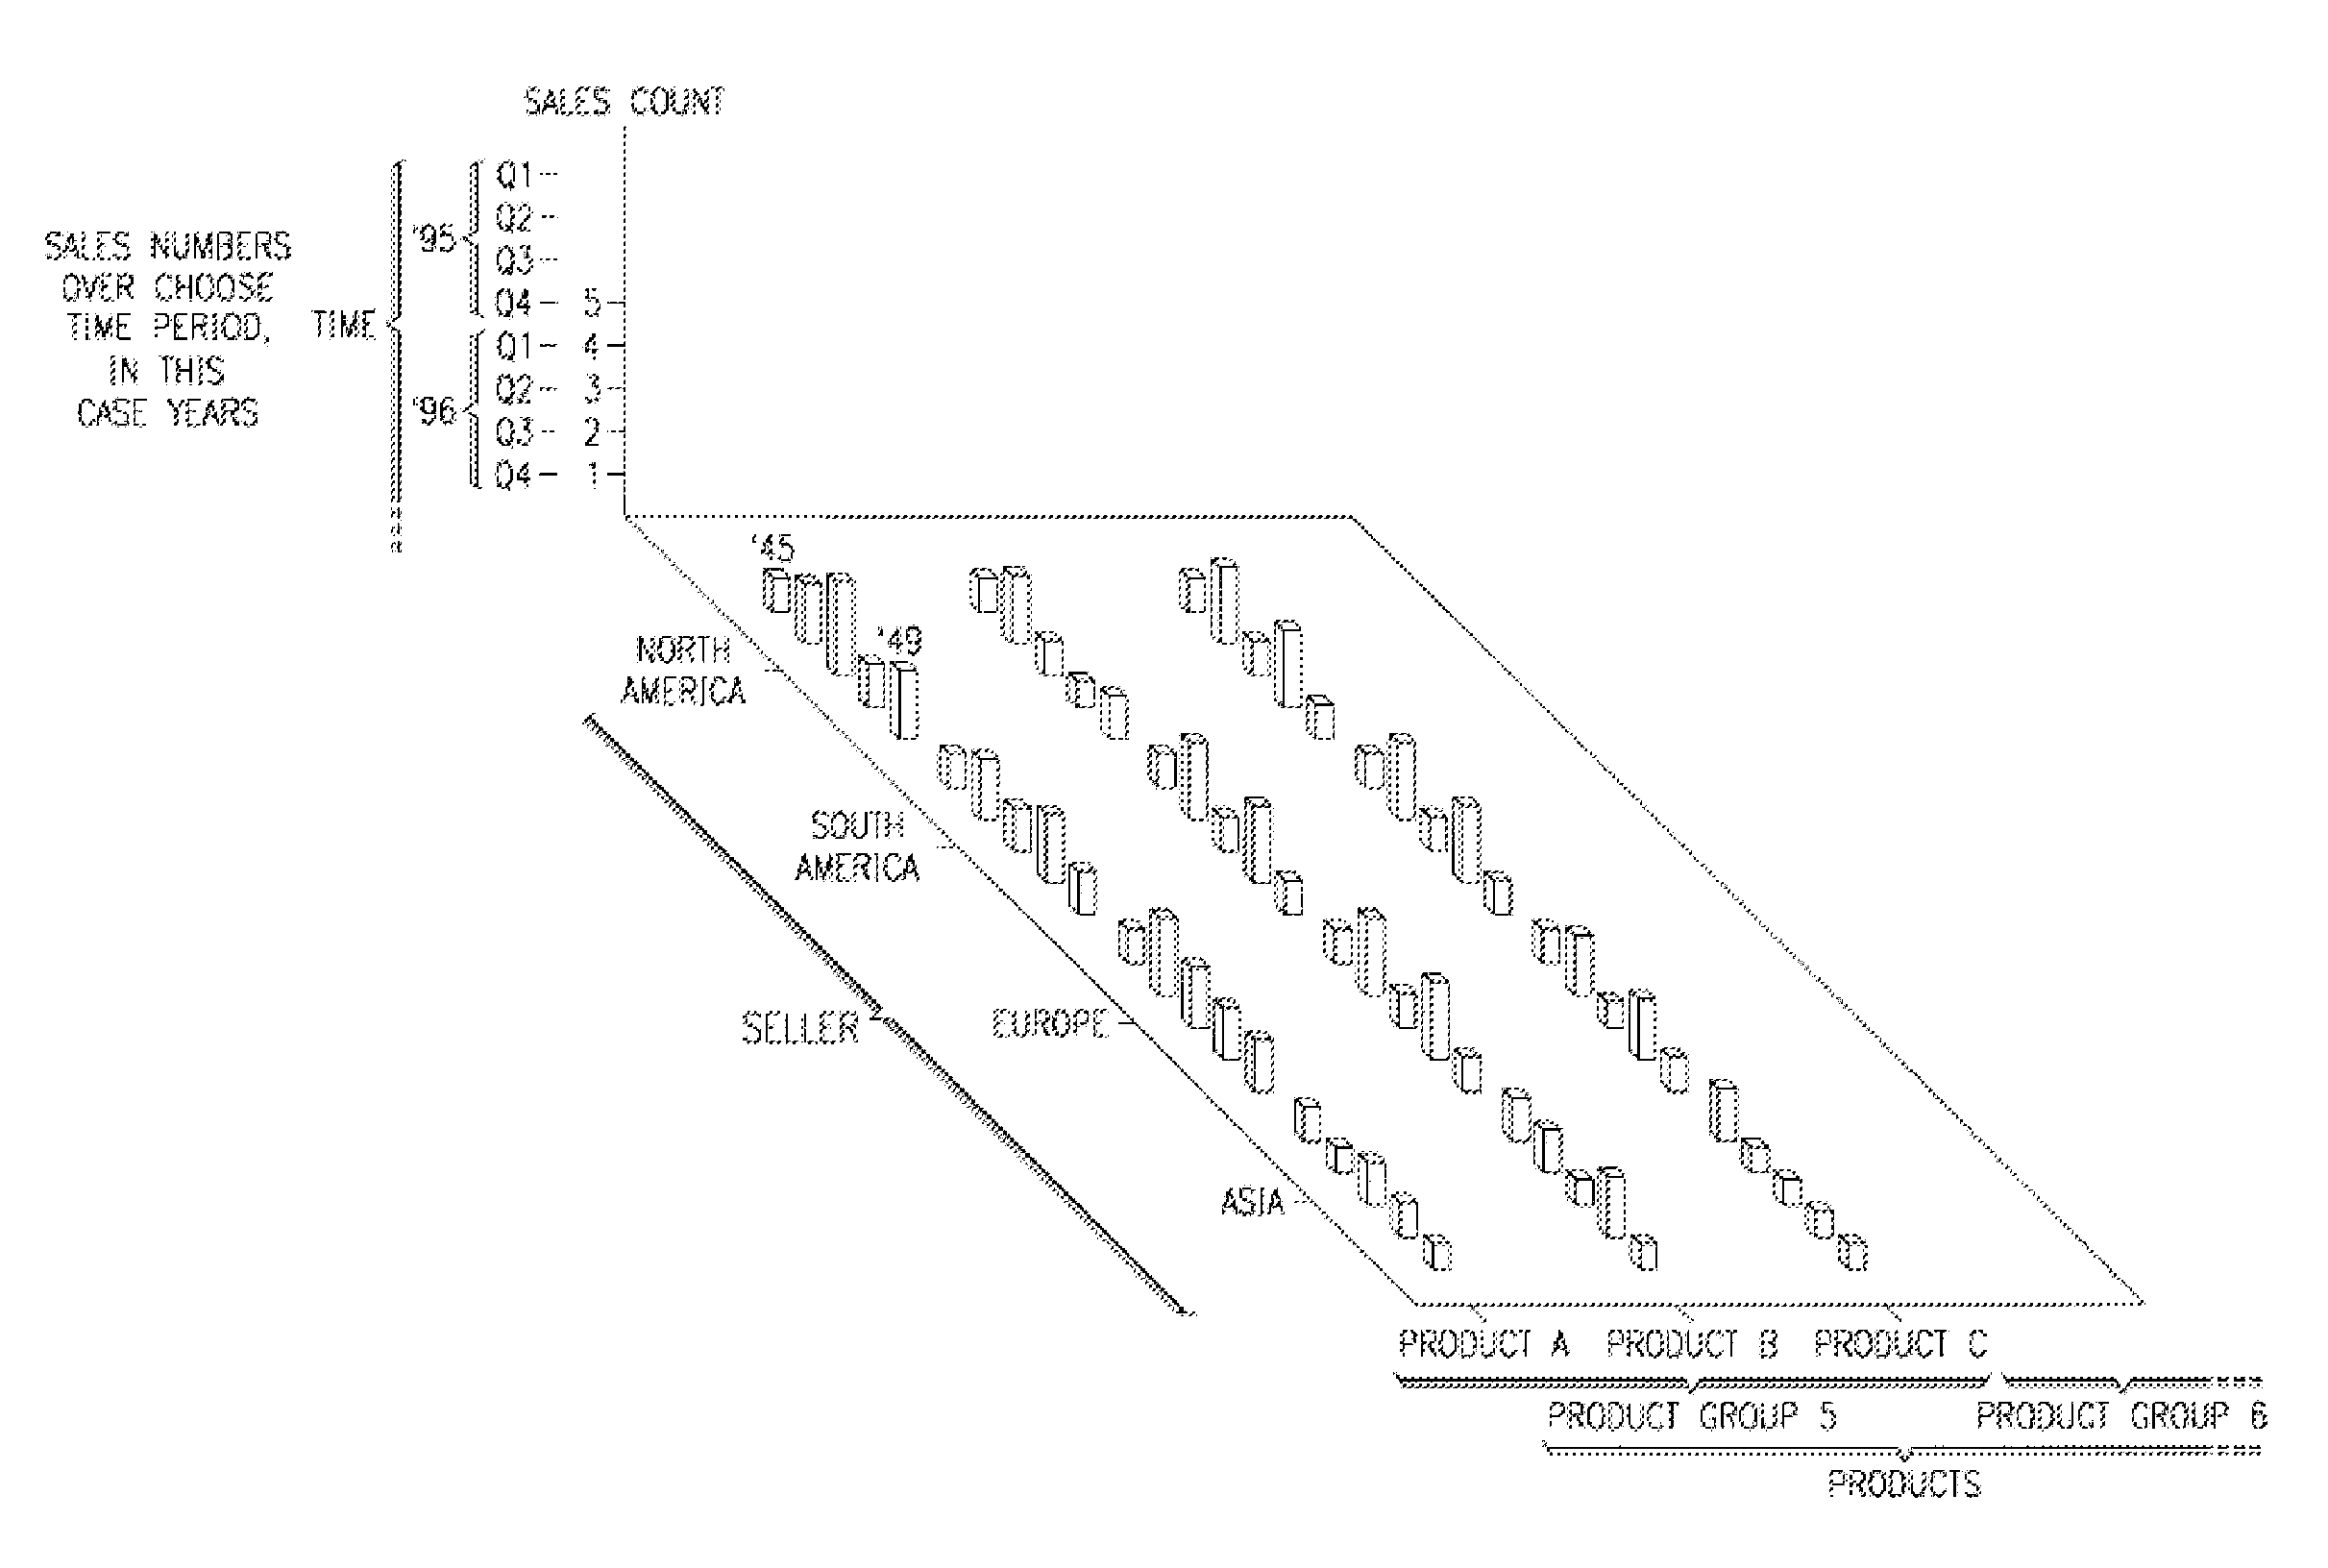
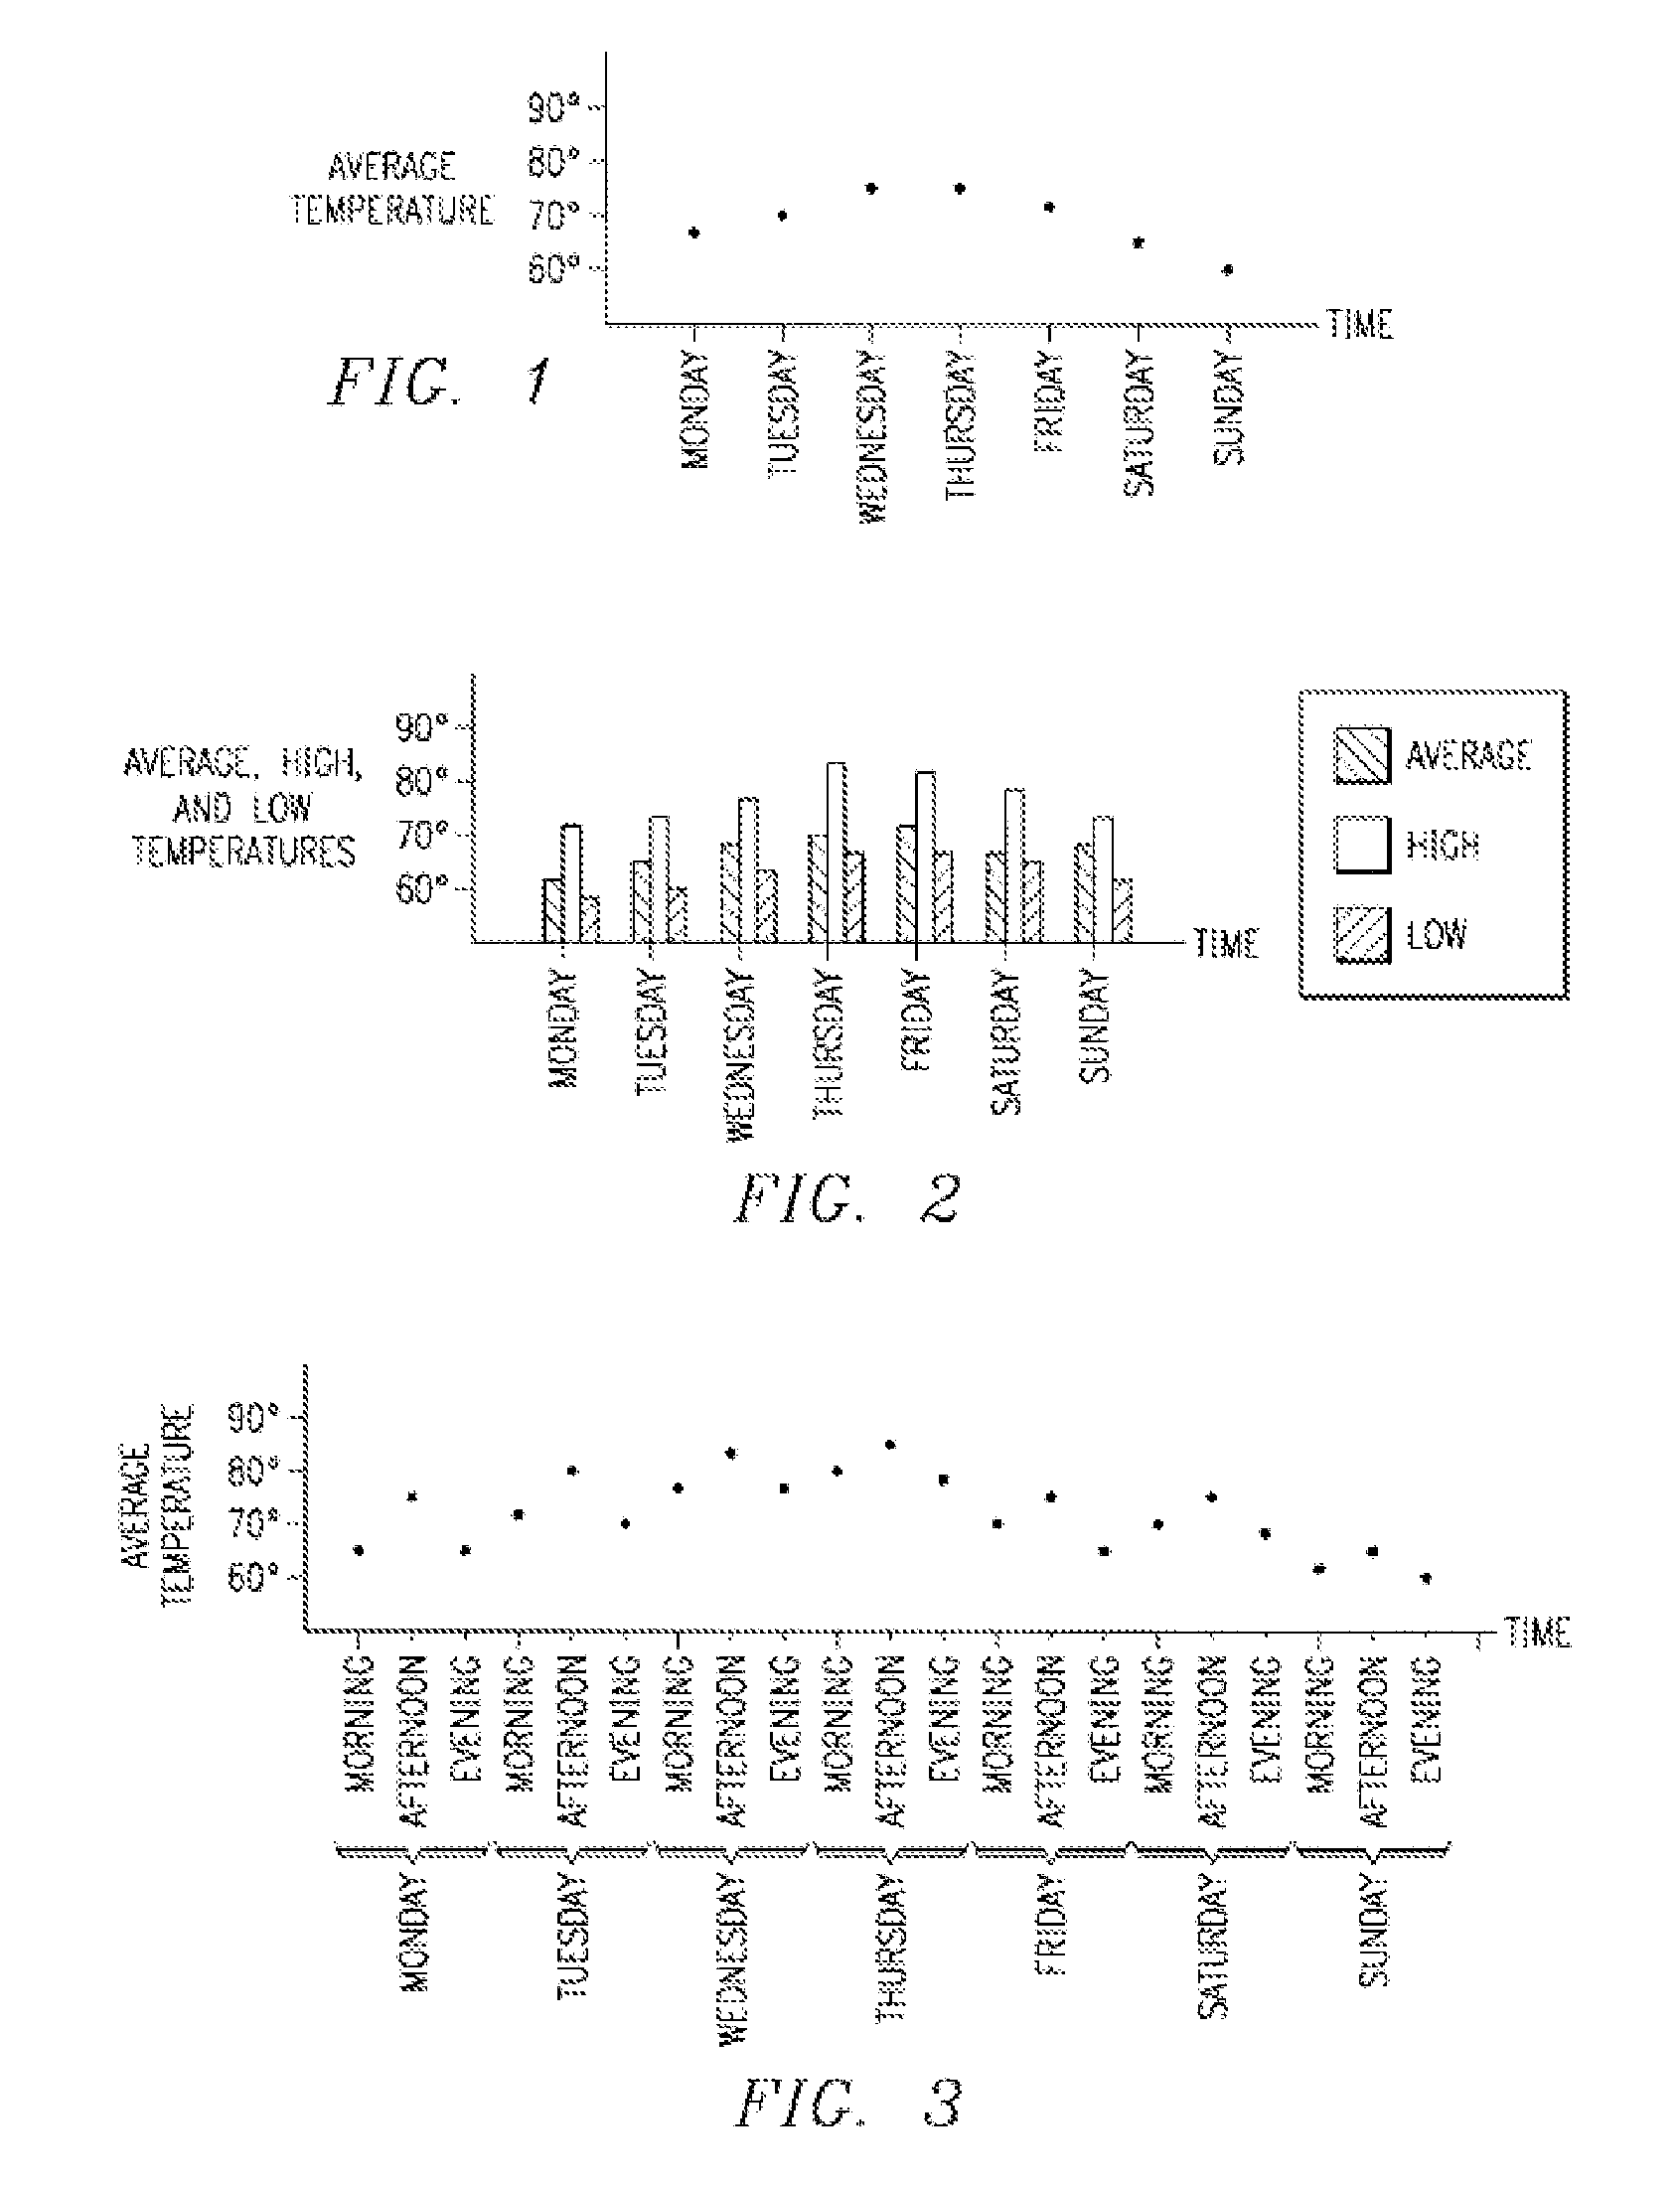
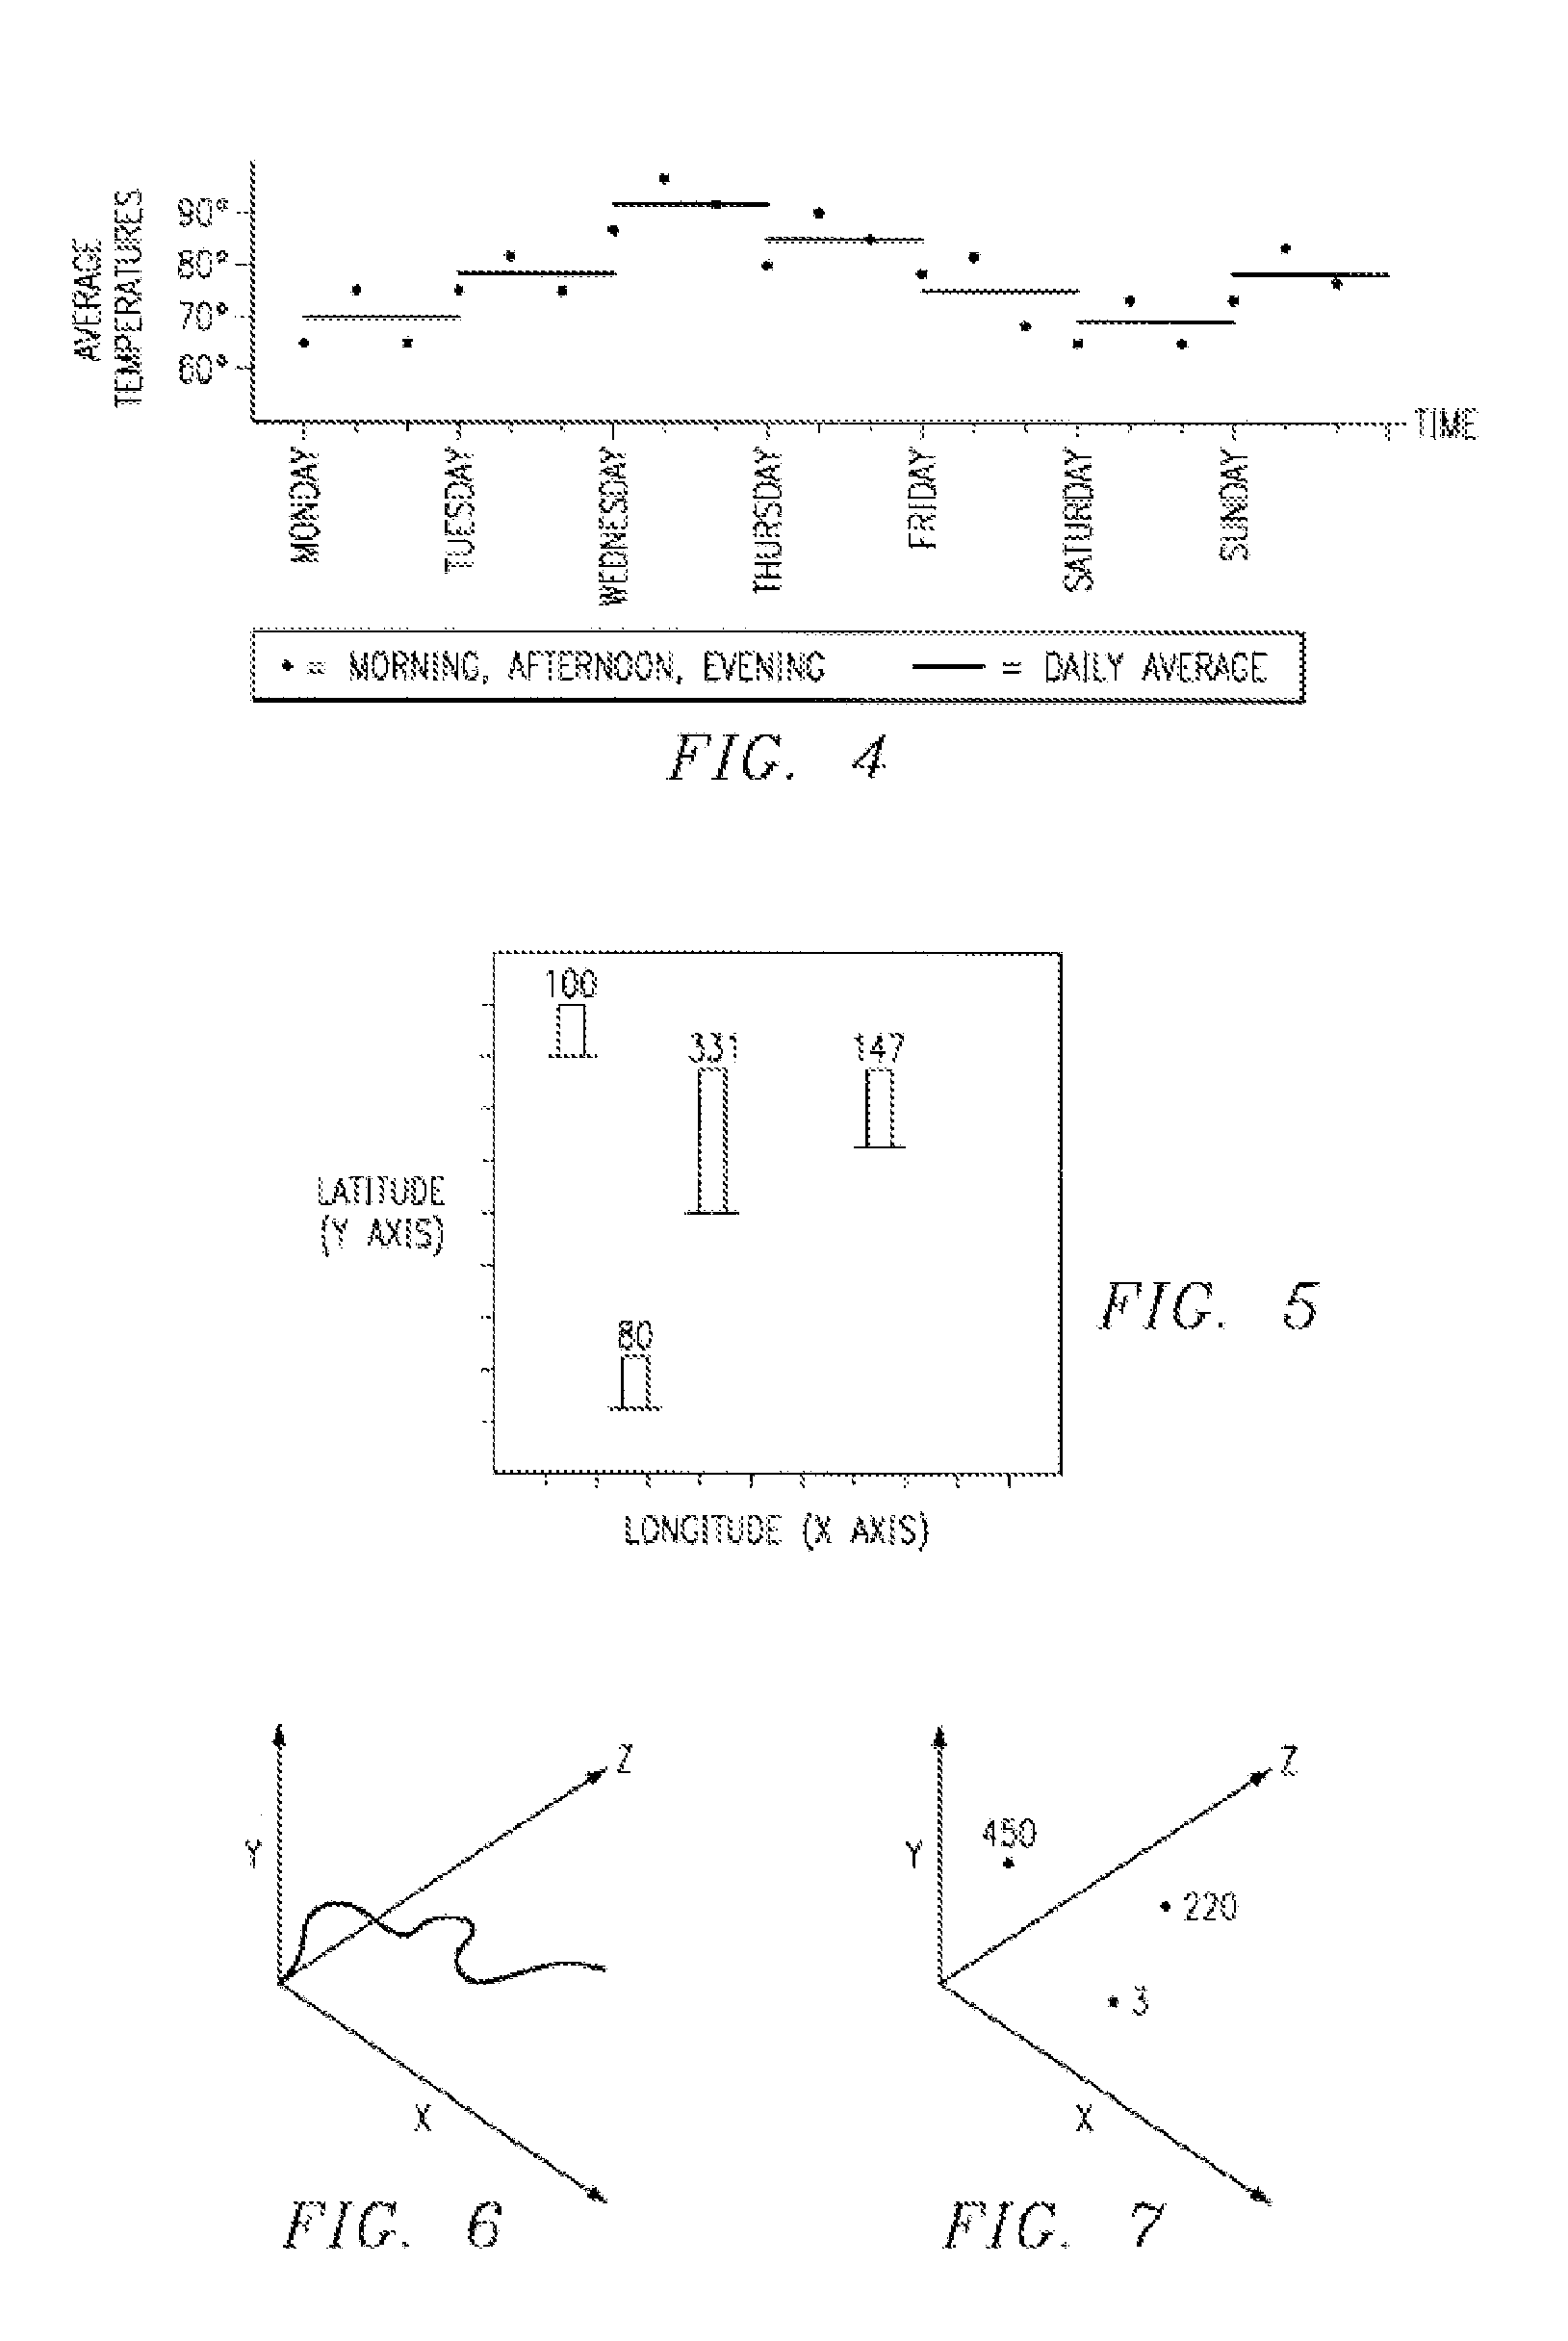
[0015]The present invention employs a computer graphics user interface (GUI) to advance the state of the art in graphing functions. It improves over the prior art by providing a mechanism for displaying the functional values of user-chosen aggregates of the function's input data. Prior art systems can display aggregated values such as the temperature on Monday, along with the unaggregated values—the temperature on Monday morning, afternoon, and evening. The weakness in such graphs is that the viewer cannot choose the level of aggregation. In the previous example, the graph designer chose daily aggregations. A viewer might instead want to see weekly aggregations of various types, such as weekly average temperatures, weekly morning average temperatures, etc. Alternatively, the user might want to see the graph aggregated by weekdays and weekends. The present invention provides such a mechanism in a graphics user interface in which the graph axes are organized in hierarchies (tree struc...


PUM


Abstract

A system and method for displaying graphs on a computer display organize the data and axes of the display hierarchically. The user is allowed to select which levels of the hierarchy are to be displayed, thereby controlling the look of the display. Data at lower hierarchical levels is aggregated at the level chosen for display. By varying the chosen display levels, the user changes the nature of the display on the computer monitor.

Description

CROSS REFERENCE TO RELATED APPLICATIONS[0001]This application claims the benefit of U.S. Provisional Application No. 60 / 158,651, filed Oct. 8, 1999, titled AGGREGATION MECHANISM FOR FUNCTIONAL GRAPHS.BACKGROUND OF THE INVENTION[0002]1. Field of the Invention[0003]The present invention relates generally to computer system displays, and more specifically to a system and method for graphing functions over user selectable aggregations of input data.[0004]2. Description of the Prior Art[0005]The prior art has long been practiced on paper by mathematicians and more recently in computer graphics user interfaces (GUIs) by software engineers. The prior art graphs a function on a grid of two or three axes commonly labeled X, Y, and Z. One of the axes corresponds to the function output values; the other axis or axes correspond to function data inputs. The axes show relatively simple measurements such as Day of Week vs. Temperature. Point, line or bar displays within the grid display the functi...

Claims


Application Information

Patent Timeline
Patent Type & Authority Patents(United States)
IPC IPC(8): G06T11/20
CPCG06T11/206
Inventor YABLONSKI, MARKBABIN, BRADLEY N.DEBETAZ, WEYLIN J.
Owner BLUE YONDER GRP INC
Why Eureka
Try Eureka