Systems and methods for alarm filtering and management within a real-time data acquisition and monitoring environment

a real-time data acquisition and monitoring environment technology, applied in the field of computer simulation techniques with real-time systems, can solve the problems of superior operation, reduced development cost, and inability to apply in real-time, and achieve the effect of reducing development costs and superior operation, and avoiding the use of predictive failure analysis techniques that do not generally use real-time data that reflect actual system operation

Active Publication Date: 2010-04-06
POWER ANALYTICS CORP
View PDF4 Cites 46 Cited by
  • Summary
  • Abstract
  • Description
  • Claims
  • Application Information

AI Technical Summary

Problems solved by technology

Such simulation techniques have resulted in reduced development costs and superior operation.
Design and production processes have benefited greatly from such computer simulation techniques, and such techniques are relatively well developed, but they have not been applied in real-time, e.g., for real-time operational monitoring and management.
In addition, predictive failure analysis techniques do not generally use real-time data that reflect actual system operation.
Static systems simply cannot adjust to the many daily changes to the electrical system that occur at a facility (e.g., motors and pumps switching on or off, changes to on-site generation status, changes to utility electrical feed .
Without a synchronization or aging ability, reliability indices and predictions are of little value as they are not reflective of the actual operational status of the facility and may lead to false conclusions.
It will be understood that such systems are highly complex, a complexity made even greater as a result of the required redundancy.
For example, current technology often overburdens users with thousands of pieces of information per second from sensory data points that are distributed throughout the monitored electrical power system facility.
Therefore, it is nearly impossible for facility operators, managers and technicians to digest and understand all the sensory data to formulate an accurate understanding of their relevance to the overall status and health of their mission critical power system operations.
Currently, no solution exists for intelligent filtering of real-time power system sensory data into an easy to comprehend visual presentation to help facility operators, managers and technicians quickly understand the current health of their power systems.

Method used


Image

  • Systems and methods for alarm filtering and management within a real-time data acquisition and monitoring environment
  • Systems and methods for alarm filtering and management within a real-time data acquisition and monitoring environment
  • Systems and methods for alarm filtering and management within a real-time data acquisition and monitoring environment

Examples


Embodiment Construction

.”

BRIEF DESCRIPTION OF THE DRAWINGS

[0017]For a more complete understanding of the principles disclosed herein, and the advantages thereof, reference is now made to the following descriptions taken in conjunction with the accompanying drawings, in which:

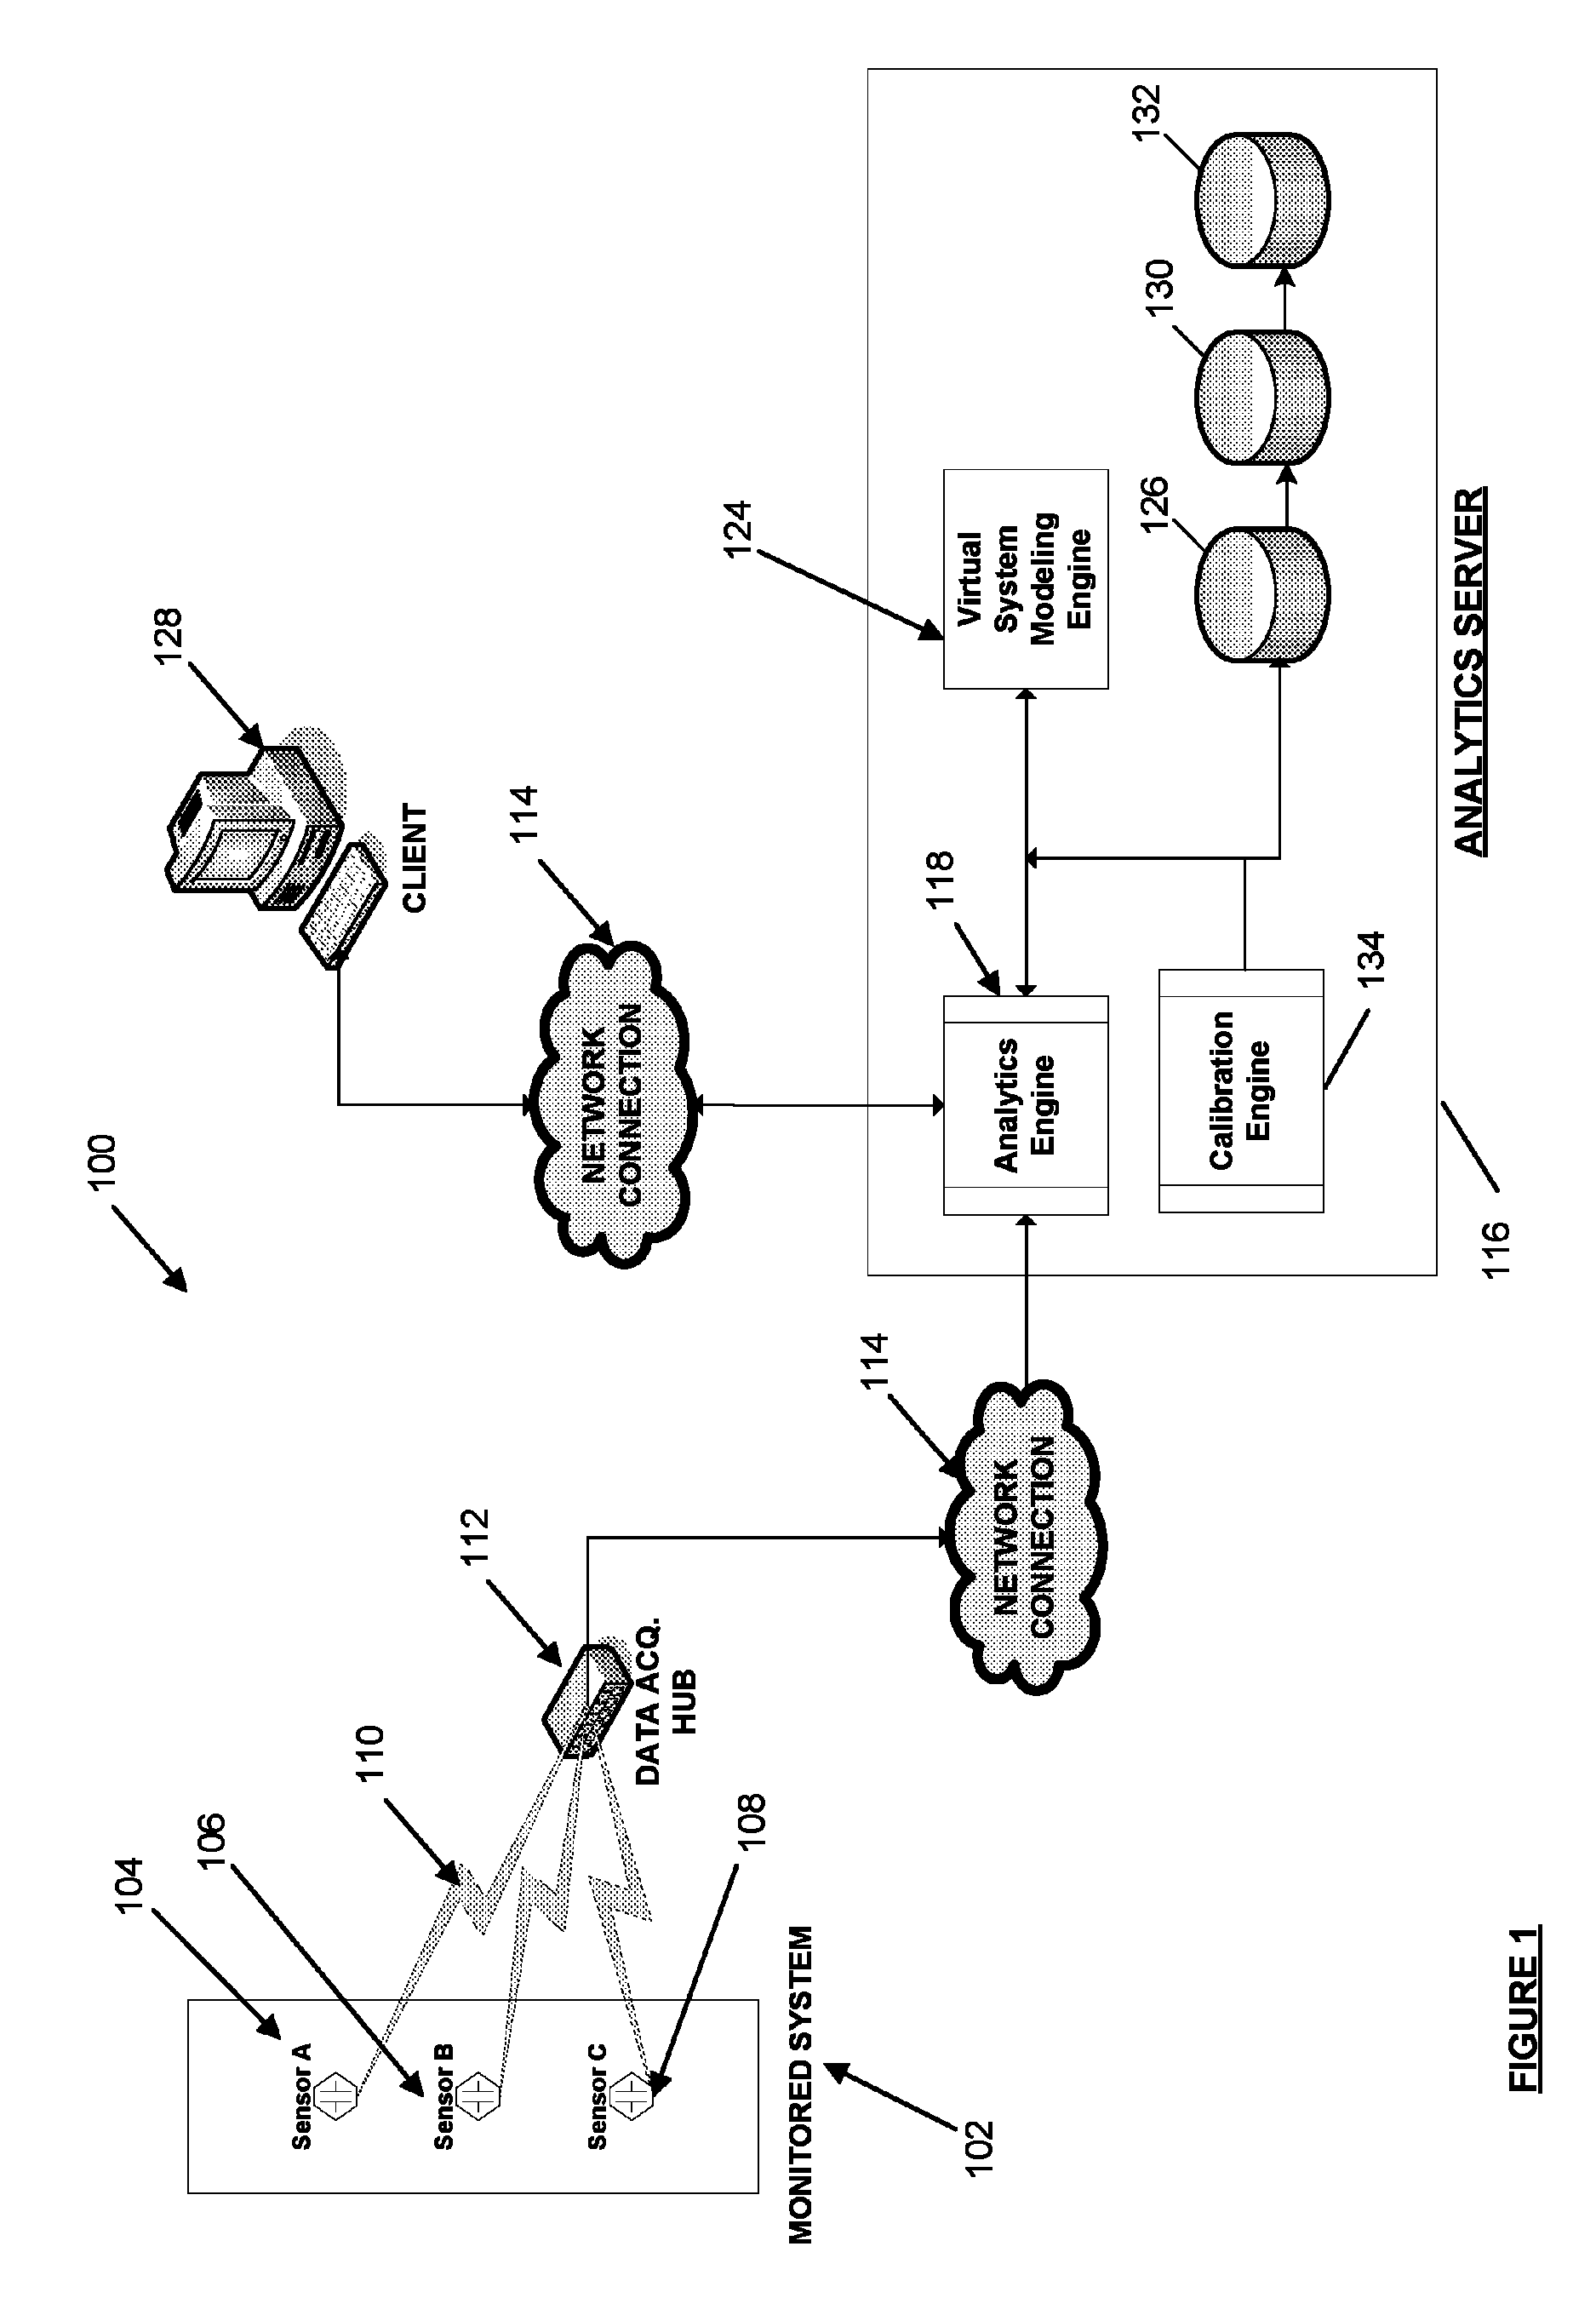
[0018]FIG. 1 is an illustration of a system for utilizing real-time data for predictive analysis of the performance of a monitored system, in accordance with one embodiment.

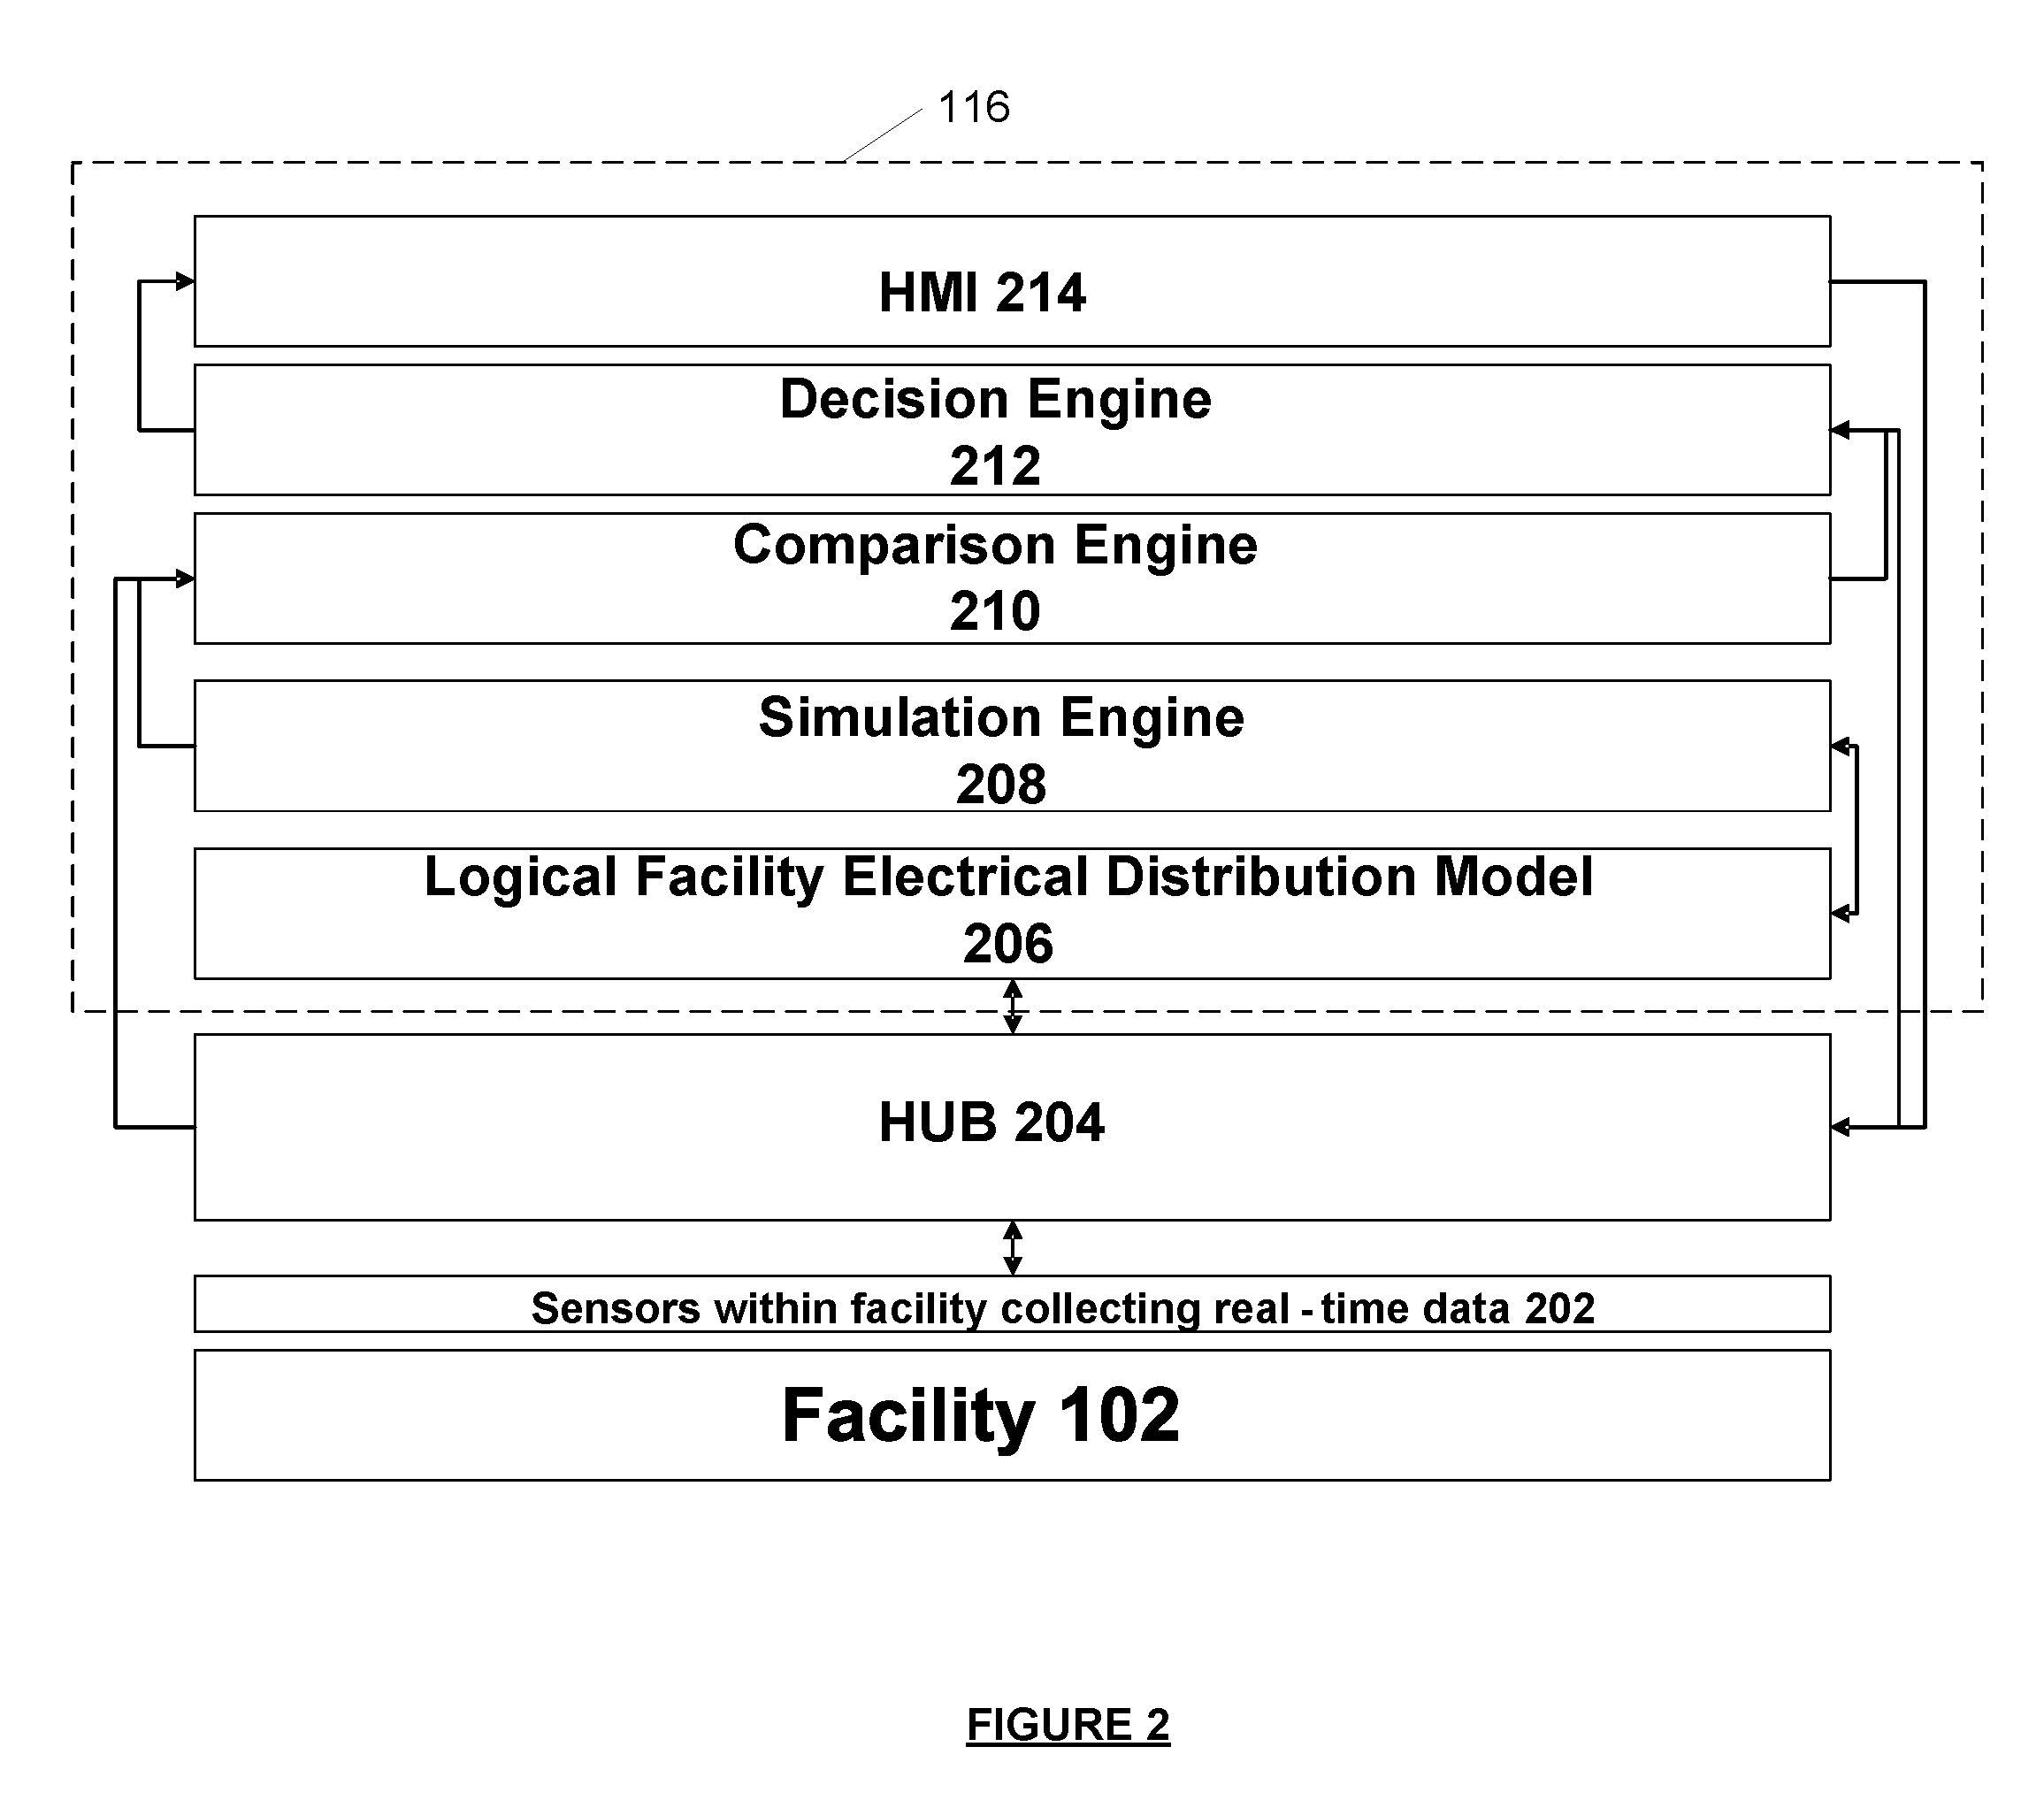
[0019]FIG. 2 is a diagram illustrating a detailed view of an analytics server included in the system of FIG. 1.

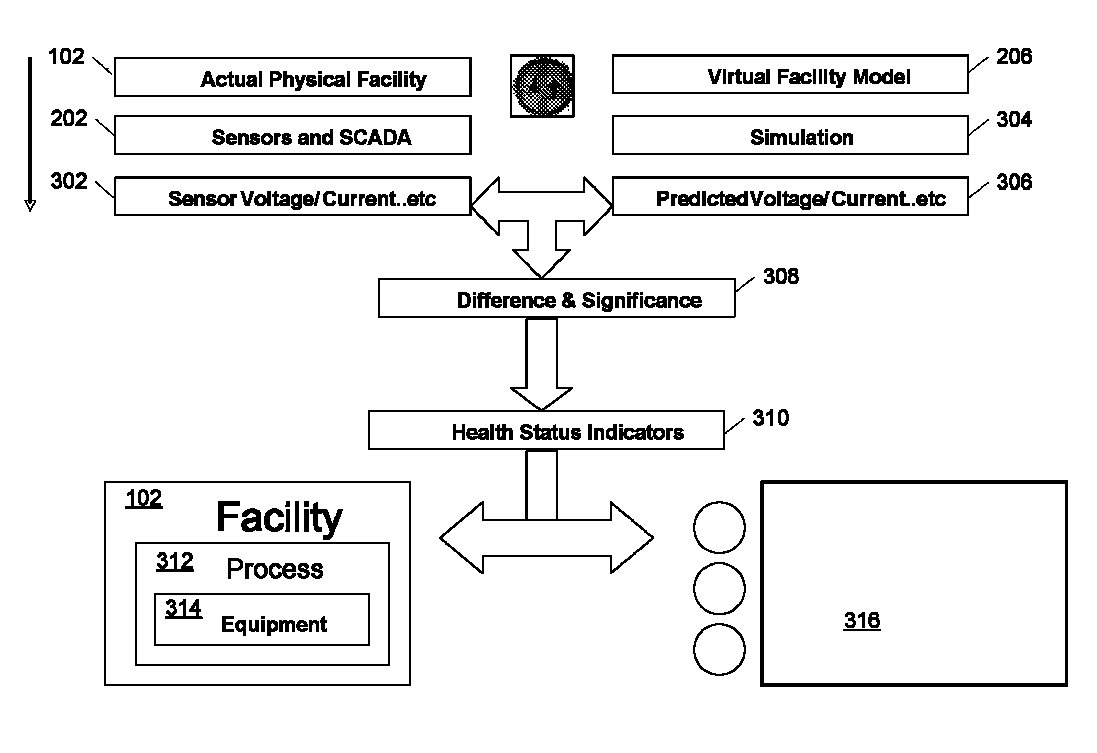
[0020]FIG. 3 is a diagram illustrating how the system of FIG. 1 operates to synchronize the operating parameters between a physical facility and a virtual system model of the facility.

[0021]FIG. 4 is an illustration of the scalability of a system for utilizing real-time data for predictive analysis of the performance of a monitored system, in accordance with one embodiment.

[0022]FIG. 5 is a block diagram that shows the configuration details of the system i...


PUM


Abstract

A system for filtering and interpreting real-time sensory data from an electrical system is disclosed. The system includes a data acquisition component, a power analytics server and a client terminal. The data acquisition component acquires real-time data output from the electrical system. The power analytics sewer is comprised of a virtual system modeling engine, an analytics engine, and a decision engine.The virtual system modeling engine generates predicted data output for the electrical system. The analytics engine monitors real-lime data output and predicted data output of the electrical system. The decision engine compares the real-time data output against the predicted data output to filter out and interpret indicia of electrical system health and performance.The client terminal is communicatively connected to the power analytics server and configured to display the filtered and interpreted indicia.

Description

APPLICATIONS FOR CLAIM OF PRIORITY[0001]This application claims the benefit under 35 U.S.C. §119(e) of U.S. Provisional Application Ser. No. 60 / 807,889 filed Jul. 20, 2006. This application also claims priority as a Continuation-In-Part under 35 U.S.C. §120 to U.S. patent application Ser. No. 11 / 734,709 filed Apr. 12, 2007 and entitled “Systems and Methods for Performing Automatic Real-Time Harmonics Analyses for use in Real-Time Power Analytics of an Electrical Power Distribution System,” which in turn claims priority as a Continuation-in-part under 35 U.S.C. §120 to U.S. application Ser. No. 11 / 717,378 filed Mar. 12, 2007 and entitled “Systems and Methods for Real-Time Protective Device Evaluation in an Electrical Power Distribution System,” and to U.S. Provisional Patent Application Ser. No. 60 / 792,175 filed Apr. 12, 2006.BACKGROUND[0002]I. Field of the Invention[0003]The present invention relates generally to computer modeling and management of systems and, more particularly, to...

Claims


Application Information

Patent Timeline
Patent Type & Authority Patents(United States)
IPC IPC(8): G06F19/00
CPCG05B17/02G05B23/0272G06F17/5009G06F2217/78G06F2217/04G06F30/20G06F2111/02G06F2119/06
Inventor NASLE, ADIB
Owner POWER ANALYTICS CORP
Why Eureka
Try Eureka