
Expression data analysis systems and methods

a technology of expression data and analysis systems, applied in the field of expression data analysis systems and methods, can solve the problems of limited number of genes that can be practically analyzed, limited data interpretation, and inability to easily replicate sample large-scale microarrays, so as to reduce or eliminate the primary reliance on single gene normalization and facilitate identification of changes

Active Publication Date: 2010-10-26
JACKSON LAB THE
View PDF9 Cites 3 Cited by
  • Summary
  • Abstract
  • Description
  • Claims
  • Application Information

AI Technical Summary

Benefits of technology

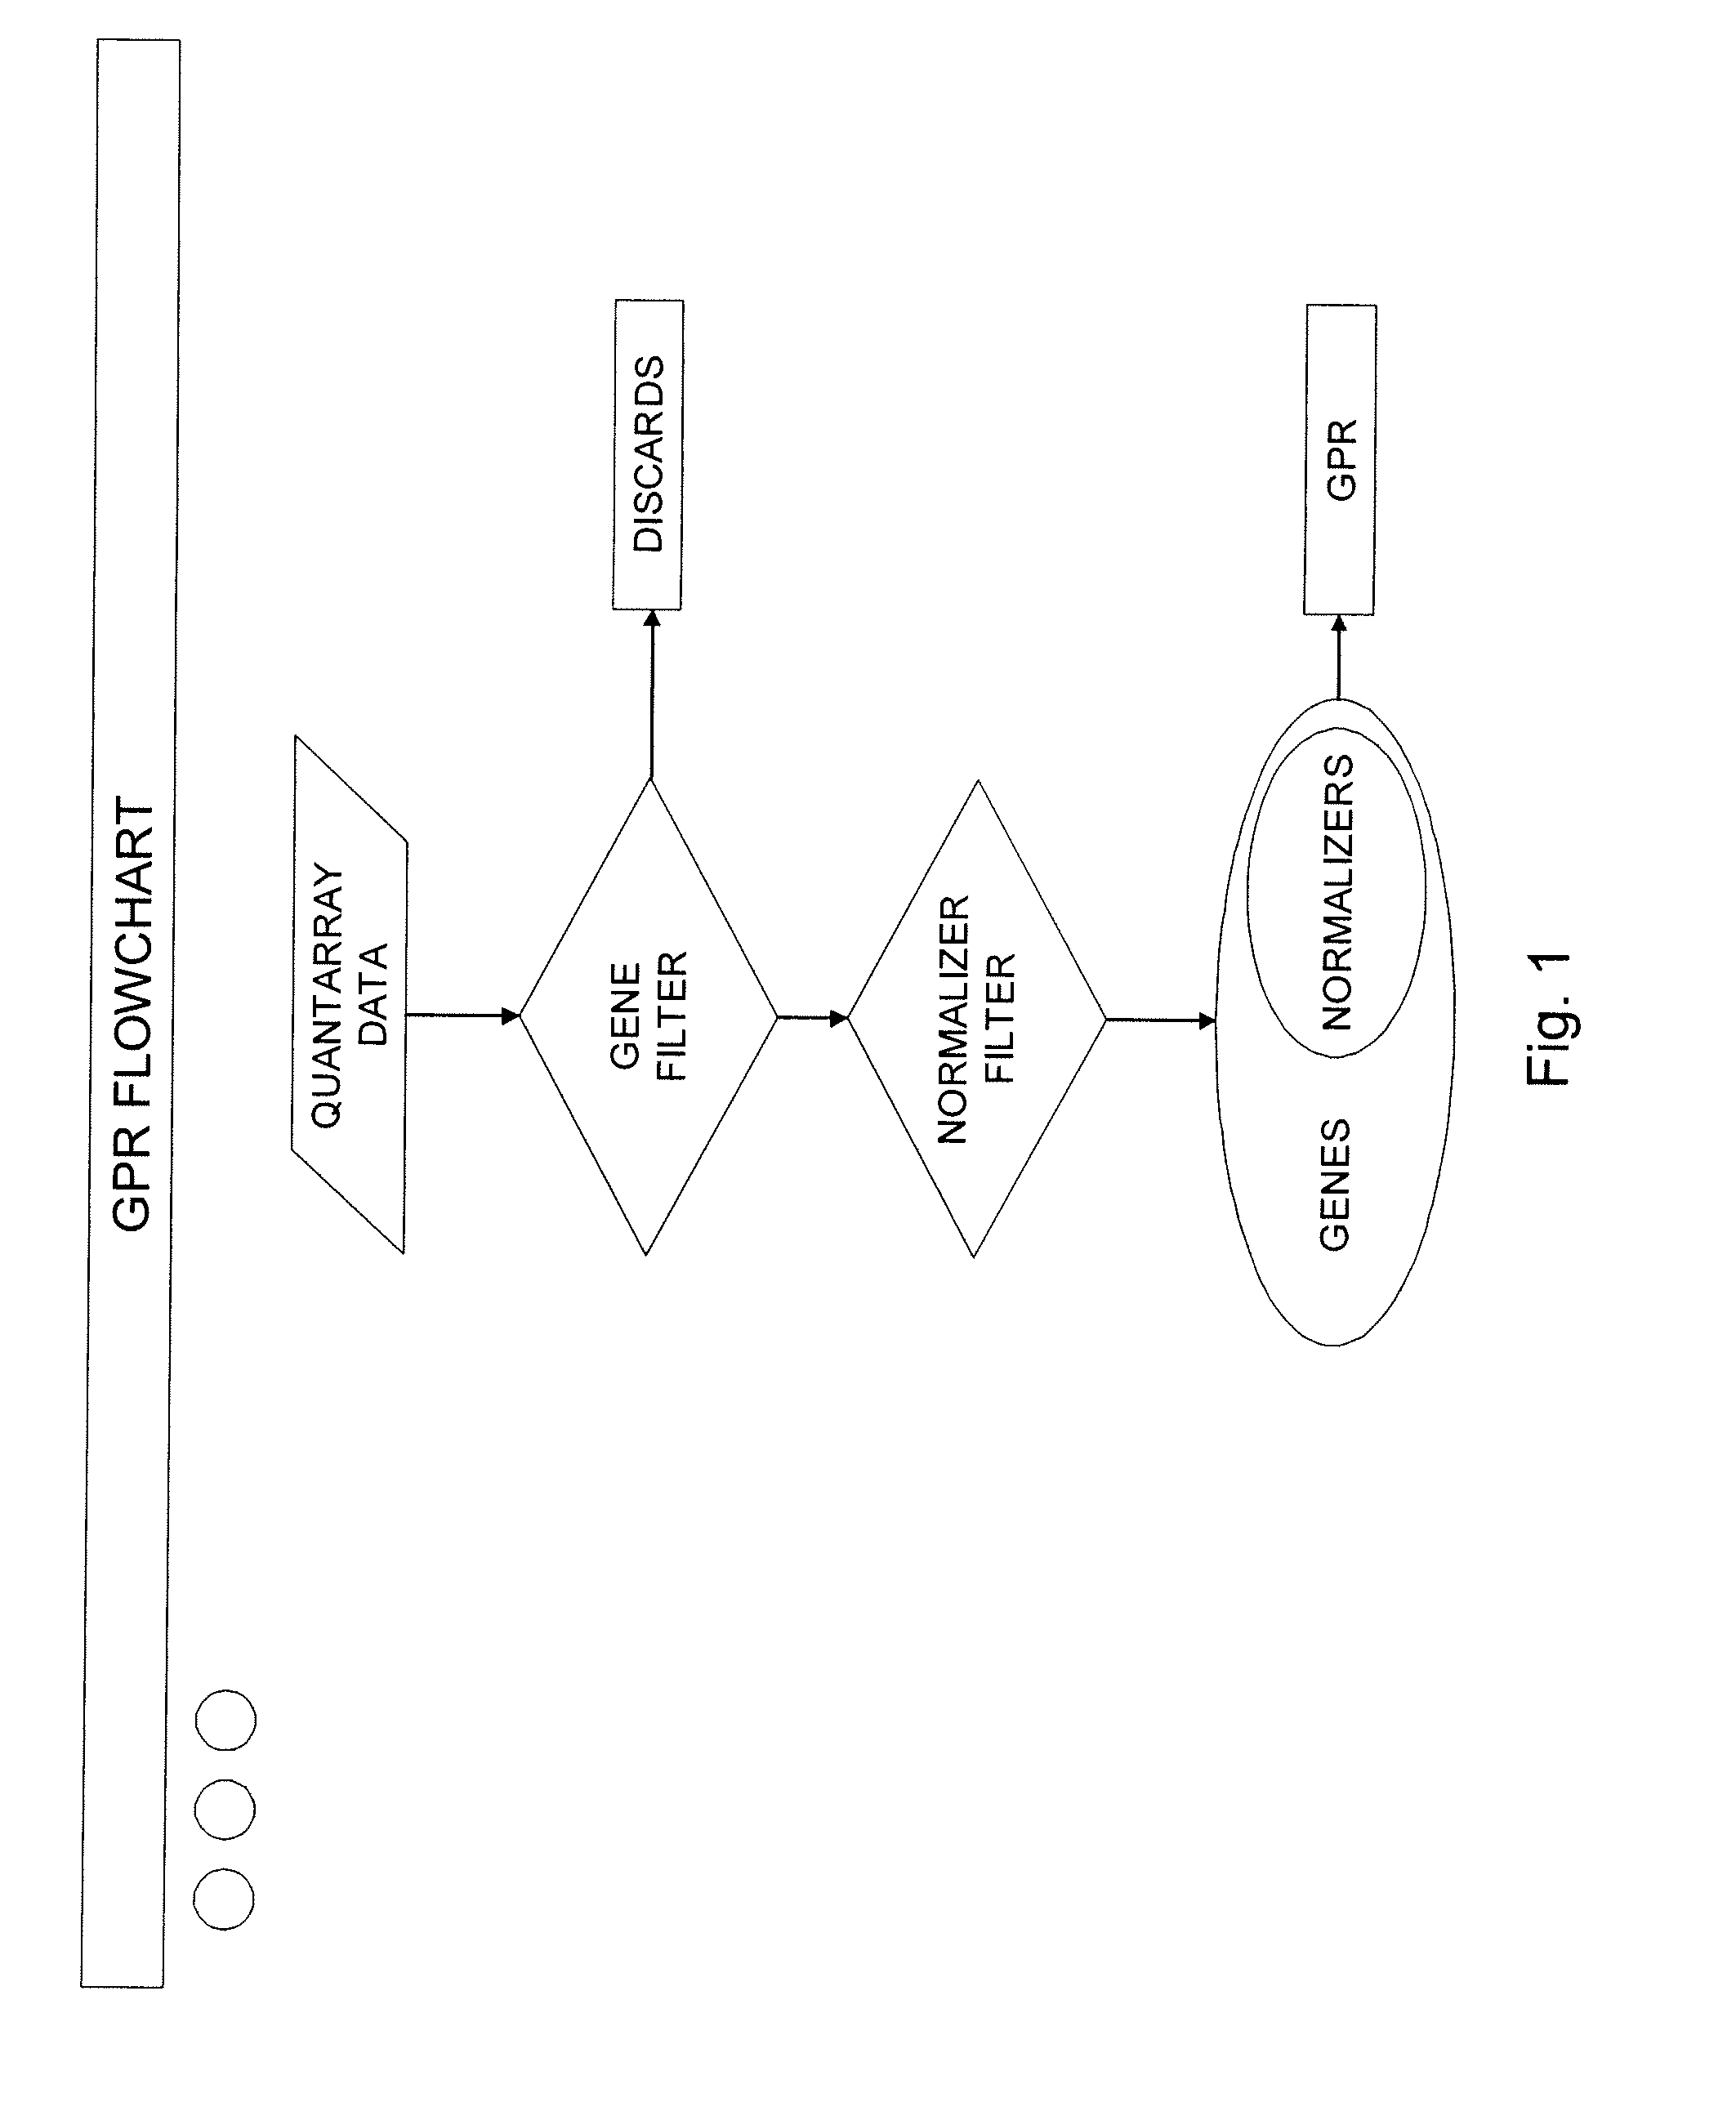
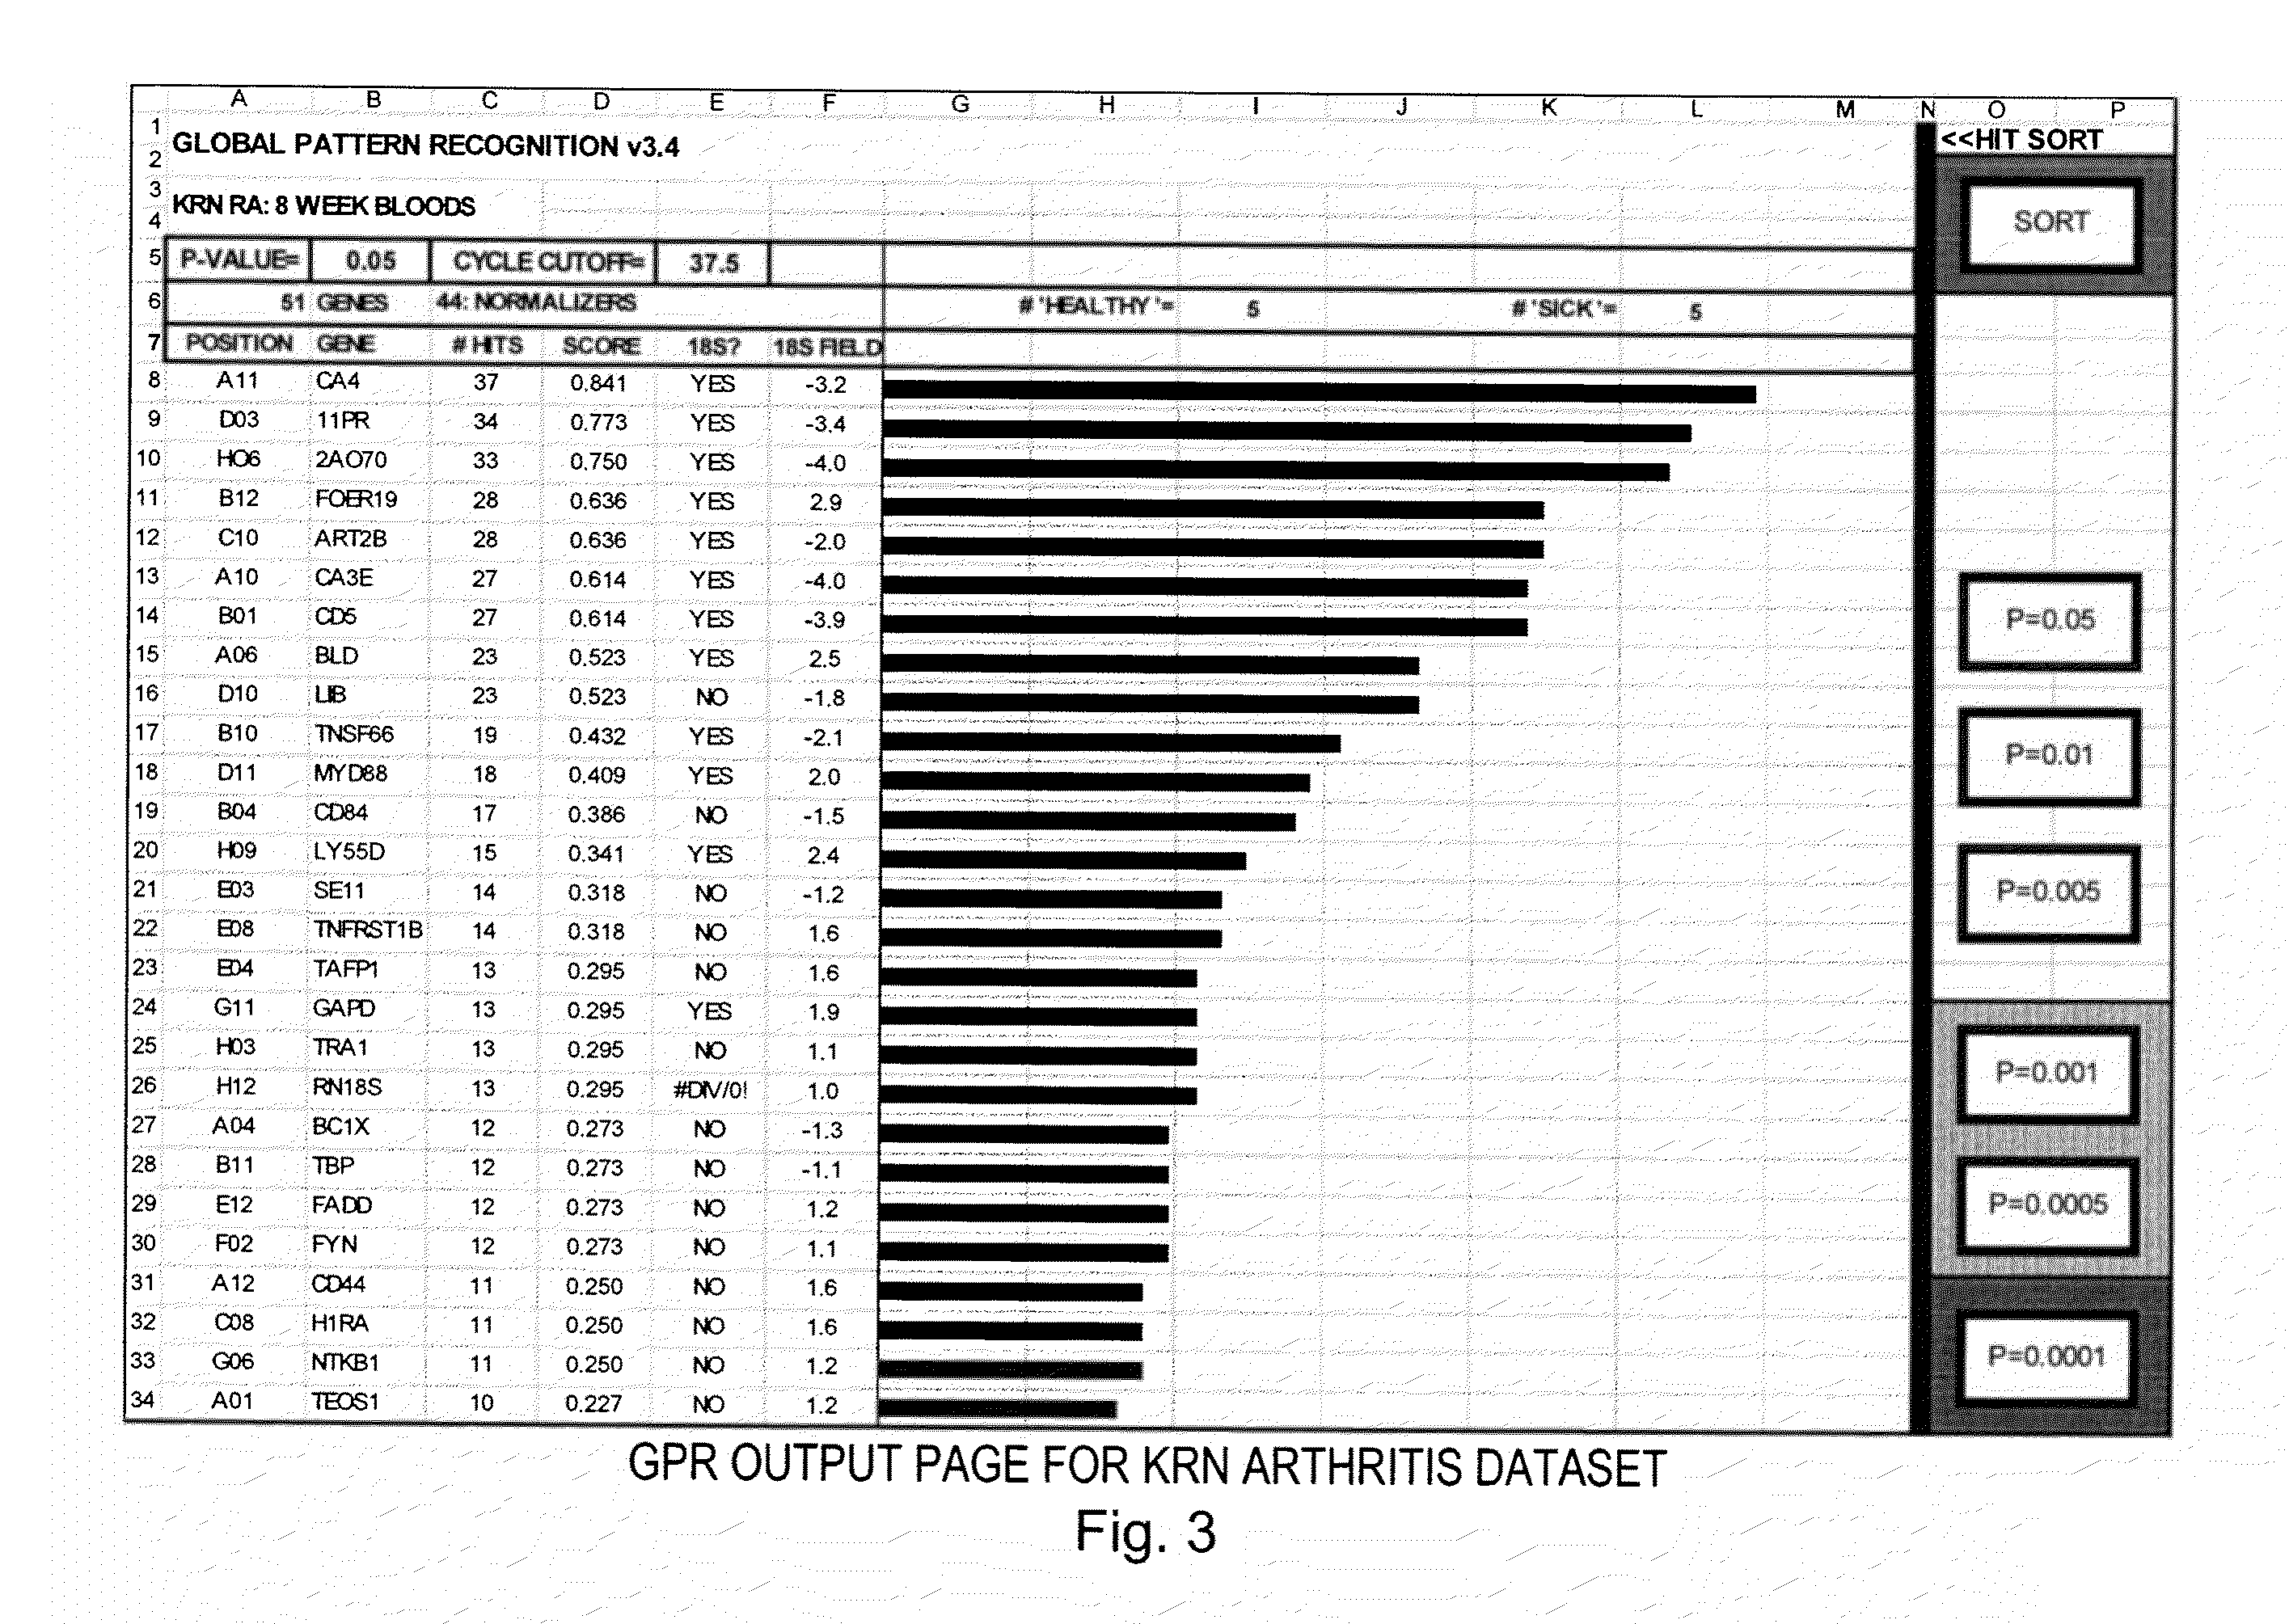
[0010]Global Pattern Recognition (GPR) techniques are available to assist in analyzing complex physiological and other scientific problems. In certain embodiments, such techniques are applied to the analysis of PCR and other gene expression data. To more reliably evaluate expression changes, in for example QPCR data, the systems and methods described herein are used to process datasets of data to identify statistically significant changes in gene expression patterns. By looking for a pattern of change, such systems provide more reliable detection of, for example, biological relevance. Moreover, such systems reduce or eliminate the primary reliance on single gene normalization by using multiple points of reference (normalizers) to establish a gene expression landscape to facilitate identification of changes.
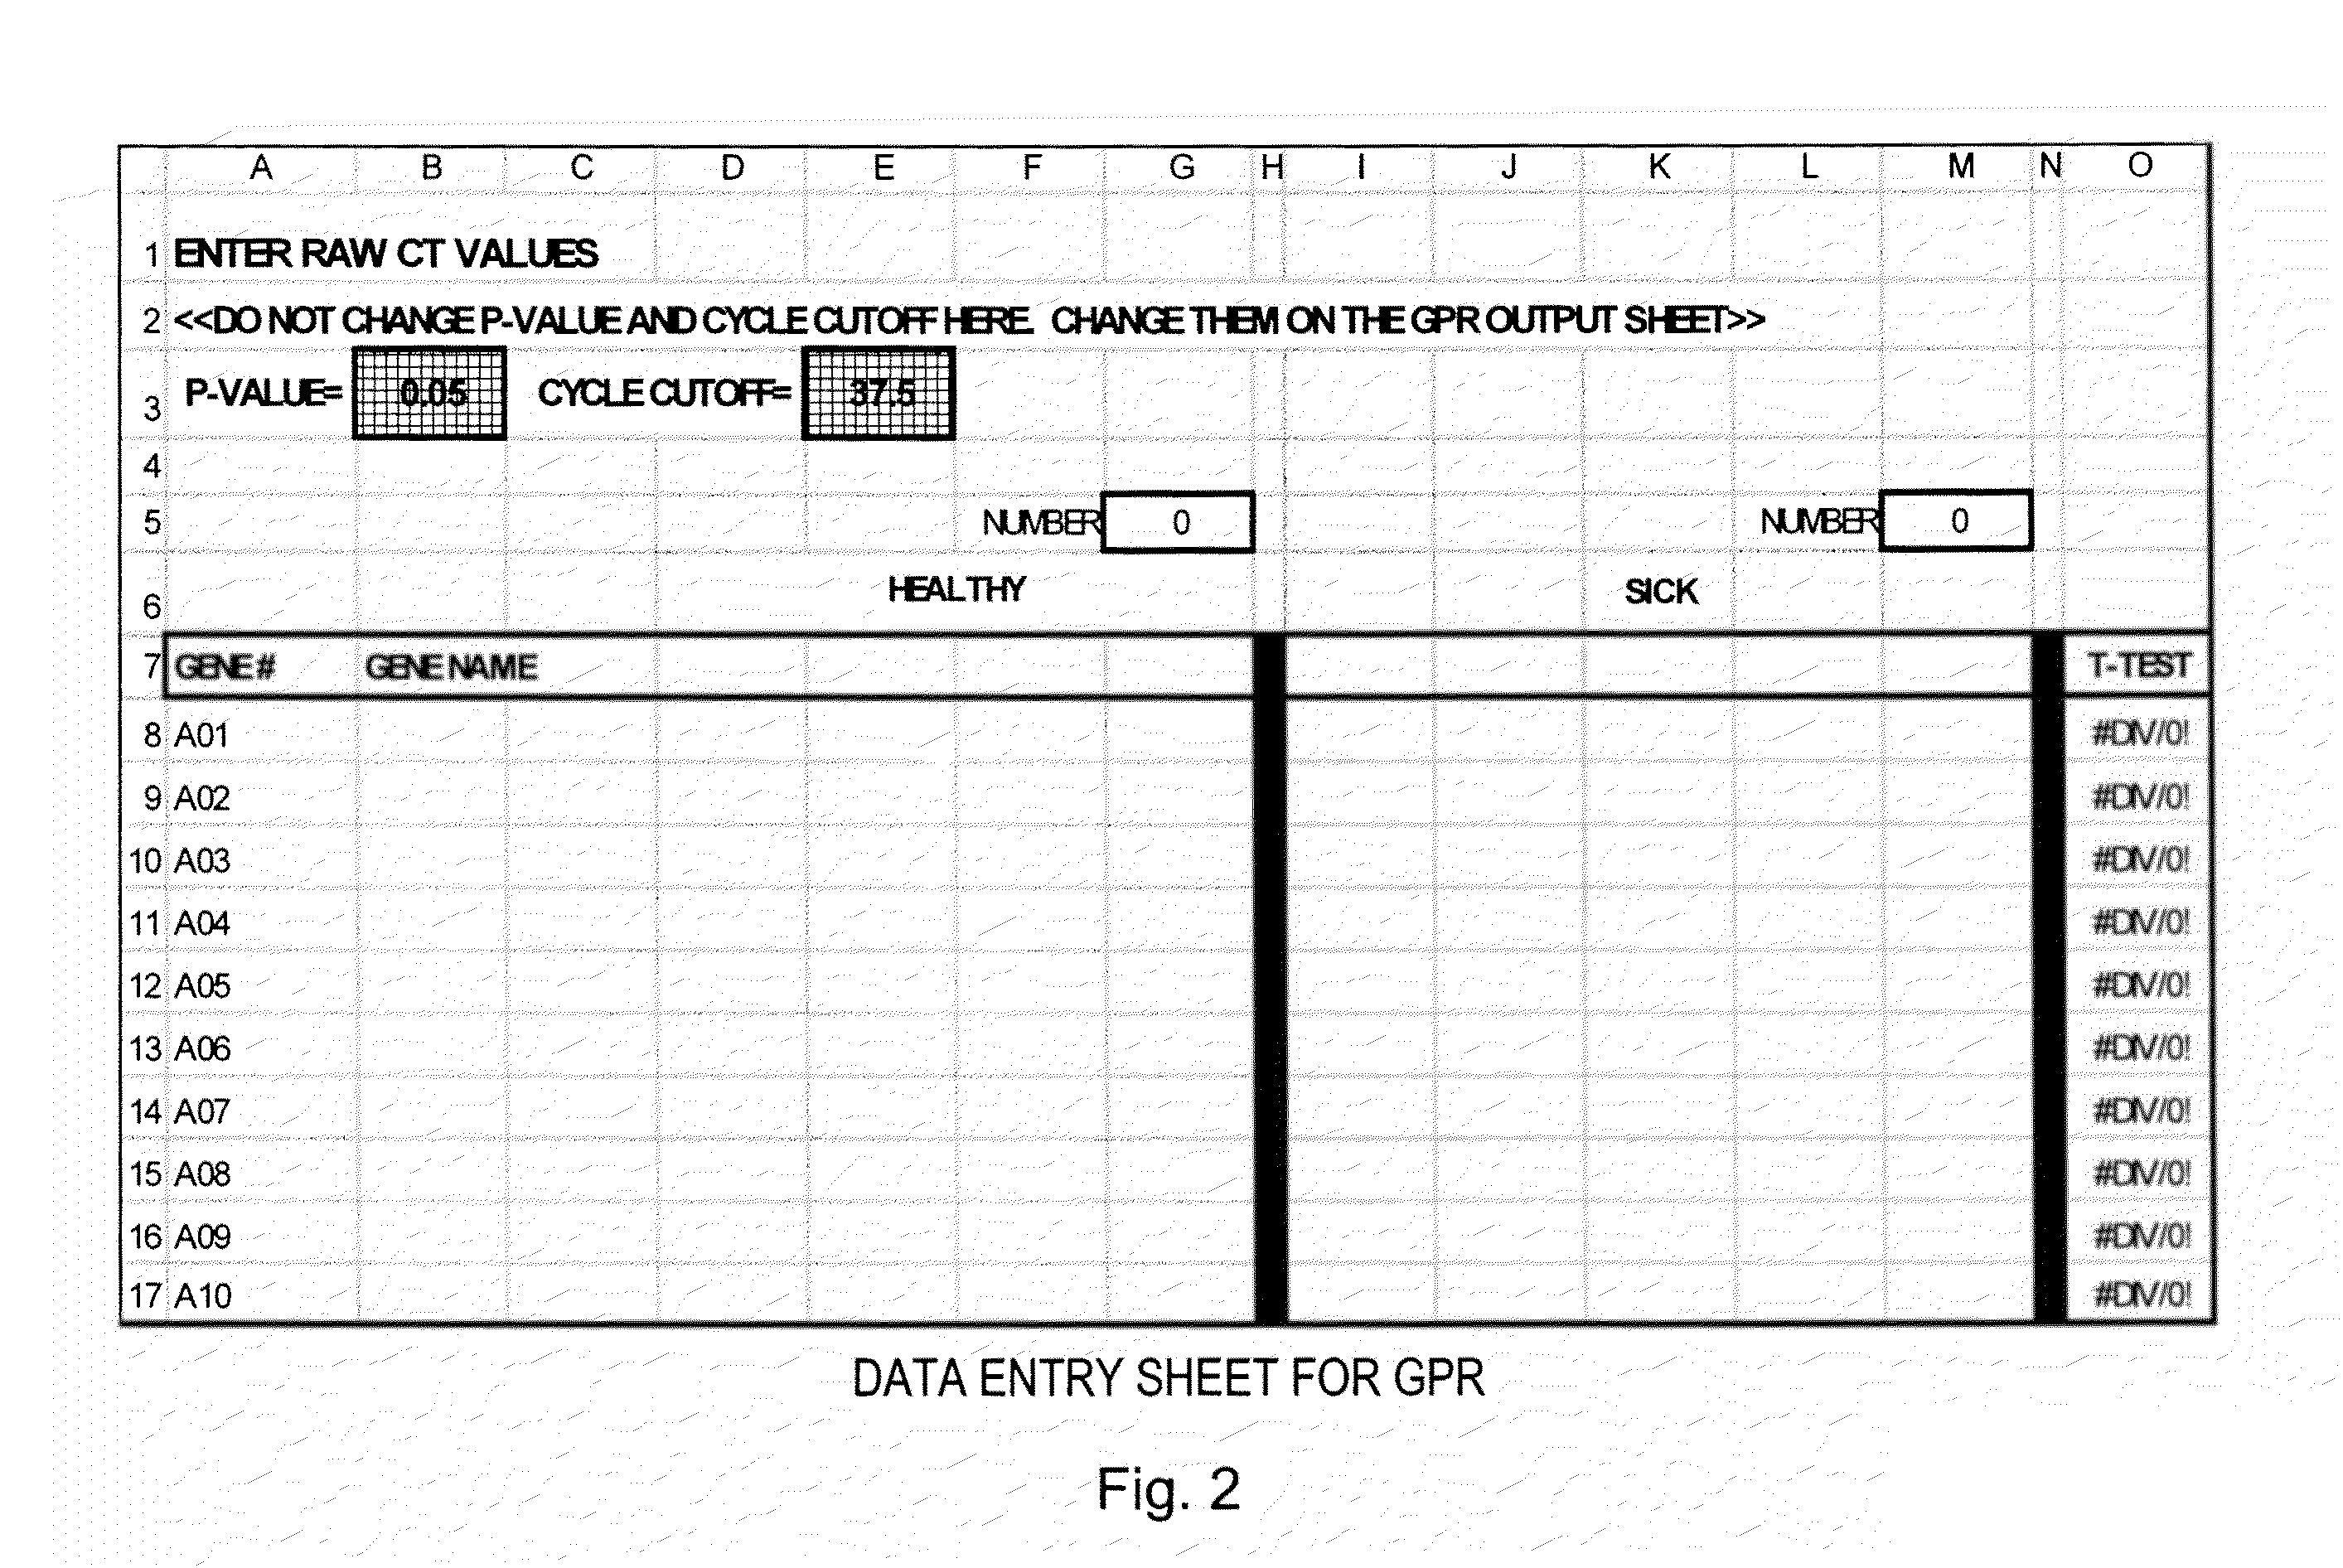
[0012]In one embodiment, the methods are realized as software processes for performing GPR. More specifically, the methods are realized as Microsoft Excel-based software programs that output a ranked list of statistically changed genes using raw input data (cycle threshold—CT values) of up to five 96-well realtime PCR datasets from both a control and experimental group. The method compares the datasets from both groups using Excel's Students T-test after a multiple gene normalization. GPR thus enables a recognition of a change in gene expression pattern. In addition, GPR's output of ranked genes is not skewed by magnitude of expression change. Rather, GPR uses the power of biological replicates and the sensitivity of realtime PCR techniques to extract the most statistically changed genes, even if the expression fold change is small.

Problems solved by technology

Unfortunately, microarrays are not readily amenable to extensive replicate sampling because microarray analysis is labor intensive, technically demanding and requires large quantities of hybridization nucleic acid.
Additionally, data interpretation is limited by the nuances of DNA hybridization kinetics and other systemic sources of error.
QPCR systems provide sensitive and reproducible expression quantification from small amounts of starting material (RNA, mRNA, or cDNA), but have been limited in the number of genes that can be practically analyzed.
However, these and other applications have been limited by conventional analytical methods, which typically include subtraction methods in which “before” and “after” data points are compared and the changed regions are identified.
These methods typically use only a single before and after image, thereby providing no statistical basis to account for image acquisition variability or other forms of image noise.
However, even though there is a lack of absolutely reliable normalization, this relative or comparative normalization is the only viable option currently available to investigators pursuing QPCR analyses.
The alternative, absolute quantification against a titration of standards, is both labor intensive and impractical for scale-up.
Conventional image change analytical methods and other methods are also similarly limited.
Thus, these methods are largely unbiased by the fold change between the control and experimental groups.
Second, this method of expression analysis highlights genes that have large fold changes (up or down).
The gene filter sorts through the expression data and discards that portion of the expression data which seems to lack integrity and therefore may interfere with obtaining proper results.
This may happen when a PCR process fails to take hold for some reason, and does not amplify the material.
After ˜36-42 cycles, stochastic amplification of low copy-number targets can lead to large variability in the data.

Method used


Image

  • Expression data analysis systems and methods
  • Expression data analysis systems and methods
  • Expression data analysis systems and methods

Examples


Embodiment Construction

[0025]To provide an overall understanding of the invention, certain illustrative embodiments will now be described. For purpose of clarity, the invention will be described largely with reference to QPCR methods for analyzing large array of gene expression data. However, it will be understood by one of ordinary skill in the art that the systems and methods described herein can be adapted and modified for other suitable applications and that such other additions and modifications will not depart from the scope hereof. Such applications include, but are not limited to the analysis of microarrays, macroarrays, and protein arrays. For example, the systems and methods described herein have been adapted for performing microarray analysis of 25,000 genes or more. Other applications include the analysis of medical images to assess the level of disease progression and the effects of disease treatment. The techniques may also be used to analyze results from biometric recognition studies (e.g.,...


PUM

PropertyMeasurementUnit
cycle thresholdaaaaaaaaaa
grayscaleaaaaaaaaaa
flexibleaaaaaaaaaa

Abstract

Methods and applications of Global Patter Recognition (GPR), including a system for analyzing the results of real-time polymerase chain reaction (RT-PCR) experiments employing micro-titer and / or microarray plates and robotic plate readers is described. The system employs a set of self-normalizing housekeeping primers or oligonucleotides on the plates / arrays and an algorithmic approach to normalizing expression data from all primers on the plate based on the reaction products of several of the self-normalizing gene primers oligonucleotides. Normalization is accomplished using simplex reactions involving these self-normalizing primers / oligonucleotides; the normalization parameters are then useable across all control and experimental reactions of the plate / array. A ranked list of genes whose amount of change is statistically significant can be determined. The accuracy of this list is enhanced by the data normalization aspect of the system. Other applications of GPR are also disclosed herein.

Description

RELATED APPLICATIONS[0001]This application is a continuation of U.S. application Ser. No. 10 / 835,541, filed Apr. 29, 2004, which claims the benefit of U.S. provisional application 60 / 466,362, filed Apr. 29, 2003. The entire teachings of all above-referenced applications are incorporated herein by reference.REFERENCE TO GOVERNMENT CONTRACTS[0002]This invention was made with Government support awarded by the National Institutes of Health under Contract Nos. RO-1-DK-56597, RO-1-HL-65749and RO-1-A1-28802. The Government has certain rights in this invention.BACKGROUND[0003]Recent technological advances have enabled detailed and expansive studies of dynamic systems. For example, gene expression profiling promises to provide insight into normal biological and pathological disease processes and as such is being intensely pursued by industry and academia alike. The hope is that knowledge obtained from gene expression patterns will predict disease outcome or suggest individualized courses of ...

Claims


Application Information

Patent Timeline
Patent Type & Authority Patents(United States)
IPC IPC(8): G01N33/50G16B25/10G16B25/20G16B40/10
CPCG06F19/20G06F19/24G16B25/00G16B40/00G16B25/20G16B40/10G16B25/10
Inventor AKILESH, SHREERAMROOPENIAN, DERRYSHAFFER, DANIEL J.
Owner JACKSON LAB THE
Learn More