
Wireless sensor network and sampling rate allocation method thereof

a sensor network and wireless sensor technology, applied in the field of wireless sensor network and sampling rate allocation method thereof, can solve the problems of increasing the cost of node batteries, and consuming additional energy, so as to prolong the network life time and reduce the volume of batteries (for example, solar cells)

Active Publication Date: 2011-12-27
IND TECH RES INST
View PDF13 Cites 0 Cited by
  • Summary
  • Abstract
  • Description
  • Claims
  • Application Information

AI Technical Summary

Benefits of technology

[0014]Accordingly, the present invention is directed to a wireless sensor network and a sampling rate allocation method thereof. In the sampling rate allocation method of the wireless sensor network, a distributed computing method is adopted so that the wireless sensor network in tree topology can have prolonged life time and can meet both the quantity and fairness requirements.
[0023]The present invention provides a wireless sensor network and a sampling rate allocation method thereof, wherein a distributed computing method is adopted so that the wireless sensor network in tree topology can prolong the network life time and meet both the quantity and fairness requirements. Thereby, both the cost for replacing node batteries and the volume of the batteries (for example, solar cells) can be reduced.

Problems solved by technology

However, an over-large total sample number won't increase the quality of the sensed samples drastically.
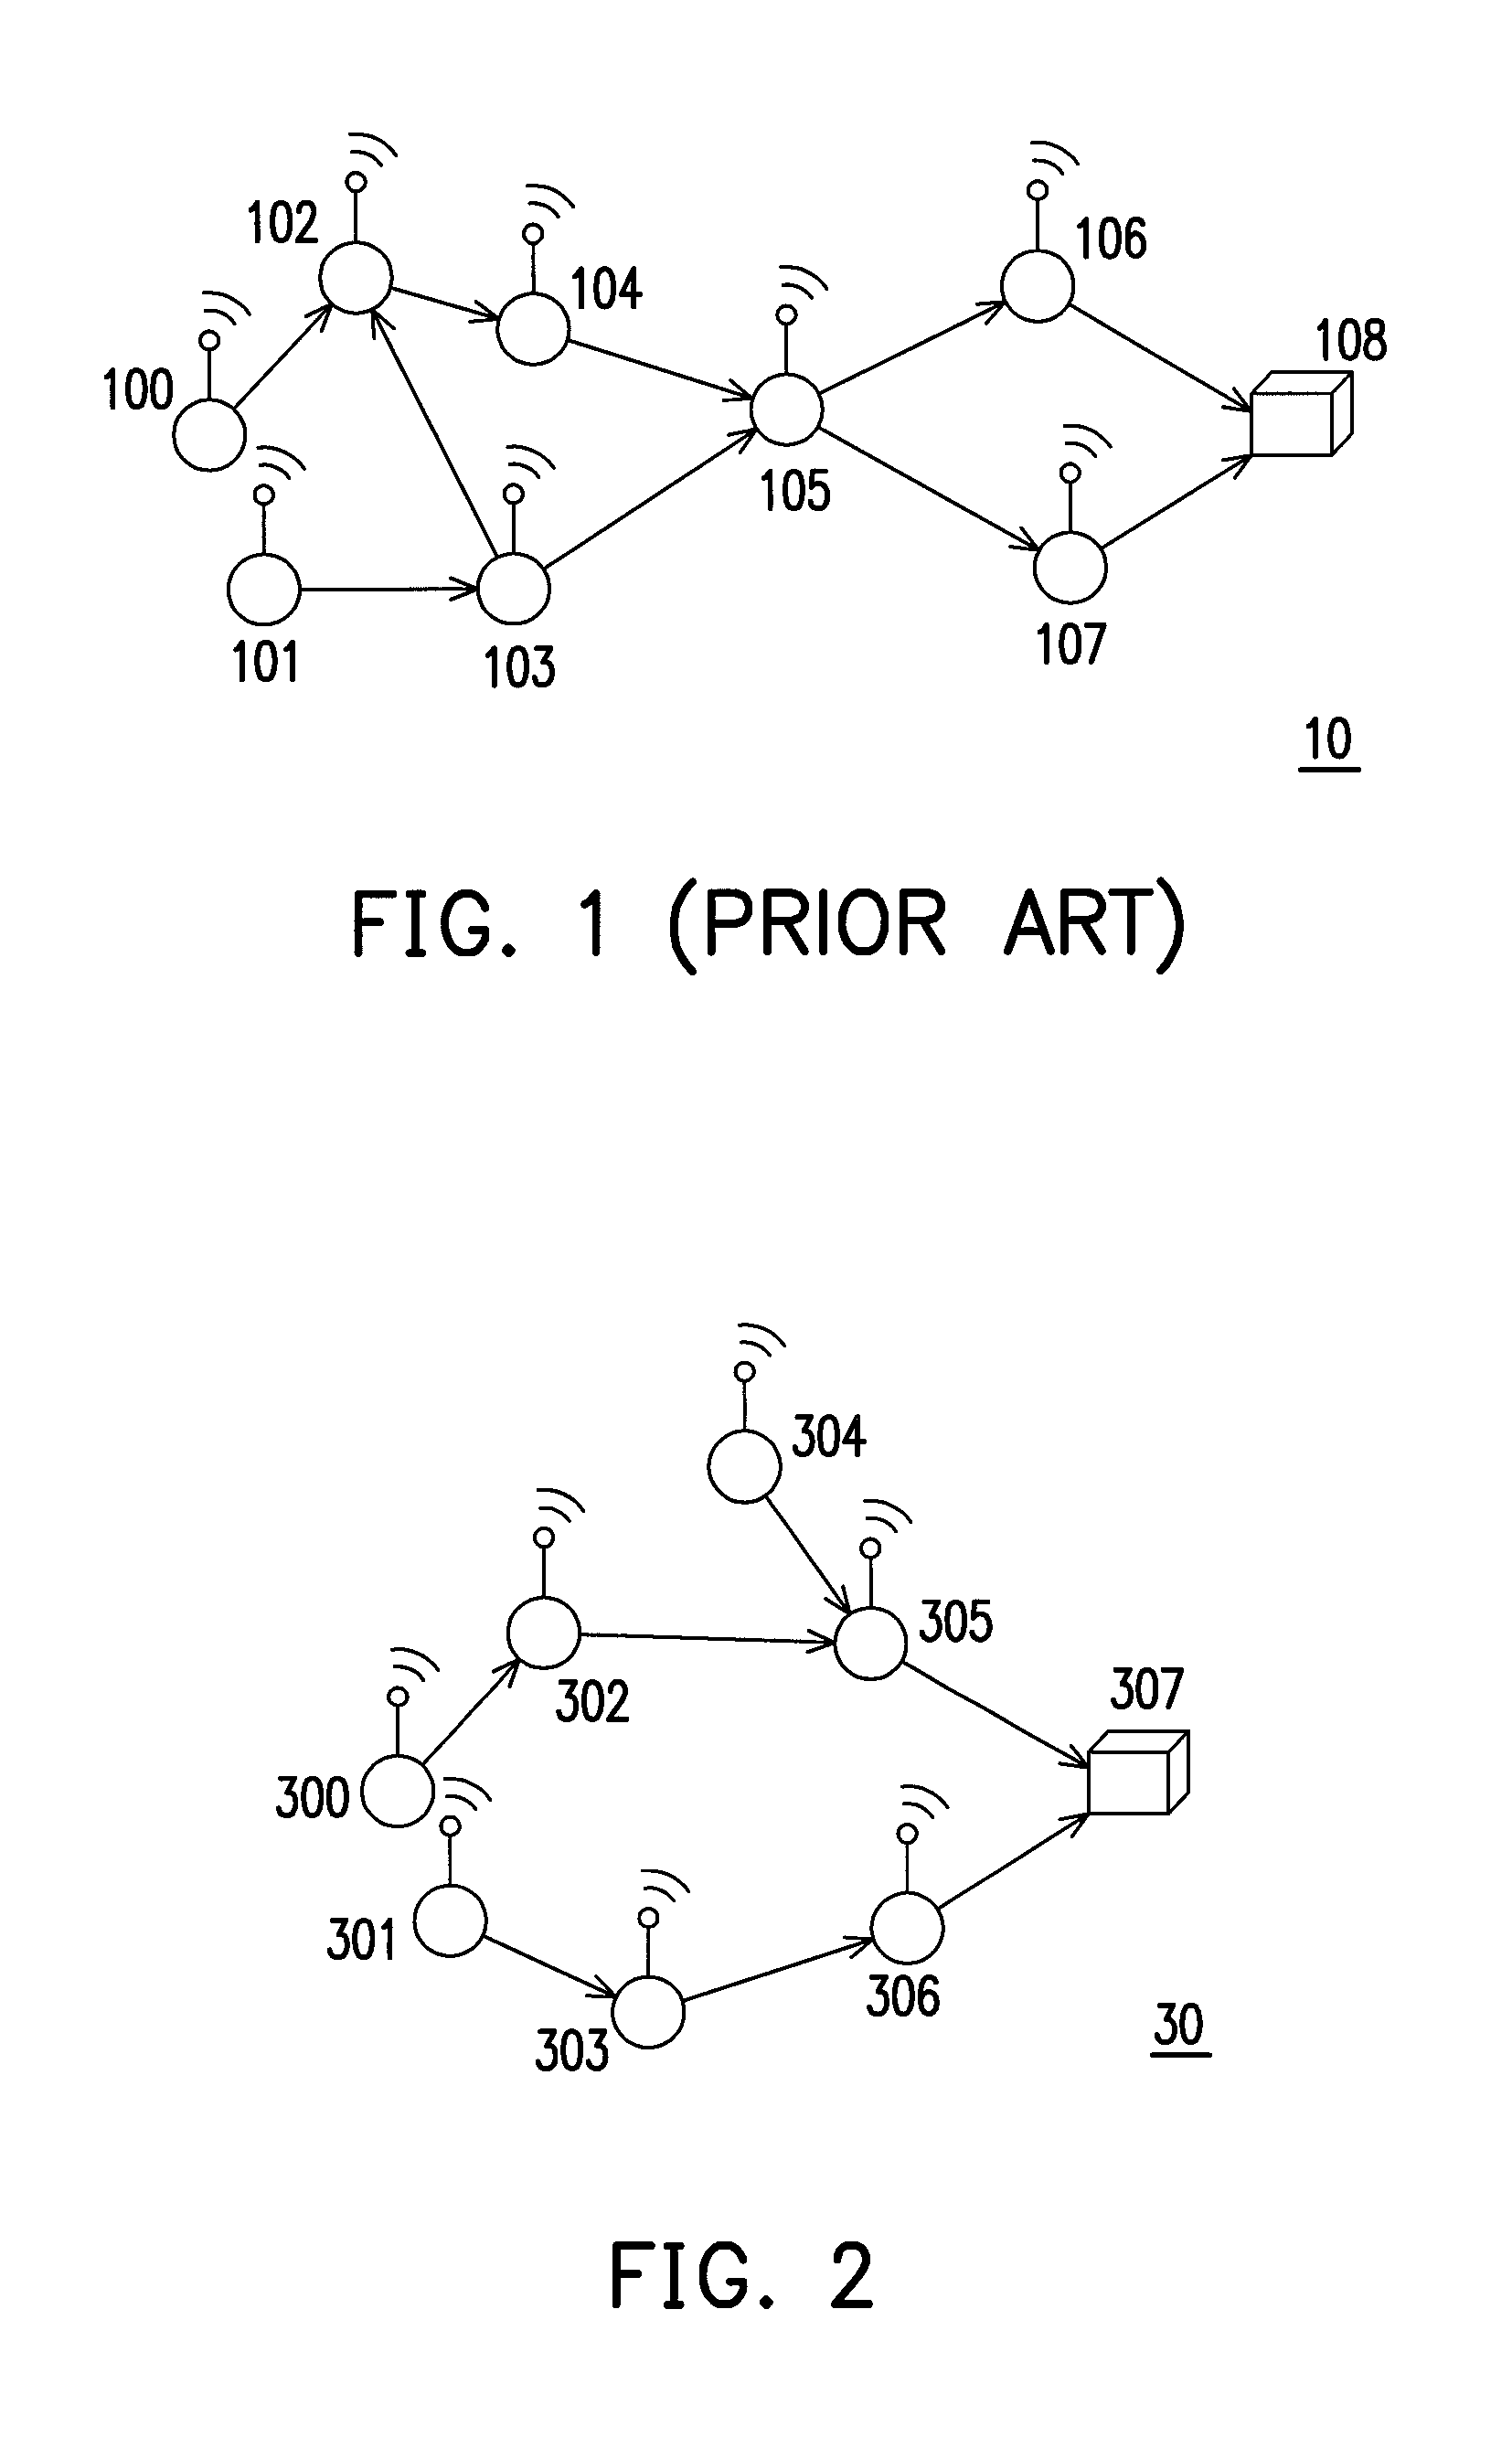
As a result, over sampling cannot increase the quality and reliability of the samples; instead, additional energy is consumed and the life time of the wireless sensor network 10 is even shortened.
However, in these methods, the samples may all come from some particular nodes and induce bias in data analysis.
However, in the worst case, all the samples may come from the same node, and since the samples obtained from the same node cannot represent the characteristic of the entire network, analysis error may be caused.
Through these methods, the problem of lack of fairness in foregoing patents and articles can be resolved; however, a host may not be able to receive enough number of samples, namely, the requirement of total sample number cannot be met.
In short, even though the sampling rate allocation methods disclosed in foregoing patents and articles can prolong the life time of the entire wireless sensor network, they cannot meet the quantity and fairness requirements.
In addition, the collected samples may not be able to reconstruct the monitored phenomenon.

Method used


Image

  • Wireless sensor network and sampling rate allocation method thereof
  • Wireless sensor network and sampling rate allocation method thereof
  • Wireless sensor network and sampling rate allocation method thereof

Examples


example 1

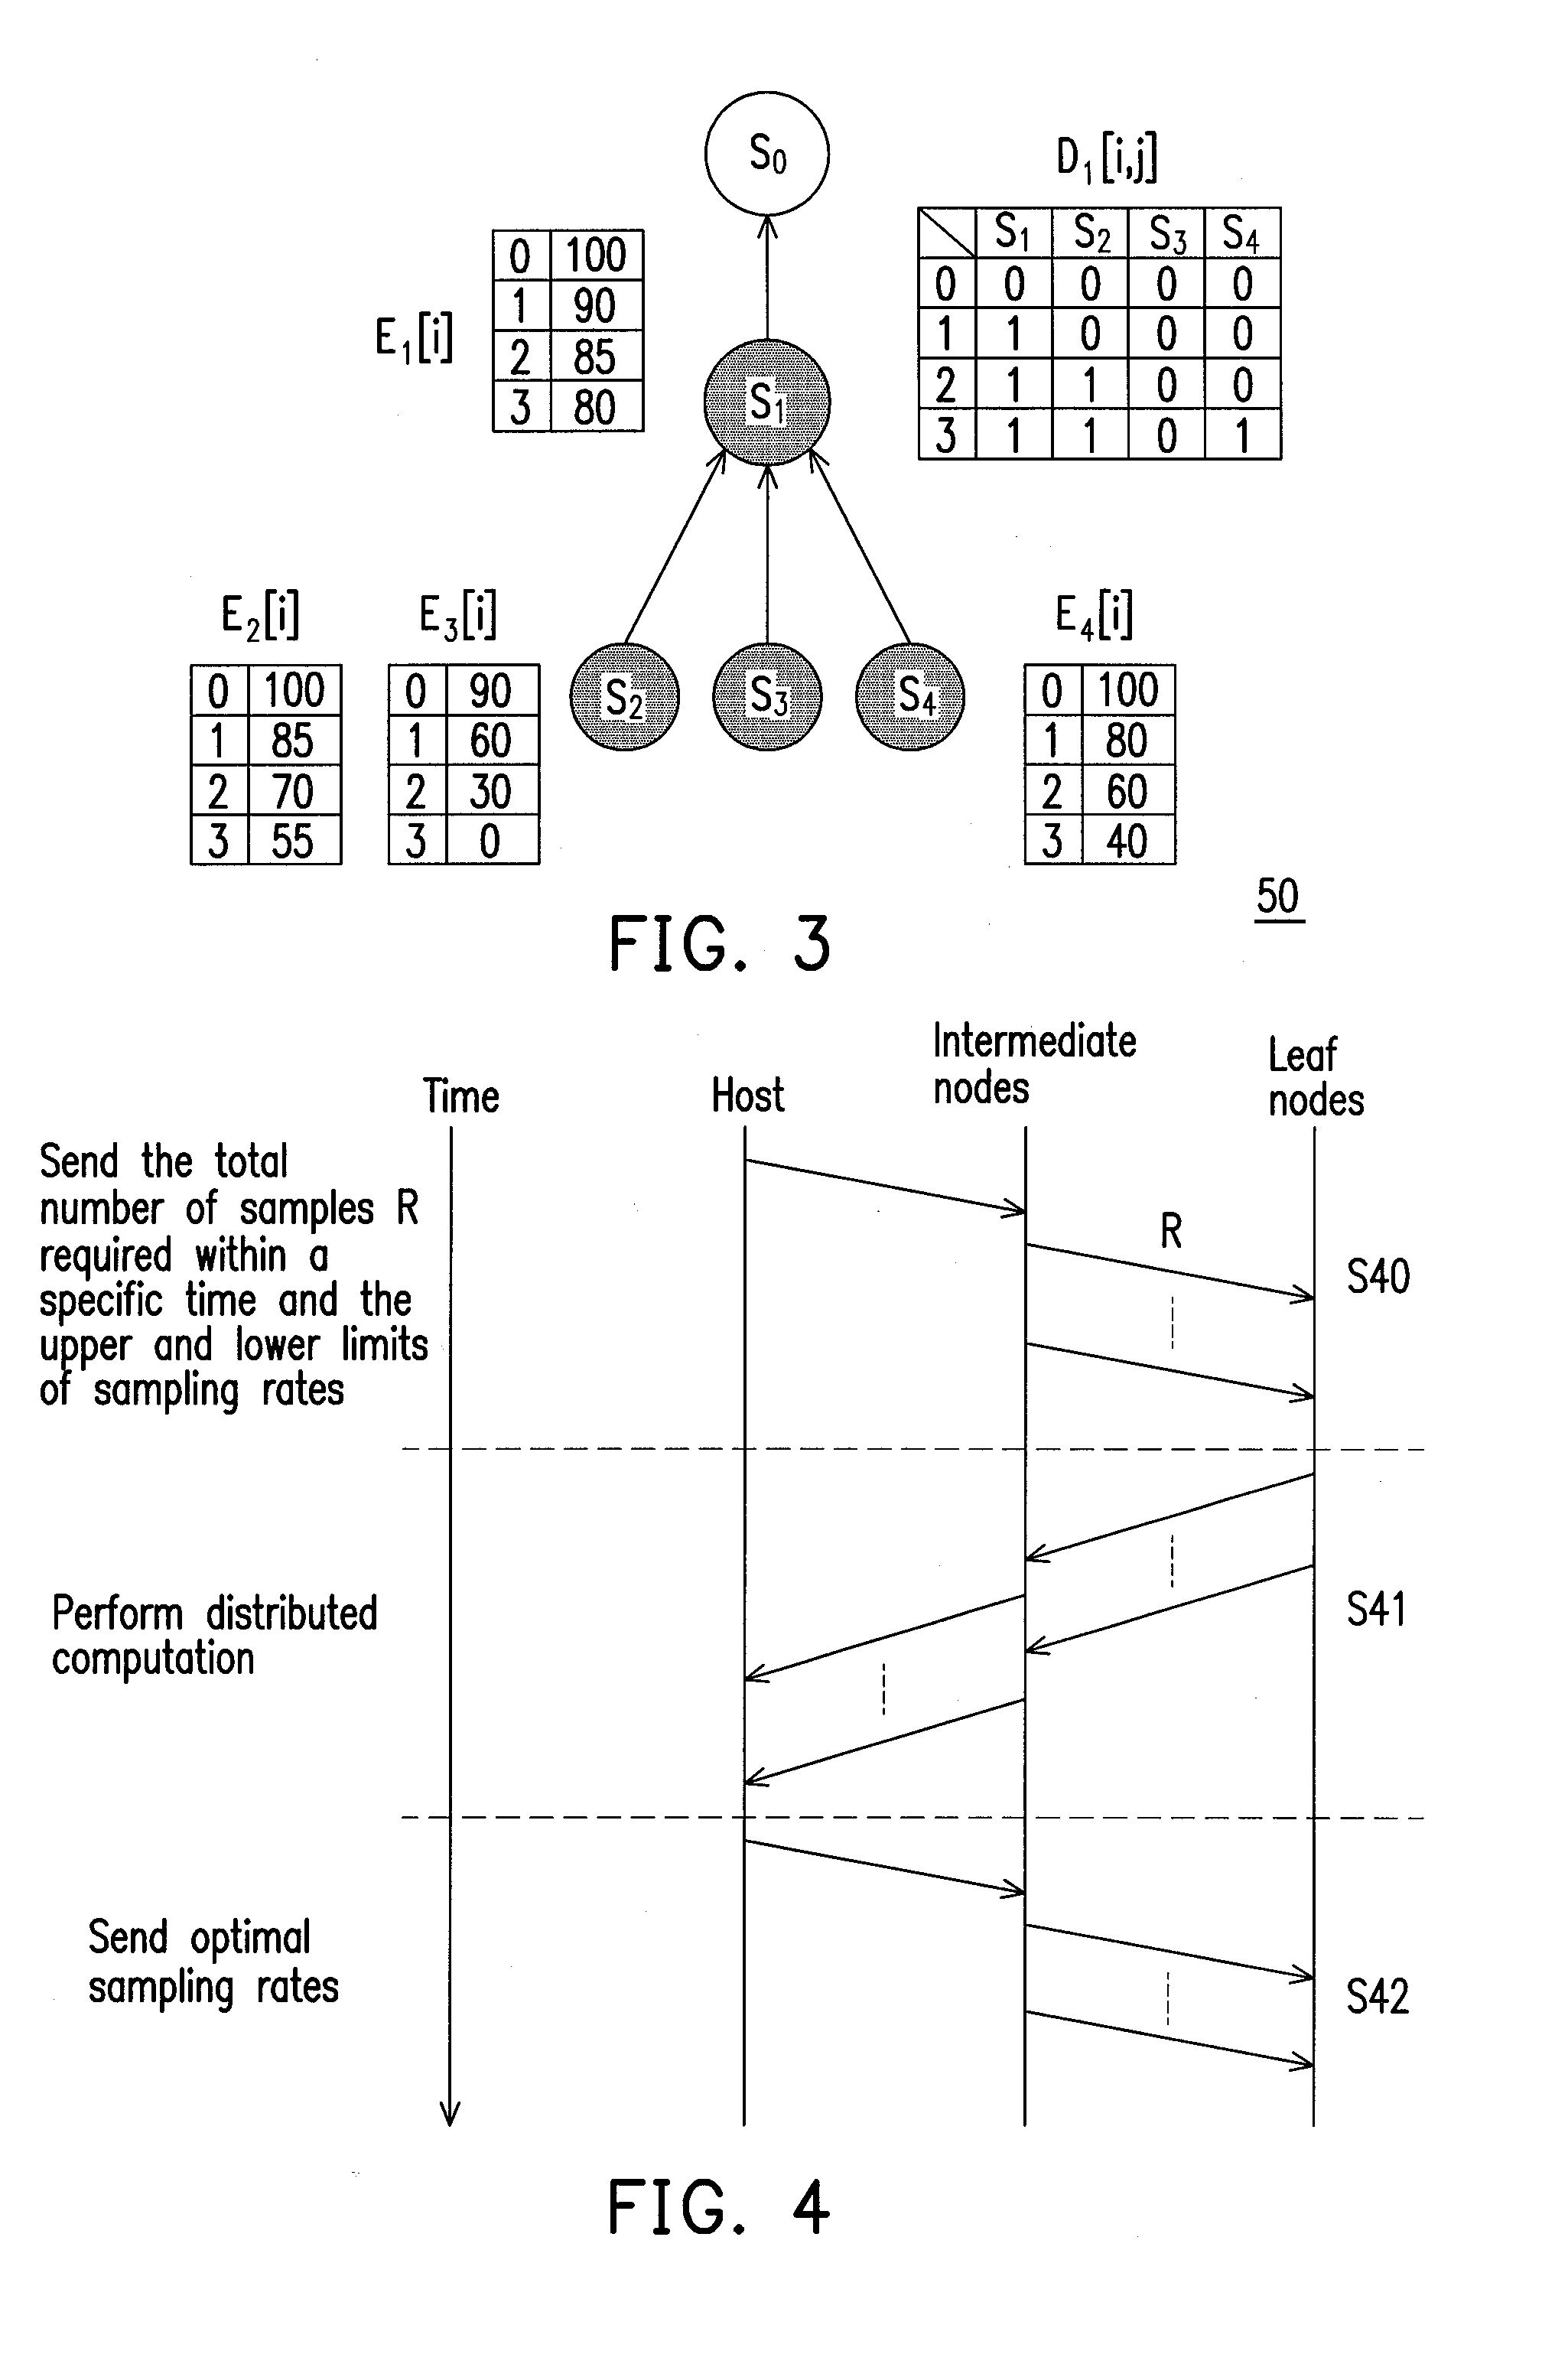
[0049]The foregoing method for allocating a sampling rate by using the energy table and the decision table for a wireless sensor network will be described below with reference to an example. However, this example is not intended for limiting the scope of the present invention.

[0050]FIG. 3 is a schematic diagram of the wireless sensor network 50, wherein the energy table or decision table of nodes S1, S2, S3, and S4 have been calculated. As shown in FIG. 4, the wireless sensor network 50 includes a root node S0, an internal node S1, and leaf nodes S2˜S4. Referring to FIG. 3, E2[1] represents that the remaining energy of the node S2 after it provides a sample is 85, E2[2] represents that the remaining energy of the node S2 after it provides 2 samples is 70, and so on. The decision table D1 represents the optimal sampling rate allocation of the internal node S1 and its child nodes S2˜S4. When the internal node S1 needs to provides 3 samples to its parent node S0, the optimal sampling r...

example 2

[0070]An example showing how to calculate and establish an energy table and a decision table and how to allocate a sampling rate by using the energy table and the decision table through the method described in foregoing embodiment will be described below. However, this example is not intended for limiting the scope of the present invention.

[0071]FIG. 7 is a schematic diagram of a wireless sensor network 80 in tree topology. The nodes S2, S3, S4, S5, S6, and S7 can sense samples automatically, while the nodes S0 and S1 cannot sense samples. The nodes S2, S3, S4, S6, and S7 are leaf nodes, the nodes S1 and S5 are internal nodes, and the node S0 is the root node.

[0072]FIG. 8 is a parameter table of the nodes S0˜S7 in FIG. 7. Referring to both FIG. 7 and FIG. 8, if it is assumed herein that the total number of samples has value R=3 and ρ=∞ (i.e. the lower limit of the sampling rate is 0 and the upper limit thereof is R), according to the method described in foregoing embodiment, the nod...

example 3

[0080]The method for allocating sampling rates by using energy tables and decision tables in a wireless sensor network as described in foregoing embodiment will be described with reference to an example, wherein the sampling rates are allocated with upper limits and lower limits. However, this example is not intended for limiting the present invention.

[0081]FIG. 10 is a schematic diagram of a wireless sensor network 60 in tree topology. The nodes S0, S1, and S2 have already establish their energy tables or decision tables through the method described above, and the sampling rates of the leaf nodes S1 and S2 are allocated with upper limits and lower limits. As shown in FIG. 10, assuming the total number of samples R=300 and the upper and lower limits of the sampling rates of the nodes S1 and S2 are respectively [40,160] and [50,150]. As described above, the energy table of the node S0 records the remaining energy after the node S0 receives (50+40)=90 samples to 300 samples.

[0082]In o...


PUM


Abstract

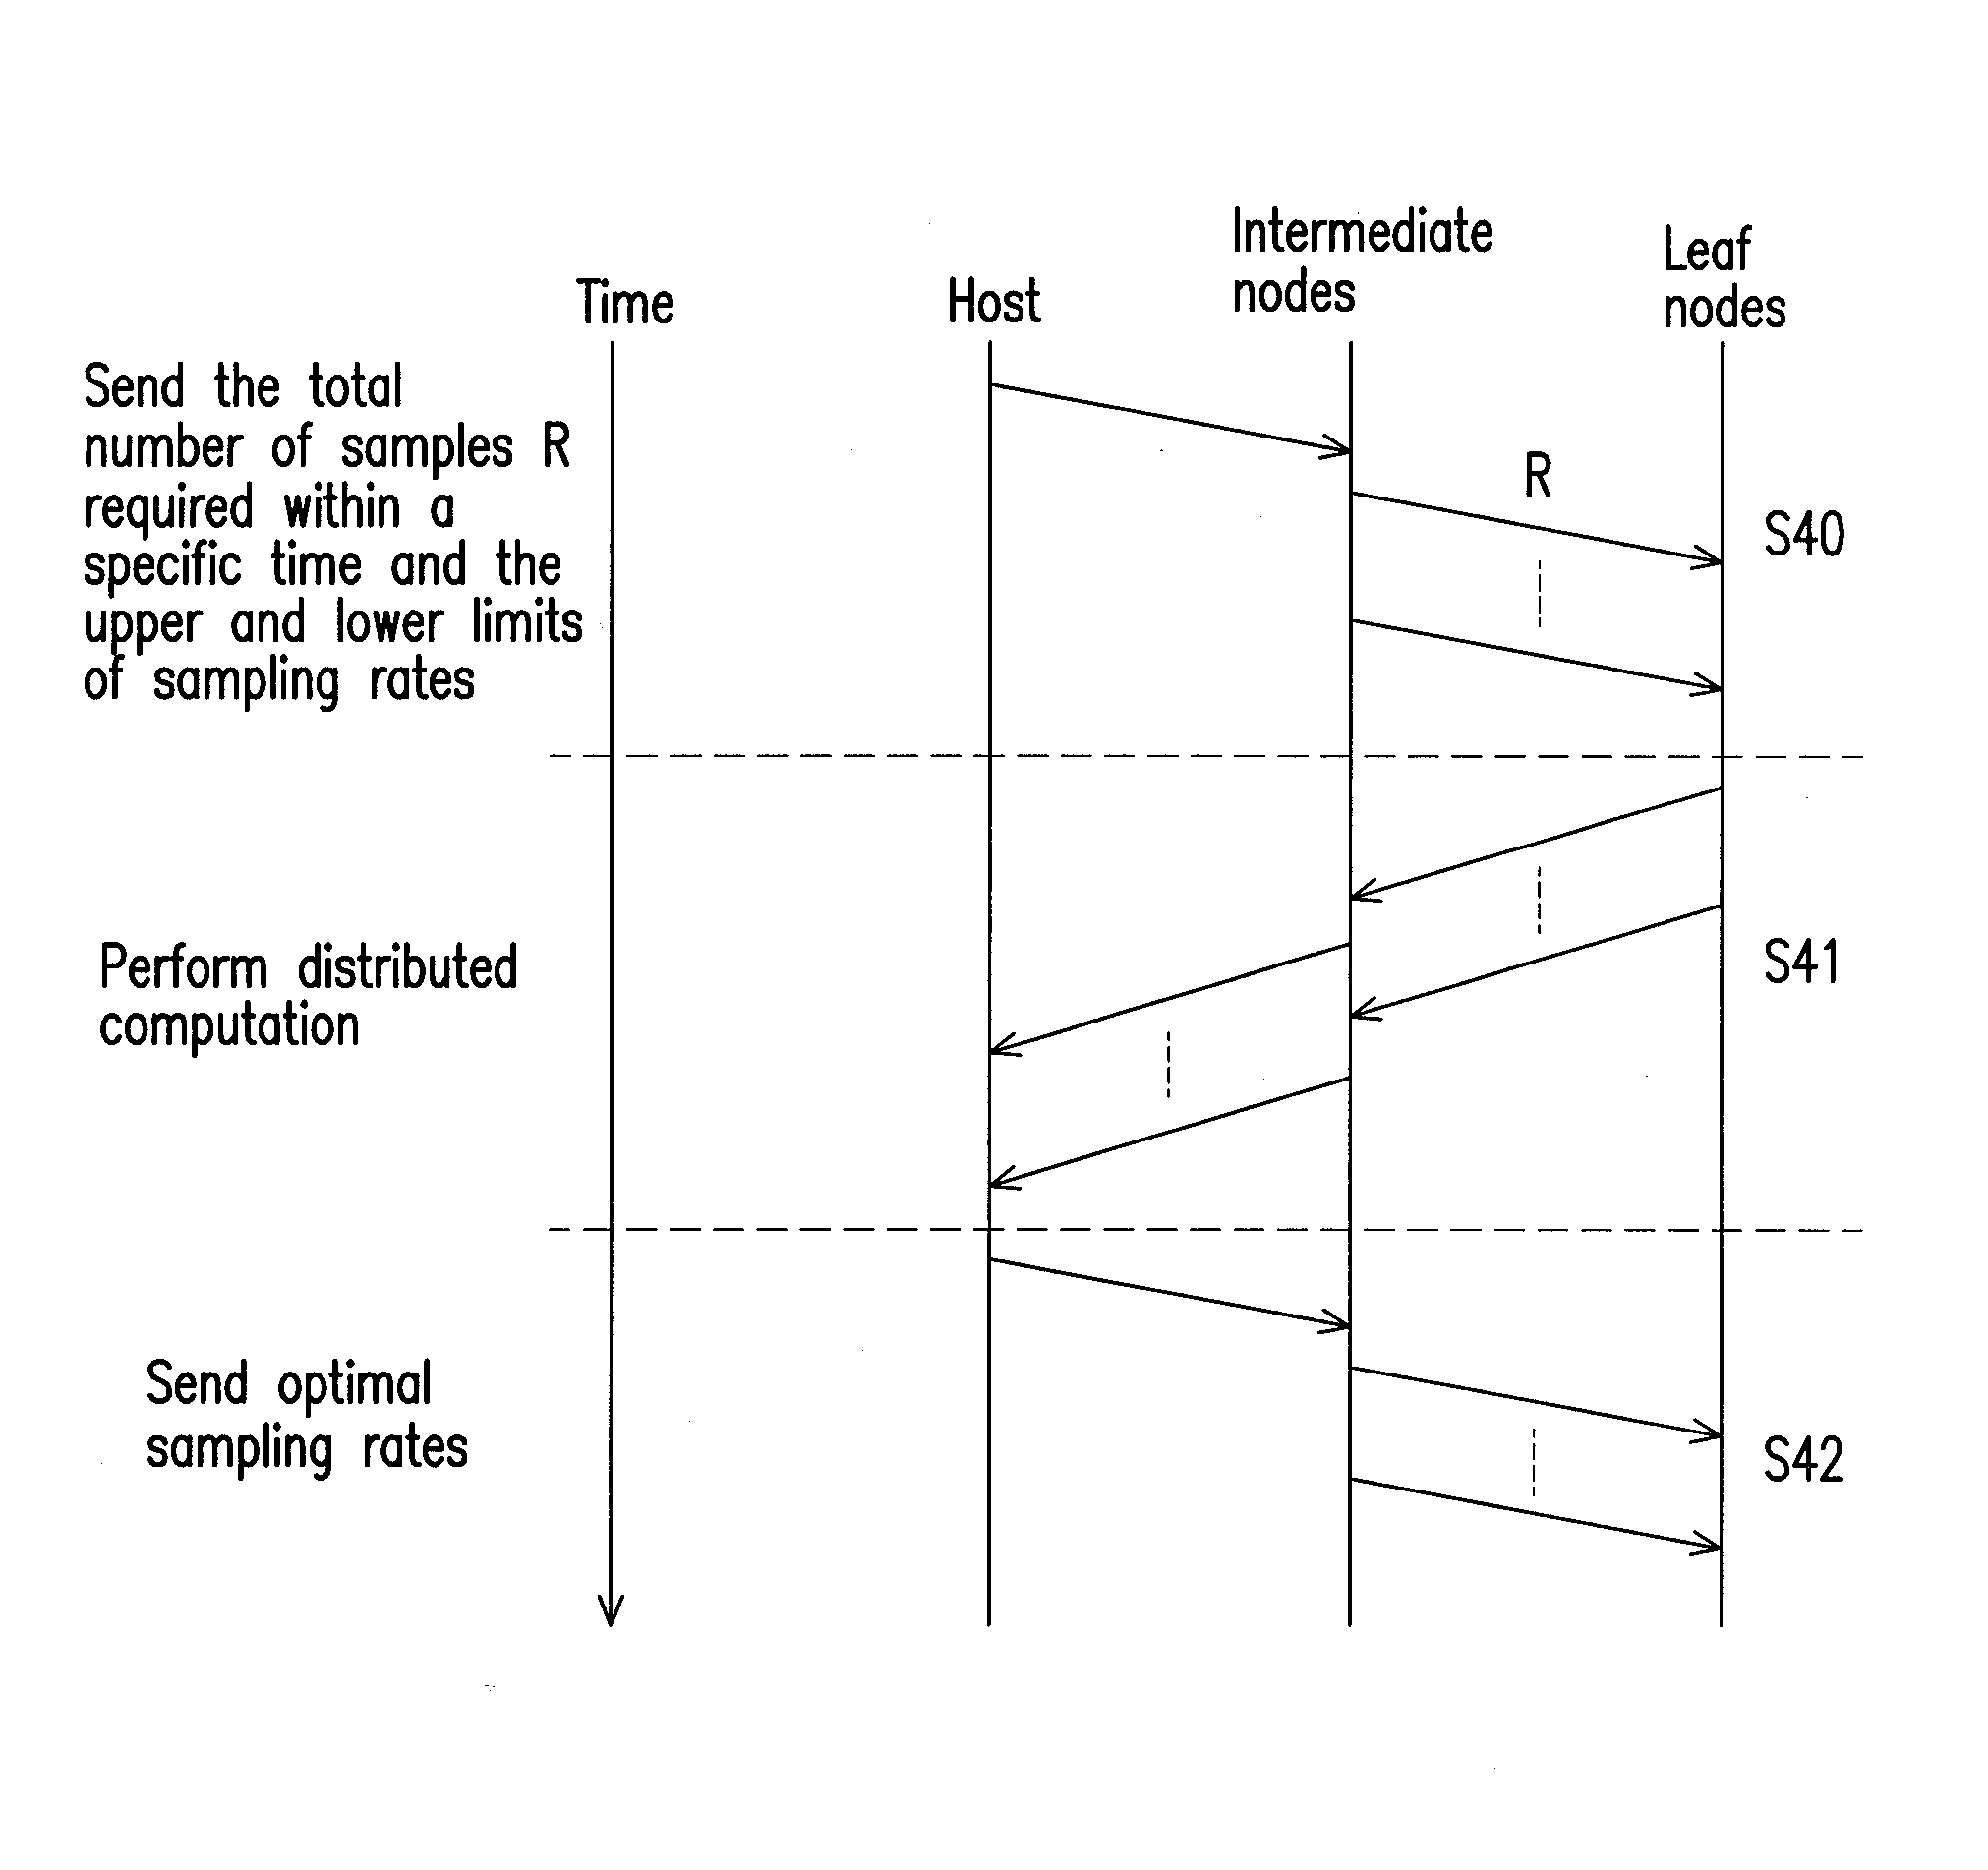
A sampling rate allocation method for a wireless sensor network is provided. In this method, a distributed computing method is adopted to allow each node to calculate and obtain its decision table and energy table and upload its energy table to its parent node, and finally, the number of samples to be provided by all the child nodes is determined according to the decision table of the root node and a total sample number. Compared to the conventional techniques, the present invention provides a wireless sensor network which has longer life time and can meet the requirements to both the total number of samples and the fairness.

Description

CROSS-REFERENCE TO RELATED APPLICATION[0001]This application claims the priority benefit of Taiwan application serial no. 97112699, filed on Apr. 8, 2008. The entirety of the above-mentioned patent application is hereby incorporated by reference herein and made a part of specification.BACKGROUND OF THE INVENTION[0002]1. Field of the Invention[0003]The present invention generally relates to a wireless sensor network and a sampling rate allocation method thereof, in particular, to a wireless sensor network which has long life time and meets the requirements to both total sample number and fairness, and to a sampling rate allocation method thereof.[0004]2. Description of Related Art[0005]A wireless sensor network is composed of a plurality of wireless sensors, and which can be used for environment monitoring by periodically sensing various samples (for example, temperature, humidity, sound, radio frequency, and atmospheric pressure) via these wireless sensors. The number of samples sen...

Claims


Application Information

Patent Timeline
Patent Type & Authority Patents(United States)
IPC IPC(8): G08B9/00H04M1/00H04B7/185H04W4/00G08C15/00H04L12/43H04L12/42
CPCH04W52/0251H04W24/00Y02D30/70
Inventor CHU, TSUNG-HSIENYU, HUANG-YICHIANG, PO-NUNGHUANG, TAI-YISHEN, CHUNG-CHOU
Owner IND TECH RES INST
Learn More