
Printer characterization, monitoring and diagnosis using dynamic test patterns generated by sensing and analyzing customer documents

a printing machine and dynamic test technology, applied in the field of system, can solve problems such as the difficulty of the insufficient information required for diagnosing image quality problems, and the difficulty of identifying optimal test patterns, and achieve the effect of automatic image quality based diagnosis

Active Publication Date: 2012-04-03
XEROX CORP
View PDF31 Cites 21 Cited by
  • Summary
  • Abstract
  • Description
  • Claims
  • Application Information

AI Technical Summary

Benefits of technology

The patent describes a method and system for automatically diagnosing the quality of printed documents in a printing system. The system uses customer documents and test patterns to identify defects in the printed image. The system then automatically generates new test patterns based on the identified defects and prints and analyzes them to further diagnose the quality of the printing system. The system can also pool image quality data from multiple printing systems to get a more comprehensive analysis. The technical effect of this patent is to improve the accuracy and efficiency of document printing systems by automatically identifying and addressing defects in the printed image.

Problems solved by technology

Diagnosis of image quality (IQ) problems is a difficult task.
However, this information is usually not sufficient for diagnosing image quality problems.
When visually examining the customer prints, there are some difficulties associated with identifying optimal test-patterns because a human observer tends to view image content on a qualitative basis rather than a quantitative basis.
Thus the customer inputs may not be very accurate in specifying an optimal test-pattern for further analyses.
The customer or service personnel, however, may not be able to identify the frequency or frequencies of the banding and / or the fractions of colorants that make the light orange background, where the banding issue was observed.
When a field service engineer arrives at a customer site to service an image quality related problem, he / she typically has no a priori insight into the reason for the problem.
The machine data available from the machine provides very little image quality related information.
Moreover, the actual process of image quality diagnostics by a field engineer is a time consuming and a wasteful process.
This can be time consuming, costly and not very environmentally conscious or “green” (e.g., waste of paper, scanning, analyses).
Although these methods have shown some successes, there are fundamental limitations and technology difficulties that limit their current performance.
One limitation, for example, is that the customer may not print a certain colorant combination at certain spatial locations which may be critical for diagnosis and / or characterization.
With interpolation, it is difficult to detect certain defects accurately such as those with high spatial frequency.

Method used


Image

  • Printer characterization, monitoring and diagnosis using dynamic test patterns generated by sensing and analyzing customer documents
  • Printer characterization, monitoring and diagnosis using dynamic test patterns generated by sensing and analyzing customer documents
  • Printer characterization, monitoring and diagnosis using dynamic test patterns generated by sensing and analyzing customer documents

Examples


example

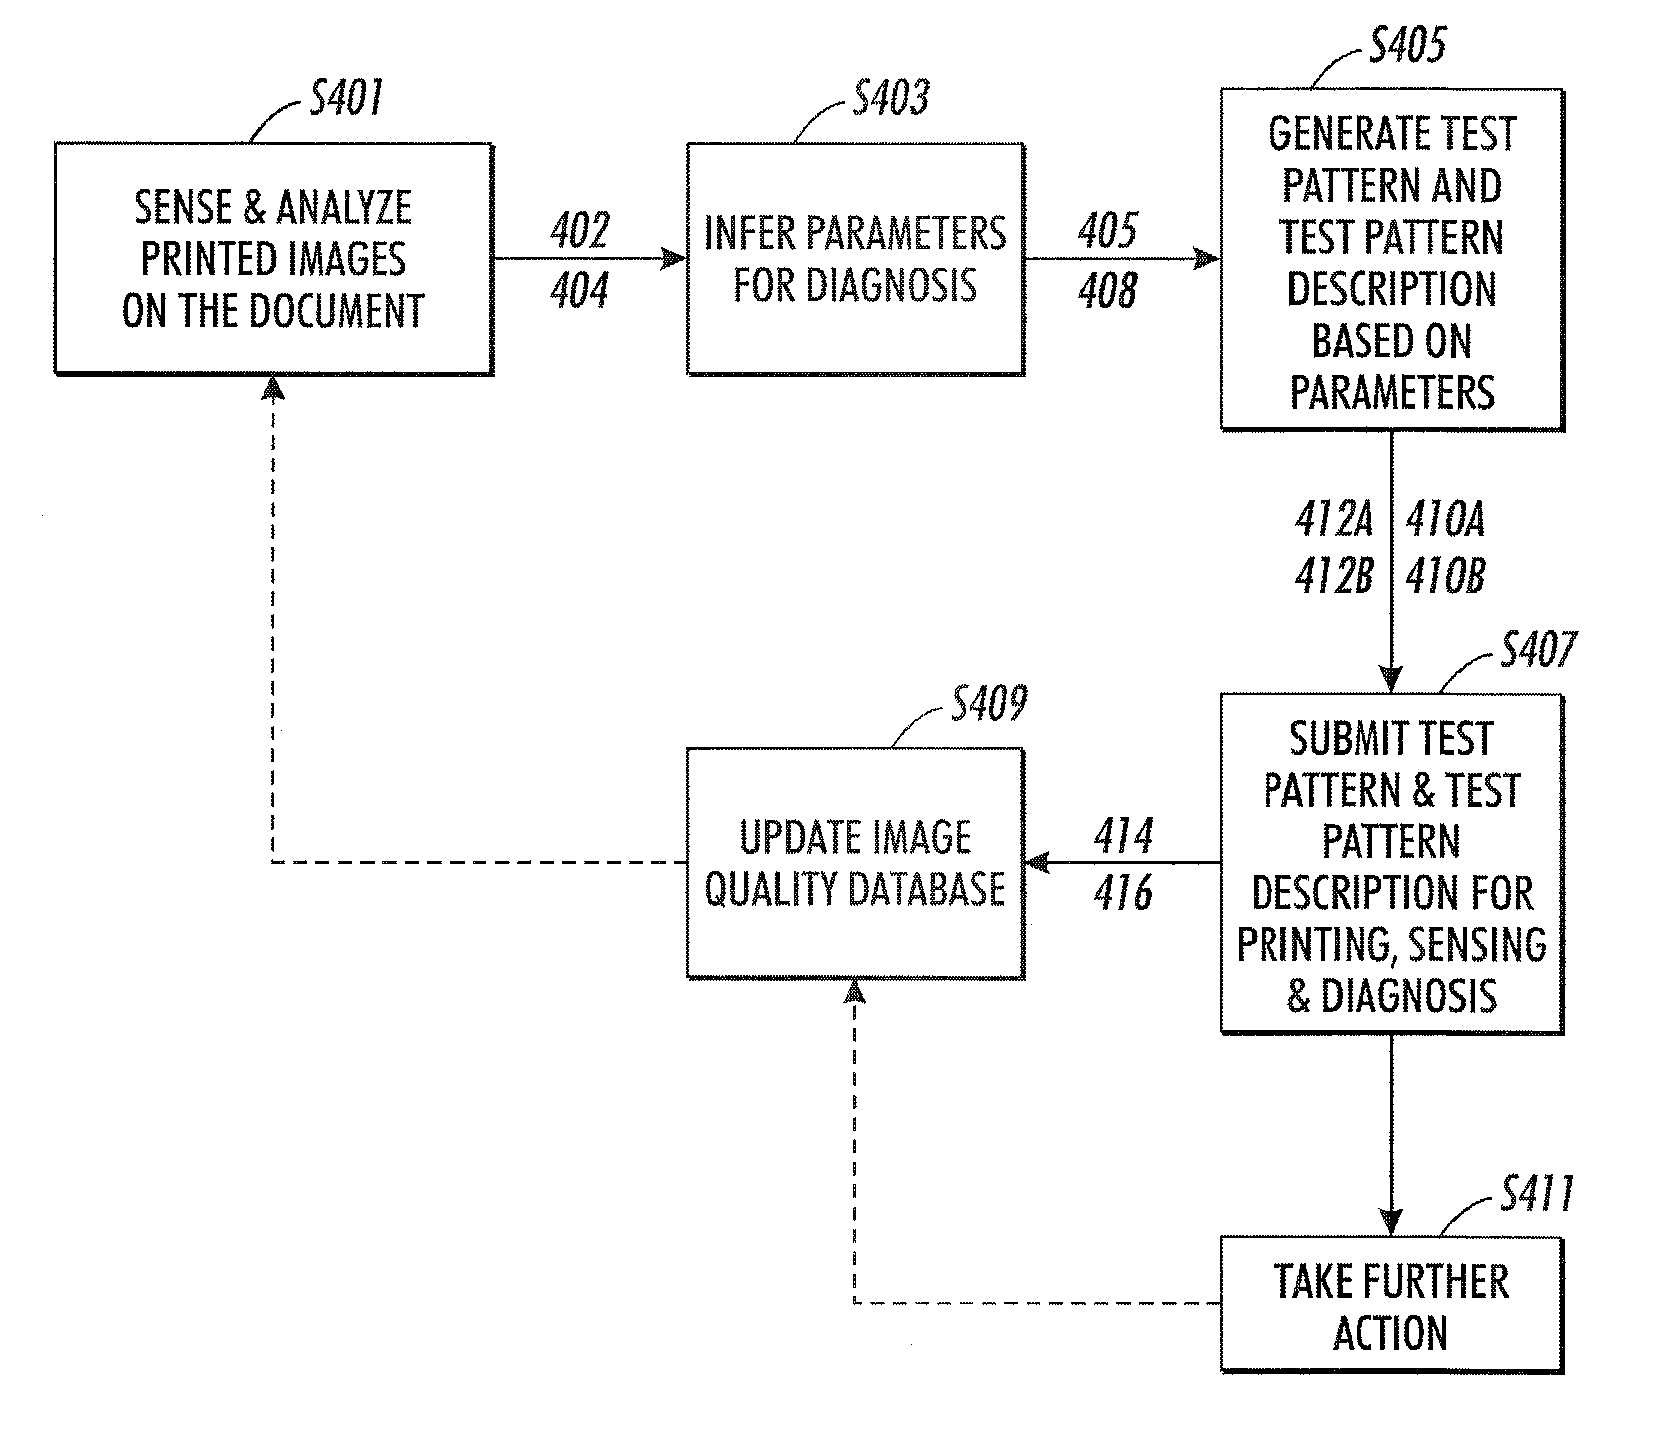
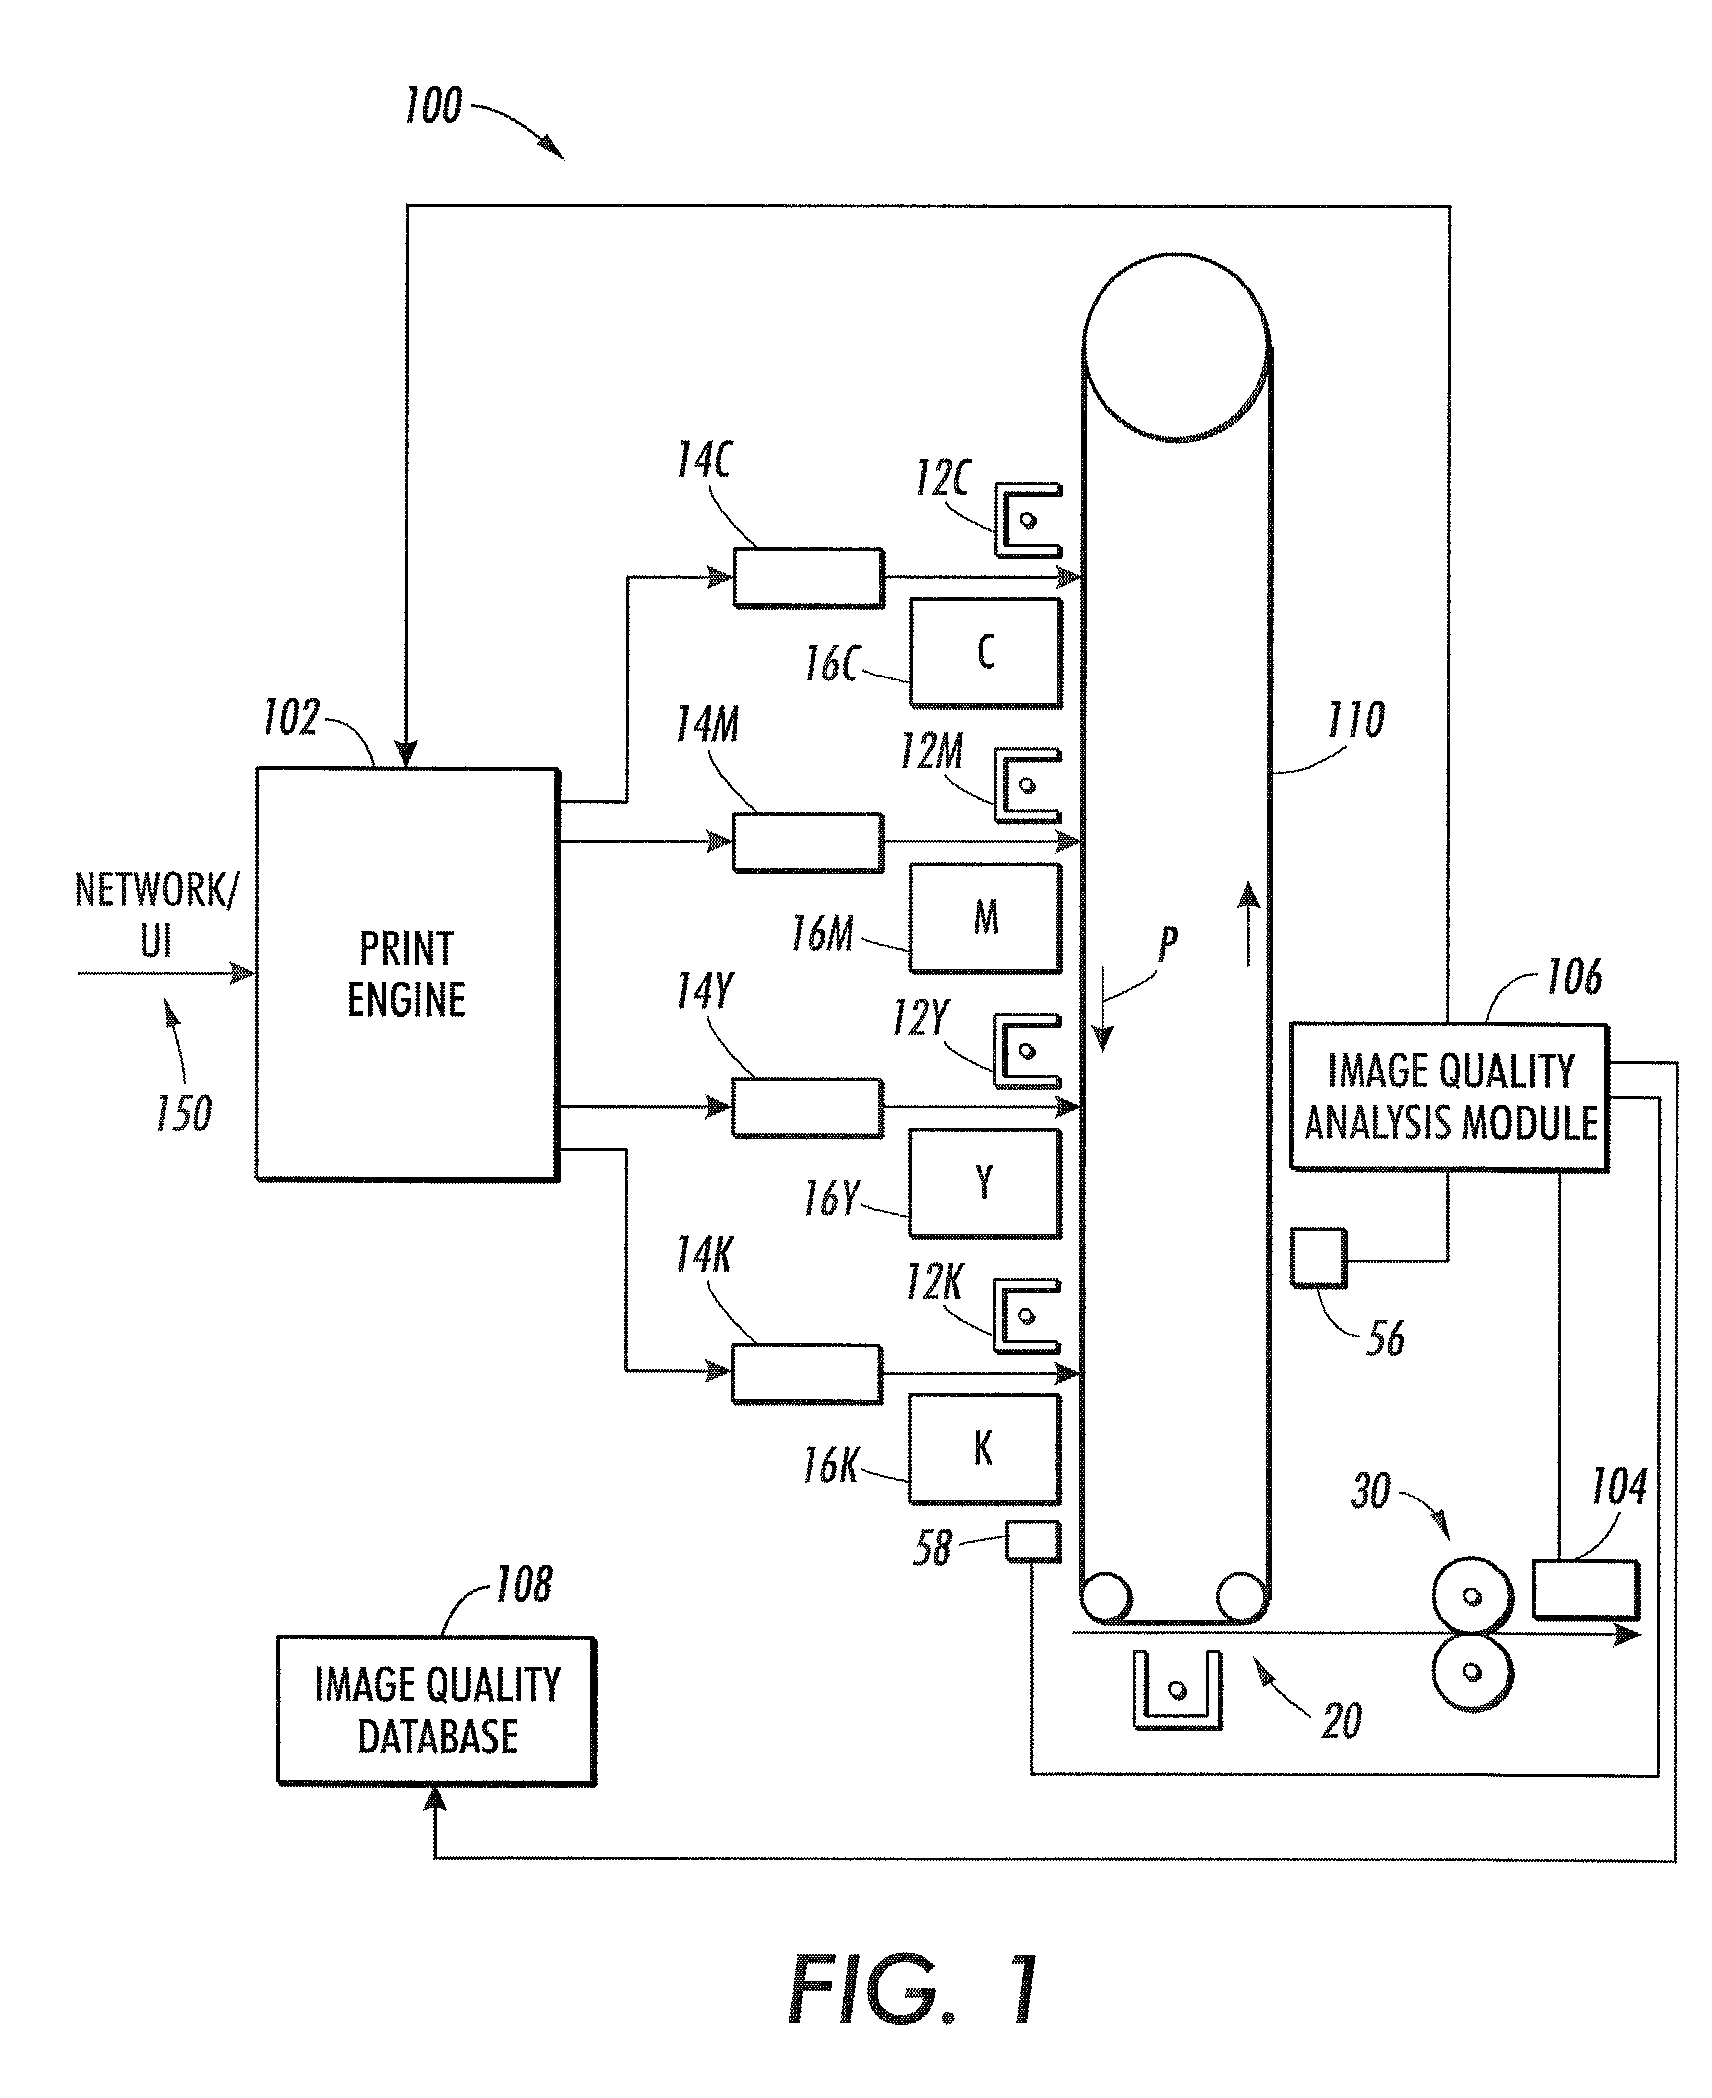
[0049]FIG. 4 illustrates an exemplary scenario of the method for automated image quality based diagnosis of a document printing system in accordance with an embodiment of the disclosure. For example, in one embodiment, the customer images or customer documents are scanned and analyzed to identify defects. These identified defects (e.g., dominant color errors observed in certain color combination and / or certain locations, banding frequency observed in certain colorant combination) detected from the customer images or customer documents are used to determine the optimal test patterns as will be discussed in detail below. In step S401, the printed image on the document is scanned and analyzed to identify defects 402 and / or 404 in the printed image. For example, two such identified defects 402 and 404 in the printed image may include a 2% error in 50% cyan; and 1 c / mm banding problem at 40% red (e.g., a combination of 40% magenta and 40% yellow) respectively. The unit for spatial freque...


PUM


Abstract

A method for automated image quality based diagnosis of a document printing system is disclosed. The method comprises receiving image data to be printed on a document; printing an image on the document based on the image data; scanning the printed image on the document with a sensor; analyzing the scanned printed image with an image quality analysis module to identify one or more defects in the printed image; automatically generating test pattern image data based on the one or more identified defects; and printing and analyzing a test pattern image based on the test pattern image data.

Description

BACKGROUND[0001]1. Field[0002]The present disclosure relates to a system and a method for automated image quality based diagnosis of a document printing system. In particular, the present disclosure provides a hybrid approach that uses customer documents where possible and augments the customer documents with test patterns when necessary.[0003]2. Description of Related Art[0004]Diagnosis of image quality (IQ) problems is a difficult task. A number of document printing systems are able to send machine state and usage information back to the manufacturer or a service center. This information can be analyzed for diagnostic and prognostic purposes by field service personnel as well as product engineers. However, this information is usually not sufficient for diagnosing image quality problems.[0005]Customer prints and / or special test patterns have been used to analyze image quality problems manually. For example, a customer or a service personnel may visually analyze the customer print a...

Claims


Application Information

Patent Timeline
Patent Type & Authority Patents(United States)
IPC IPC(8): G06K9/00H04N1/46
CPCB41J29/393G03G15/0848G03G15/5062G06K9/036G06K15/02G06K15/027G03G2215/00569H04N1/6047H04N1/6033G06V10/993
Inventor WU, WENCHENGMINHAS, RAJINDERJEETSAMPATH, MEERA
Owner XEROX CORP
Learn More