Utility monitoring device, system and method

a monitoring device and a technology for utilities, applied in the field of utilities monitoring devices, systems and methods, can solve the problems of not receiving consumption and cost information, not being compatible with known smart metering systems, existing products have limitations, etc., and achieve the effect of being readily interpreted

Active Publication Date: 2012-12-04
AZTECH ASSOC INC
View PDF11 Cites 65 Cited by
  • Summary
  • Abstract
  • Description
  • Claims
  • Application Information

AI Technical Summary

Benefits of technology

[0049]Each different rate tier may be associated with a different colour, and the respective colour selected dependent on a rate of consumption. Green, yellow, orange and red illumination may, for example, be used to indicate respectively off-peak, mid-peak, on-peak and critical peak, providing the consumer with instant awareness of energy consumption levels and rate in a manner which is readily interpreted.

Problems solved by technology

Nevertheless, even with smart metering, the consumer may not receive information on consumption and cost from the utility provider until a billing is received.
Although a number of in-home (in-building, on-premises) displays are available, existing products have some limitations, and may not be compatible with known smart metering systems.
Furthermore, where units plug into an electrical wall outlet, there are limitations on placement and the device may not be conveniently located for reading of a digital display.
Some smart meters may not provide information on rate period, and even when information is available, consumers may not be able to immediately interpret numeric data without analysis because there are several types of billing: e.g. single flat rate mode; tiered rate mode; time-of-use rate modes.
When smart meters are not installed, such approaches often require an electrician to install specialized equipment connected to a conventional meter, and the equipment generally requires a separate power supply or power source.

Method used


Image

  • Utility monitoring device, system and method
  • Utility monitoring device, system and method
  • Utility monitoring device, system and method

Examples


first embodiment

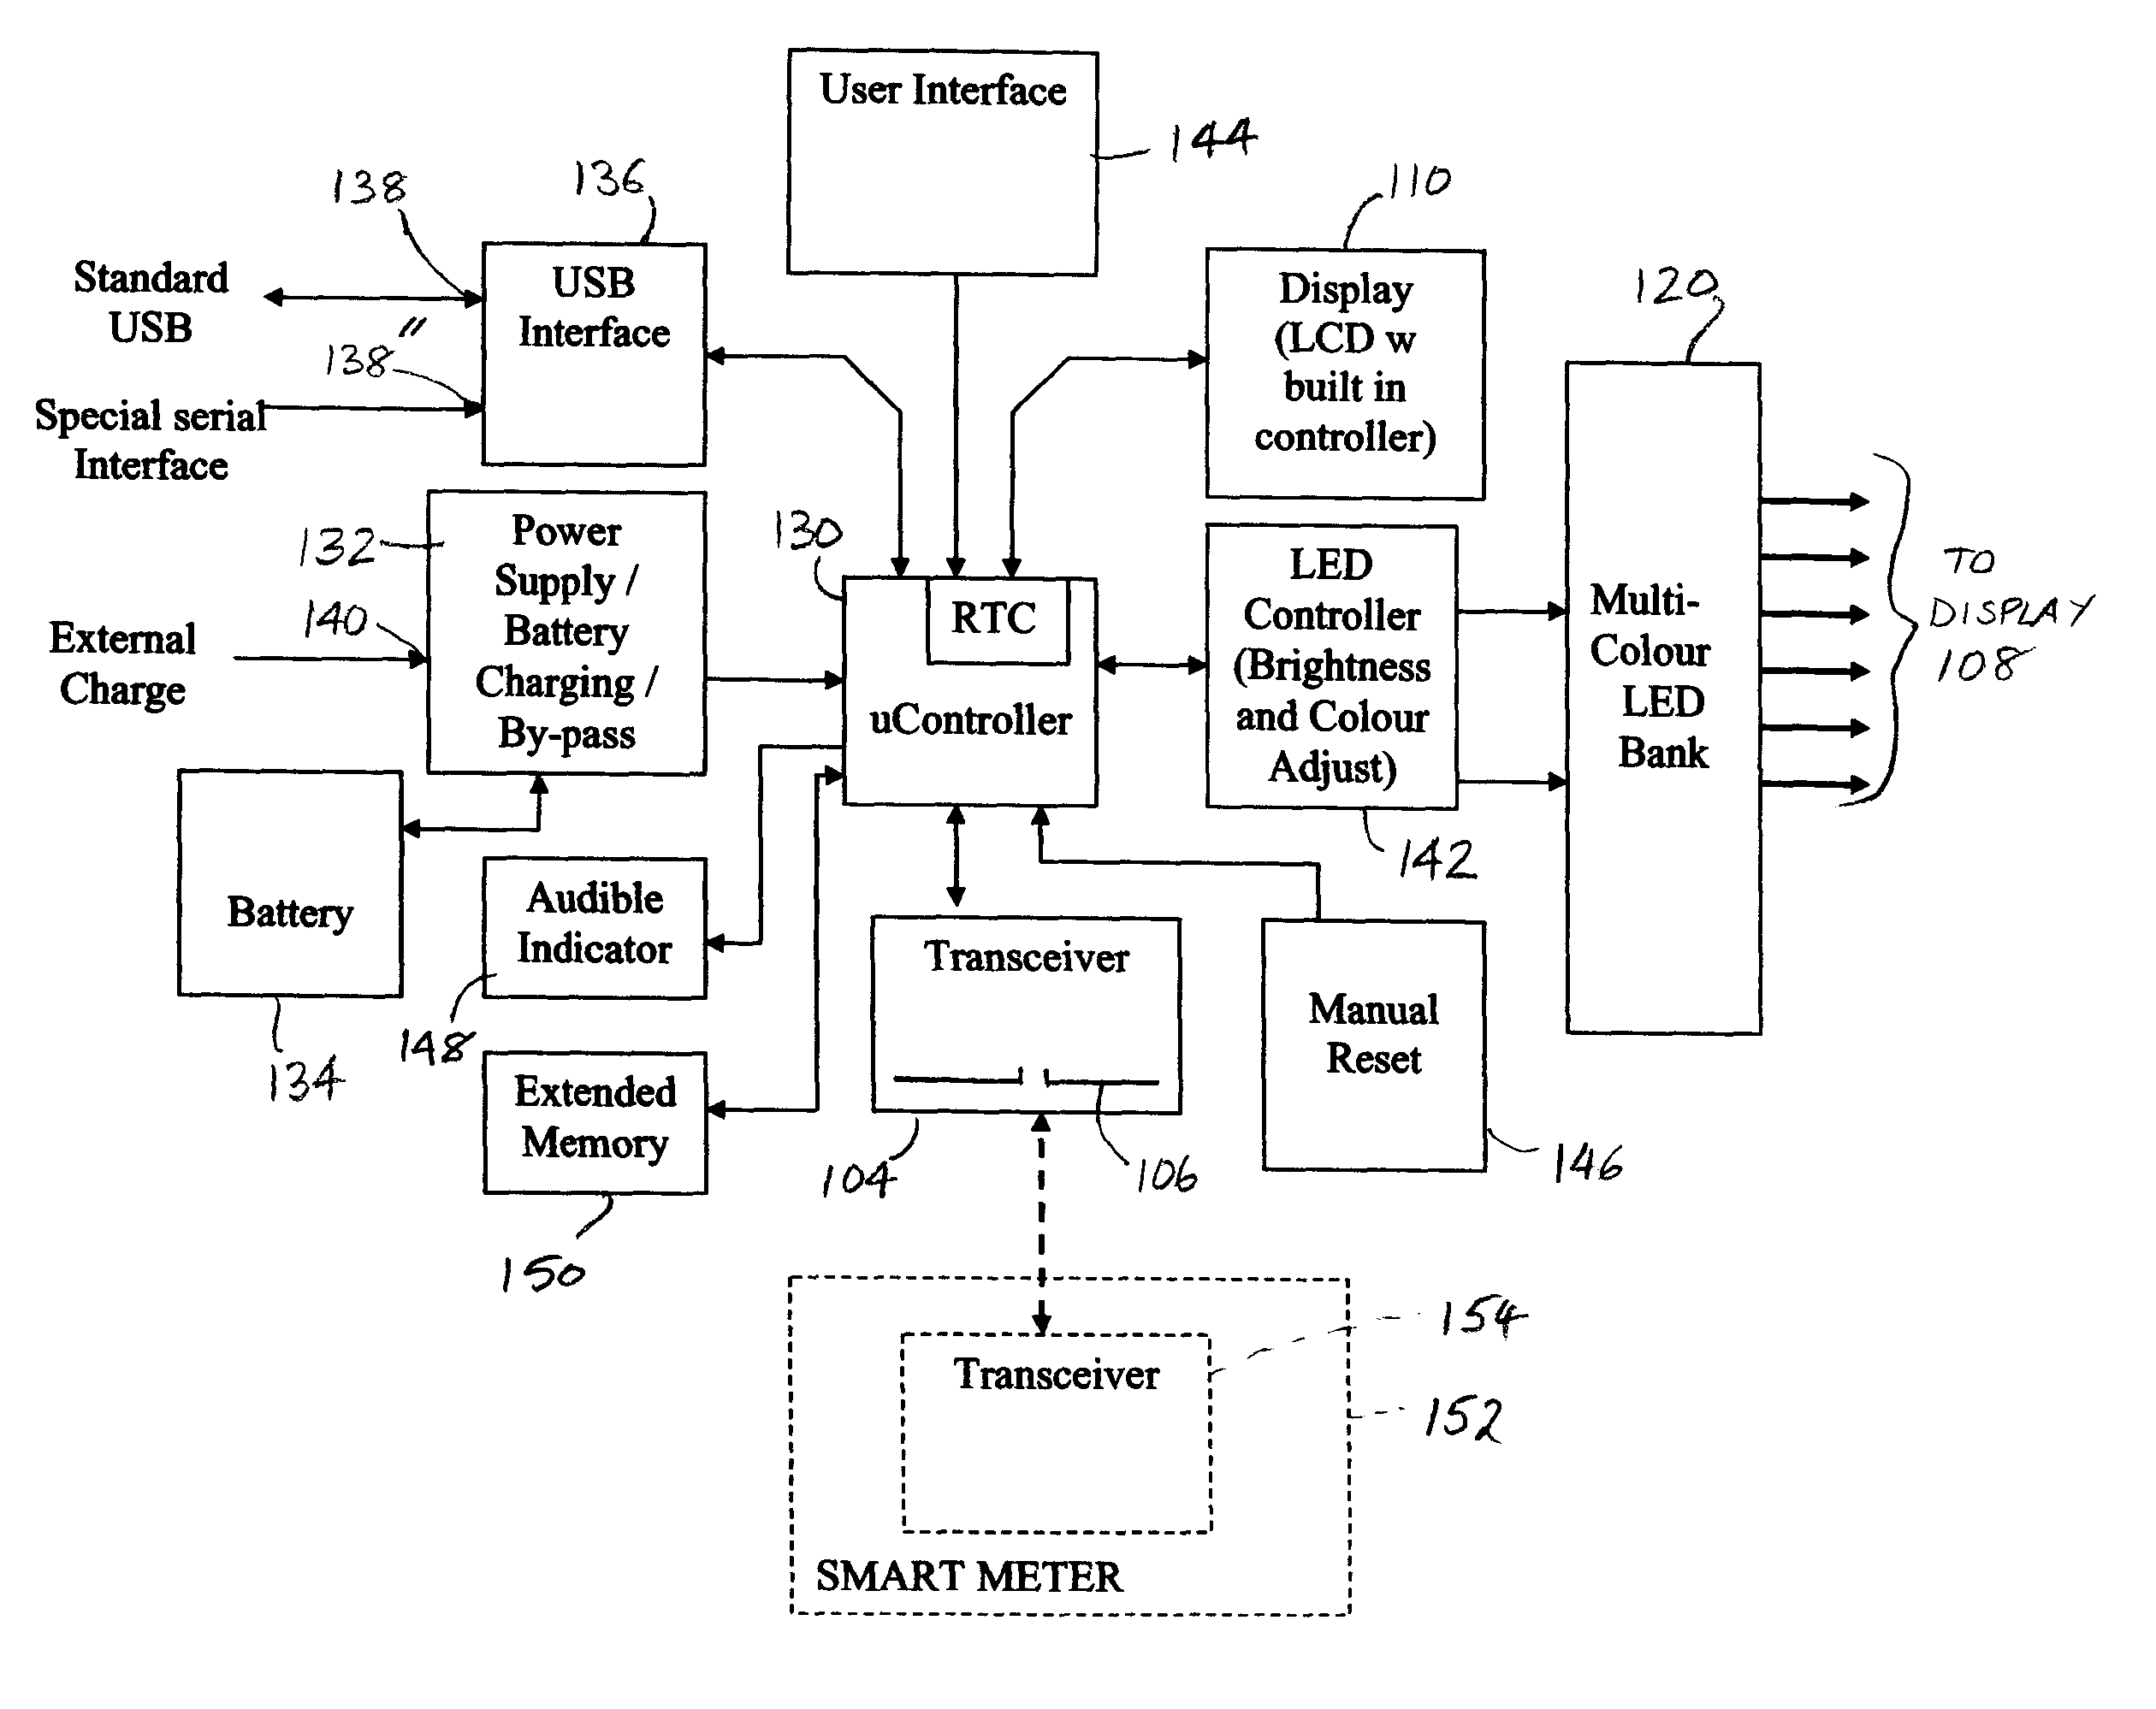
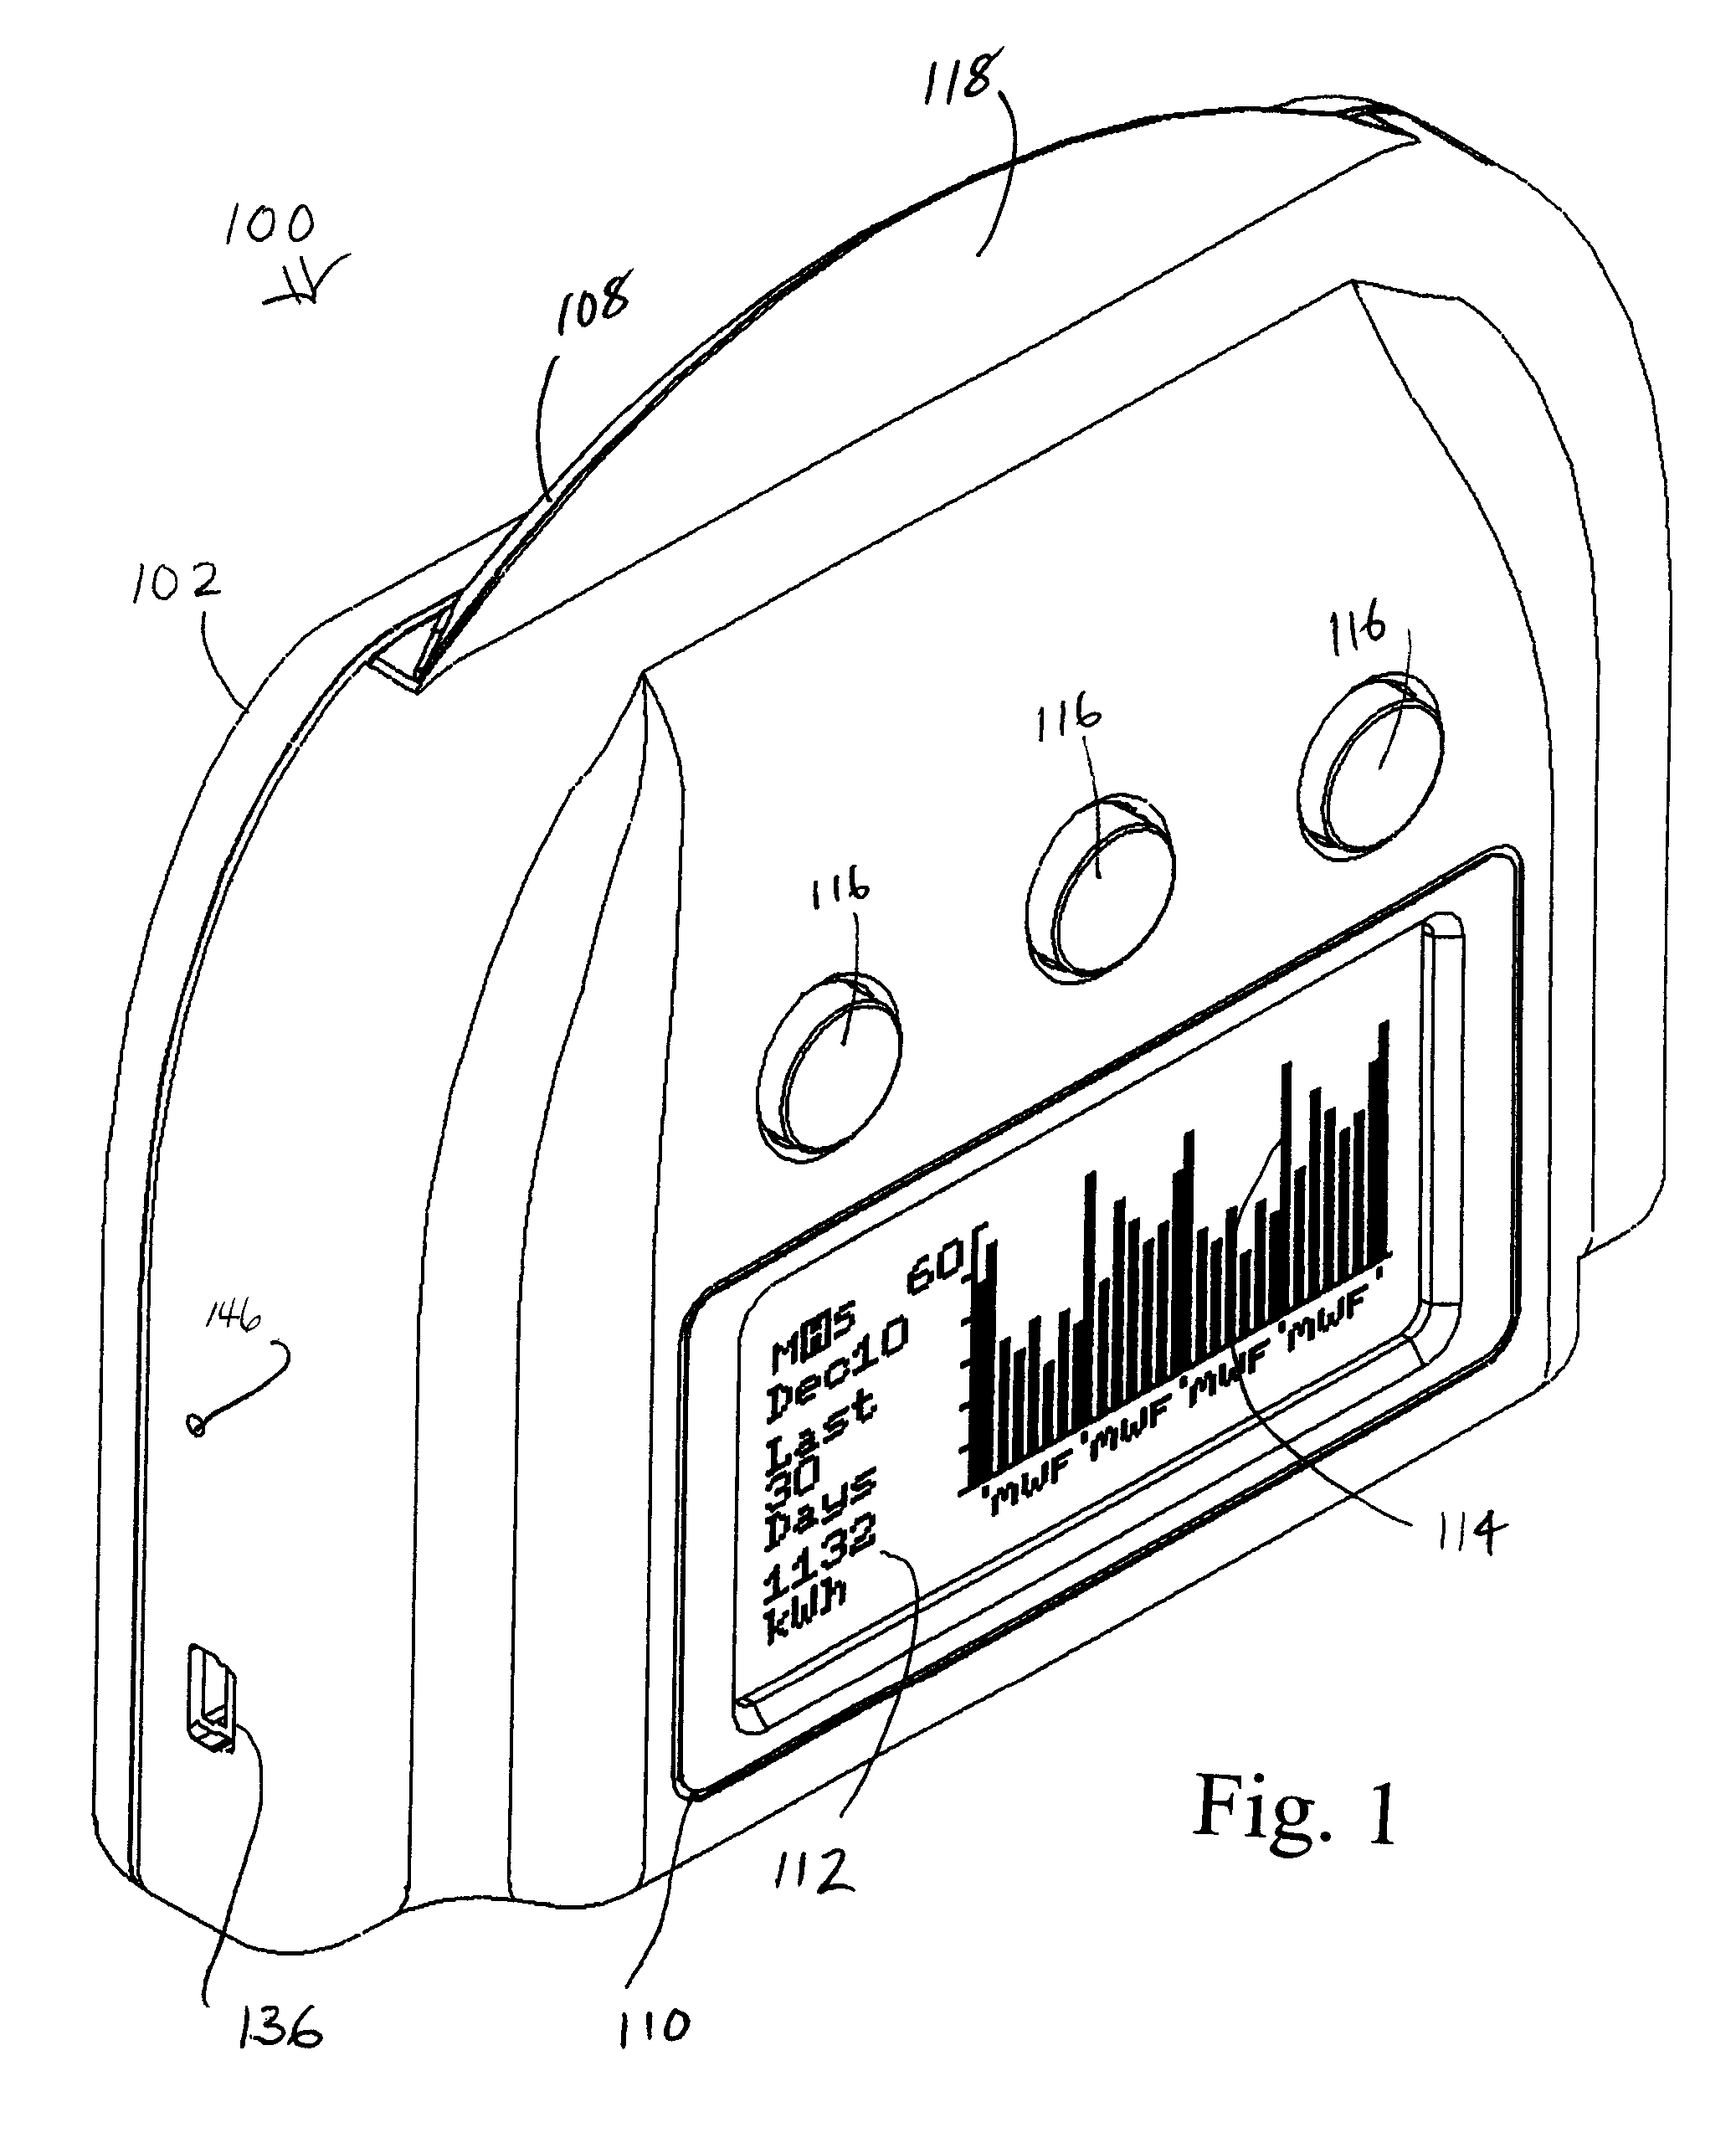
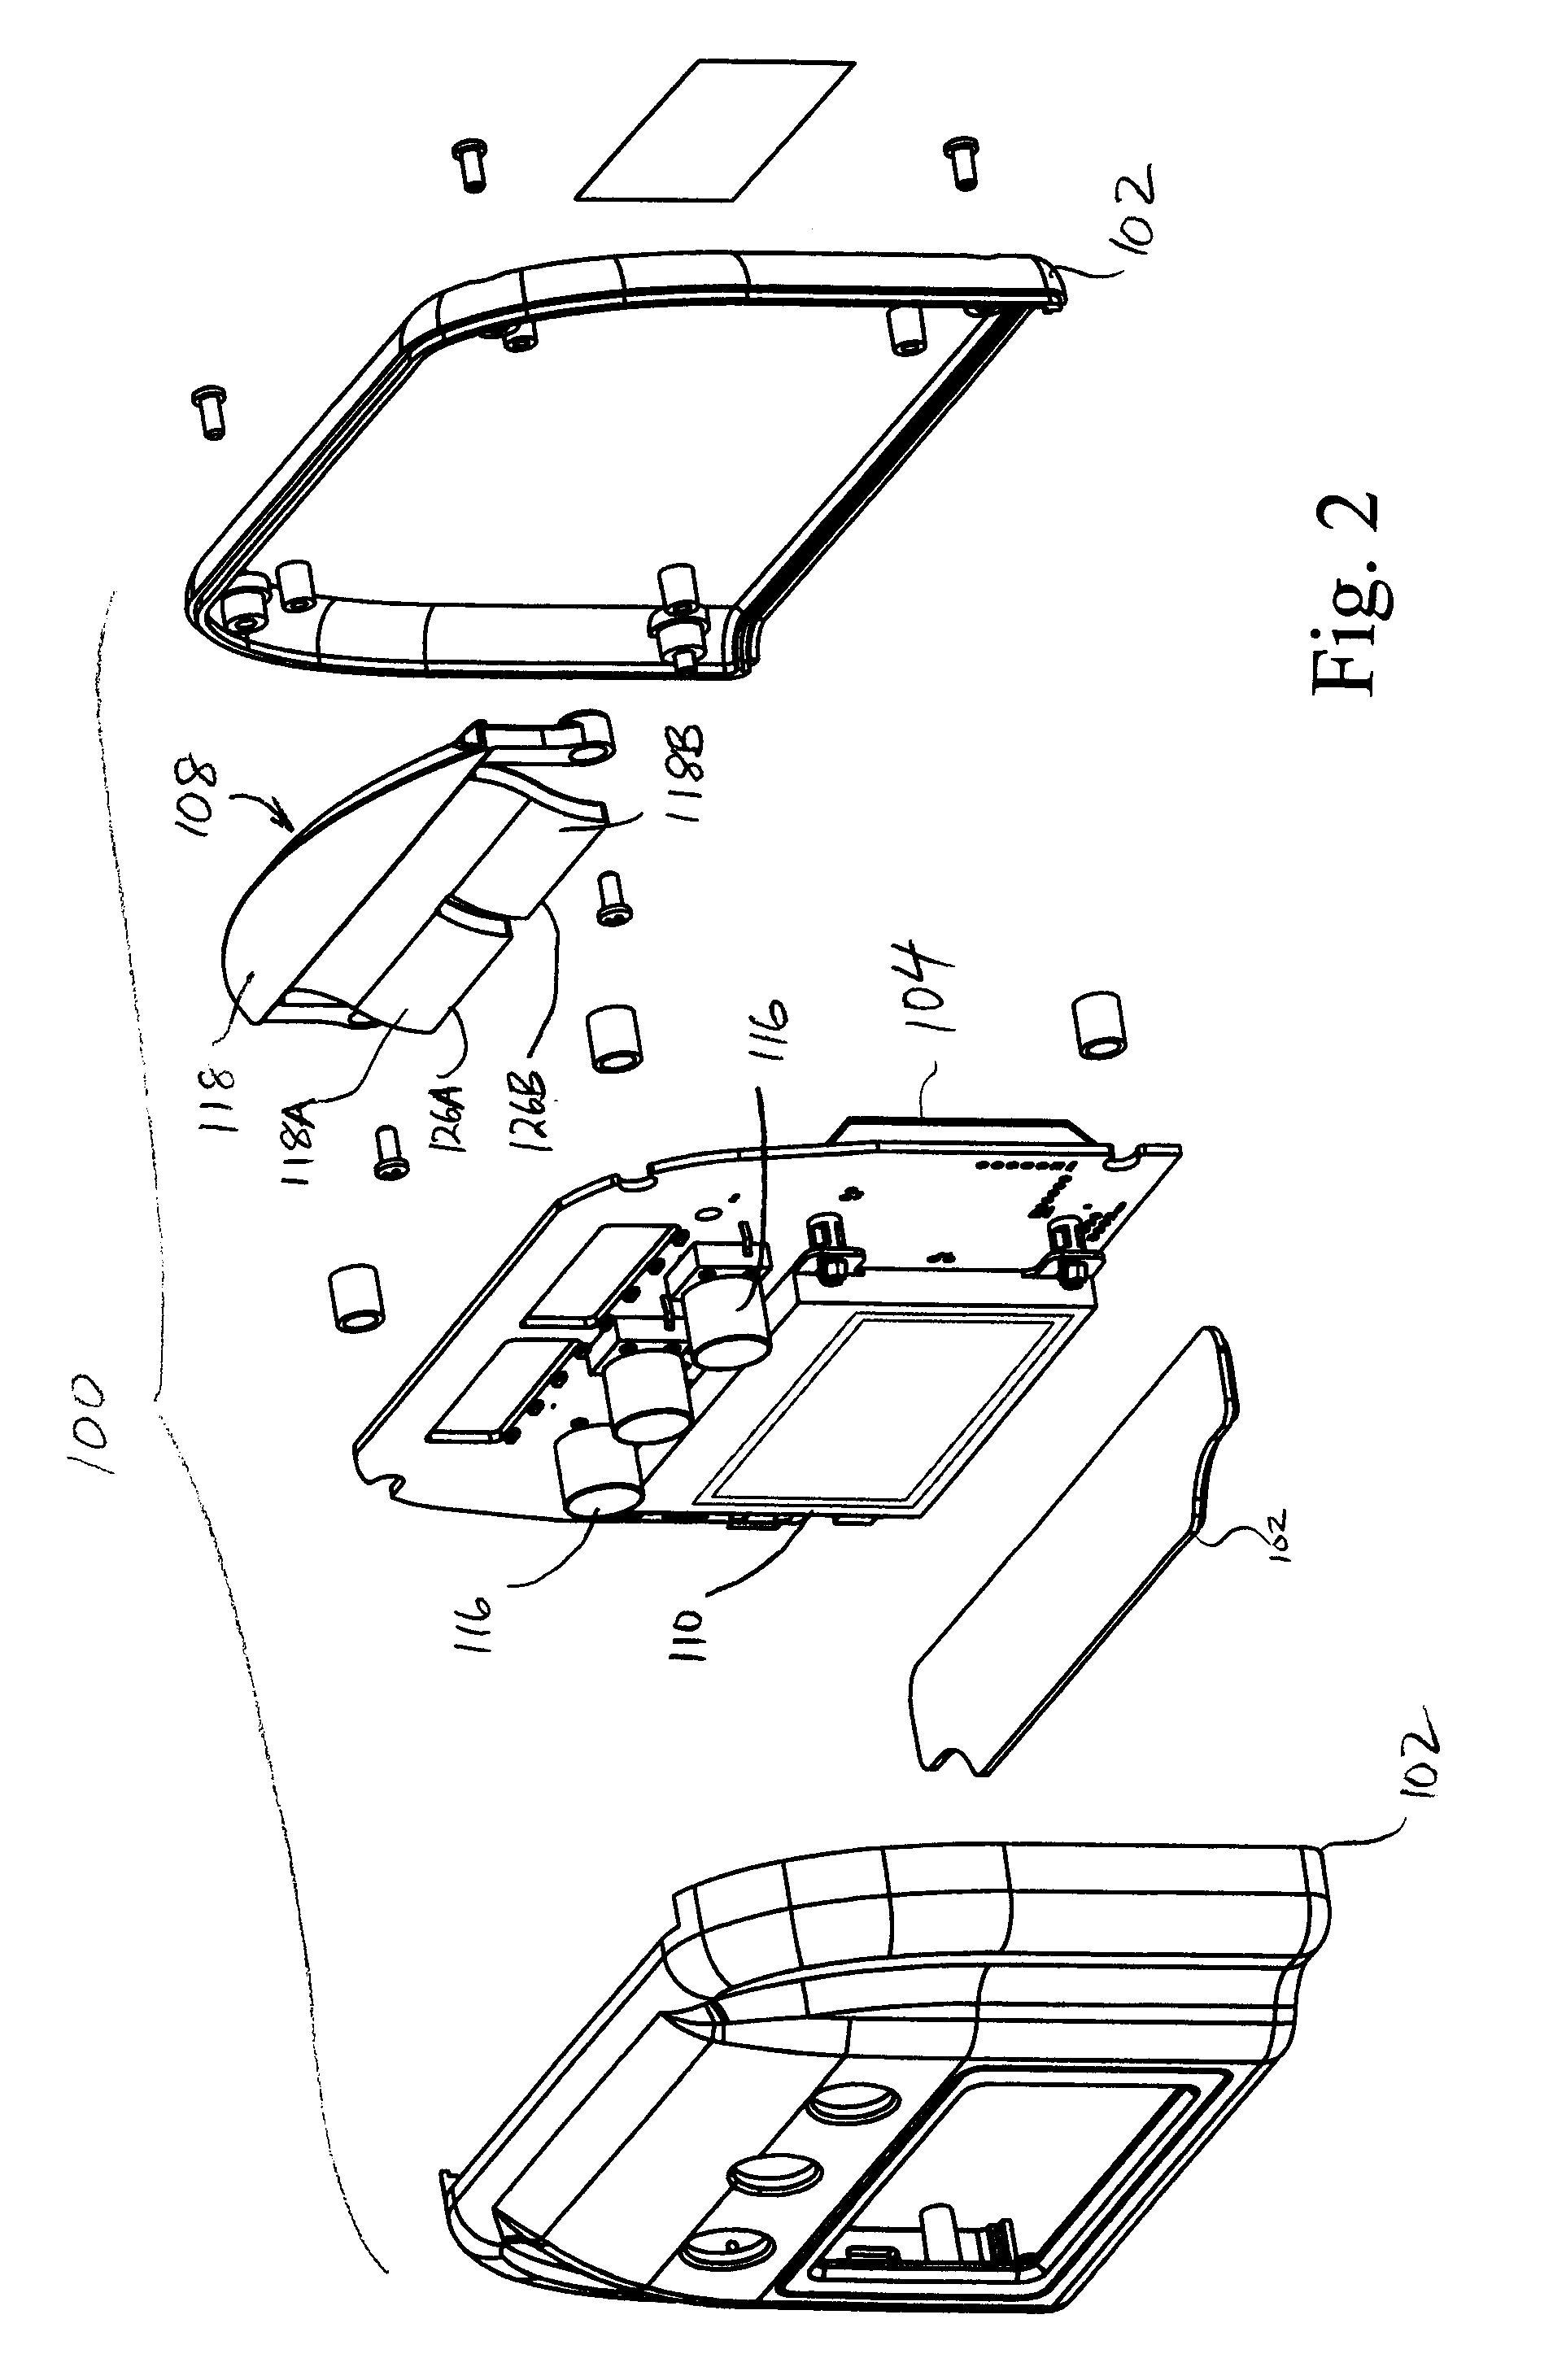
[0088]A monitoring device 100 according to the present invention will now be described with reference to FIGS. 1, 2 and 3. The monitoring device 100 comprises a casing 102 enclosing a radio receiver 104 (see FIGS. 2 and 3) coupled to a dipole antenna 106 (and / or other external / internal antenna) for receiving usage information from a metering system, and having an illuminated display area 108, and a digital display 110, the latter being, in this instance an LCD screen, for example a 64×128 resolution LCD display, for displaying alphanumeric 112 and / or graphical information 114 in one or more modes. The monitoring device 100 also has three multifunction and user-actuated pushbuttons 116 for turning the device on and off and for selecting display modes for displaying different sets of information as will be described in more detail with reference to FIGS. 5(a) to 5(q).

[0089]The casing 102 comprises a moulded plastic casing suitable for wall mounting or table-top display.

[0090]In this e...

second embodiment

[0121]Thus, FIG. 10A shows a monitoring device which has an illuminated display, in the form of a straight, elongate window or lens 208 near the top of the casing 202. If desired, the window or lens 208 may be translucent or frosted to provide diffusion. The corresponding printed circuit board shown in FIG. 10B has a straight row of LEDs 220 which, when the board is installed will be aligned with window 208.

[0122]The single row of LEDs may be selected and driven to illuminate the window / lens 208 with one of red, orange / yellow and green light dependent on rate period, the illumination being scanned linearly across the window at a traverse rate dependent on, and indicative of, a rate of consumption; for example, by sequentially illuminating the linear array of LEDs.

[0123]FIGS. 11A and 11B illustrate an embodiment in which the casing 302 is slotted to accommodate a display area comprising three straight elongate windows 308(a), 308(b), 308(c) in the casing for displaying, respectively...


PUM


Abstract

A monitoring device, system and method are provided for in-home / on-premises monitoring of usage of utilities, such as electricity and other services. The monitoring device receives information from a smart meter, and displays usage through a display, illuminating an area using a color indicative of the current cost of consumption, and varying the illuminated area at a rate indicative of a rate of consumption or other metric, the varying of the illuminated area simulating movement in the display. The display provides a consumer with “at a glance” visual information on current usage. Optionally a digital display screen provides detailed alphanumeric and graphical information, through a number of selectable display modes. One or more devices may be networked, and interface directly or indirectly with a transceiver of a smart metering system, or a retrofit transceiver for a conventional meter. Monitoring of other utilities and services may alternatively or additionally be provided.

Description

CROSS-REFERENCE TO RELATED APPLICATION[0001]This application is derived from International (PCT) application No. PCT / CA2008 / 000208 filed Feb. 4, 2008 which claimed priority from U.S. provisional patent application No. 60 / 887,985 filed Feb. 2, 2007. The entire contents of each of these prior applications are incorporated herein by reference.TECHNICAL FIELD[0002]This invention relates to a utility monitoring device, system and method for monitoring usage of utility services such as the supply of electricity, gas, water or other commodities (services), and is especially applicable to so-called smart metering systems and on-premises (e.g., in-home) monitoring devices for monitoring consumption of utilities to provide information on current and cumulative usage by consumers.BACKGROUND ART[0003]Residential, commercial and industrial establishments are typically provided with meters for measuring consumption of commodities, including electricity, gas and water, and other services, supplied...

Claims


Application Information

Patent Timeline
Patent Type & Authority Patents(United States)
IPC IPC(8): G08B23/00
CPCG01D4/002H04Q9/00G08C19/16H04Q2209/30G01R22/063G01R22/10Y02B90/241Y04S20/32Y04S20/46Y02B90/245Y04S20/40H04Q2209/43H04Q2209/25H04Q2209/60G01R21/1333G06Q50/06G01D2204/18Y02B90/20Y04S20/30G01R21/133
Inventor SALTER, GEOFFREY DAVID VINCENT
Owner AZTECH ASSOC INC
Why Eureka
Try Eureka