
Medical imaging method and system
a medical imaging and image analysis technology, applied in the field of medical imaging methods and systems, can solve the problems of not giving appropriate high “r” values in the rgb system, and the color system of the rgb does not allow expression or normalization of this problem
- Summary
- Abstract
- Description
- Claims
- Application Information
AI Technical Summary
Benefits of technology
Problems solved by technology
Method used
Image

Examples
examples
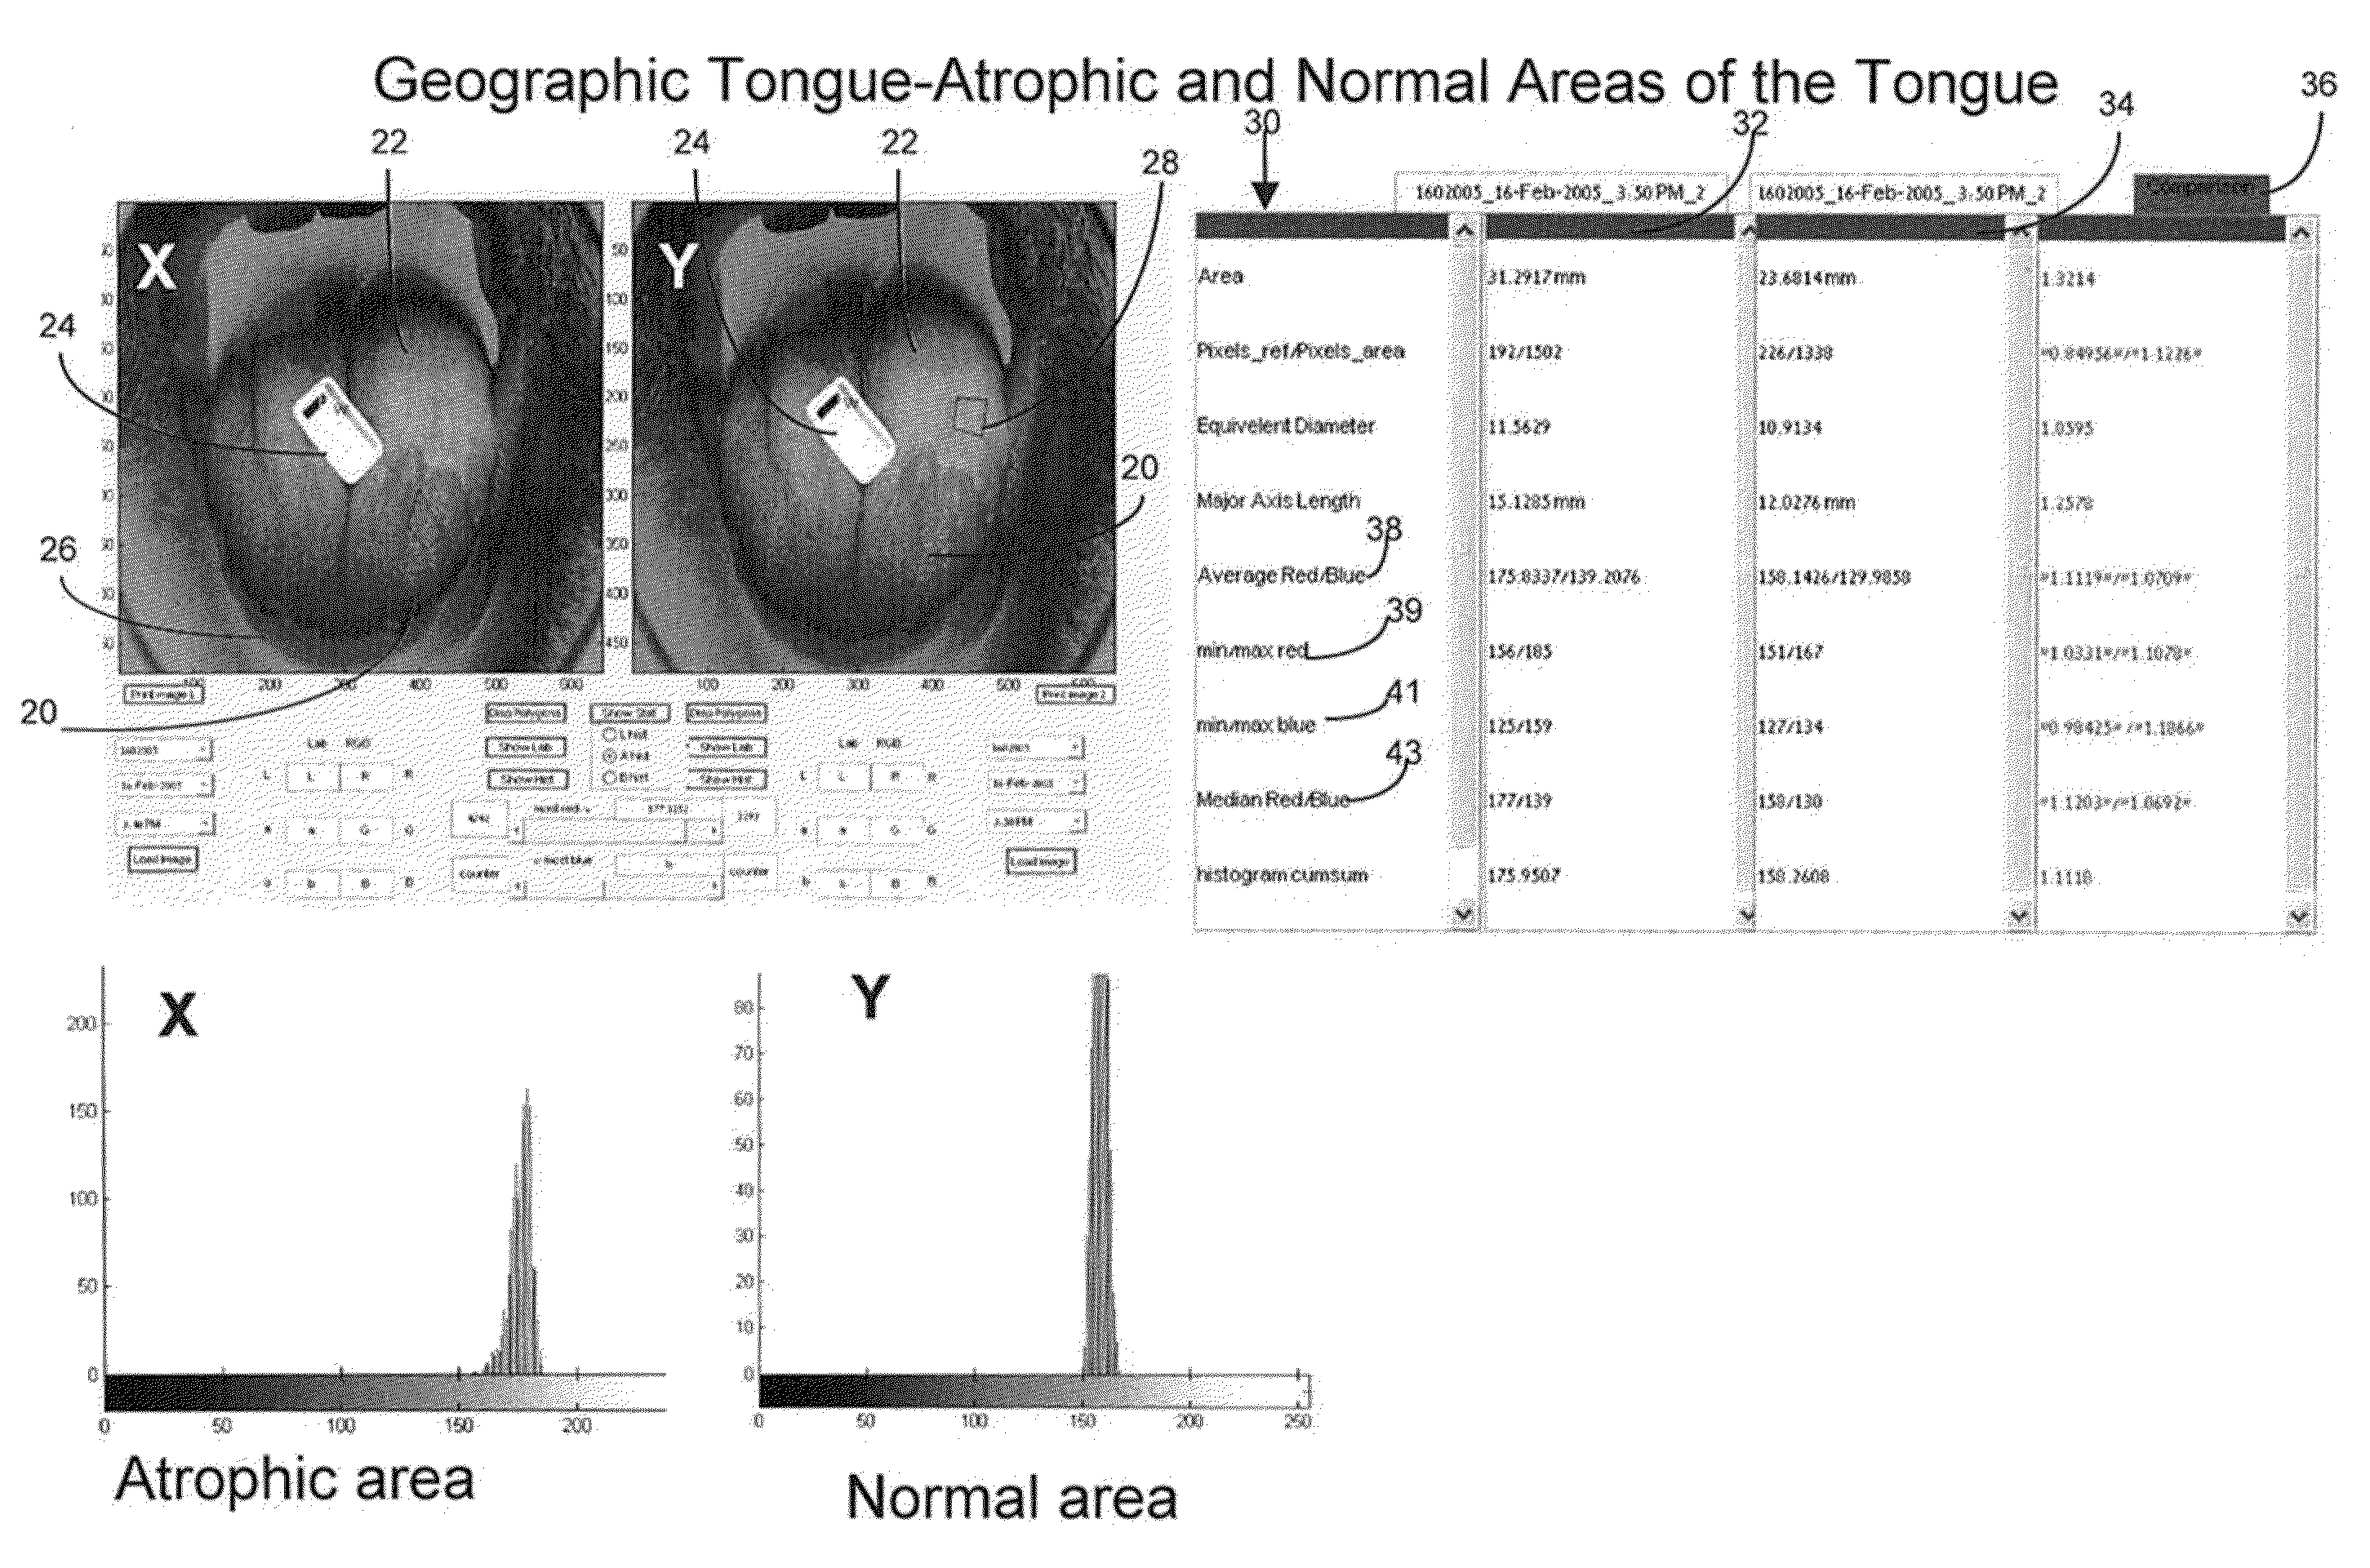
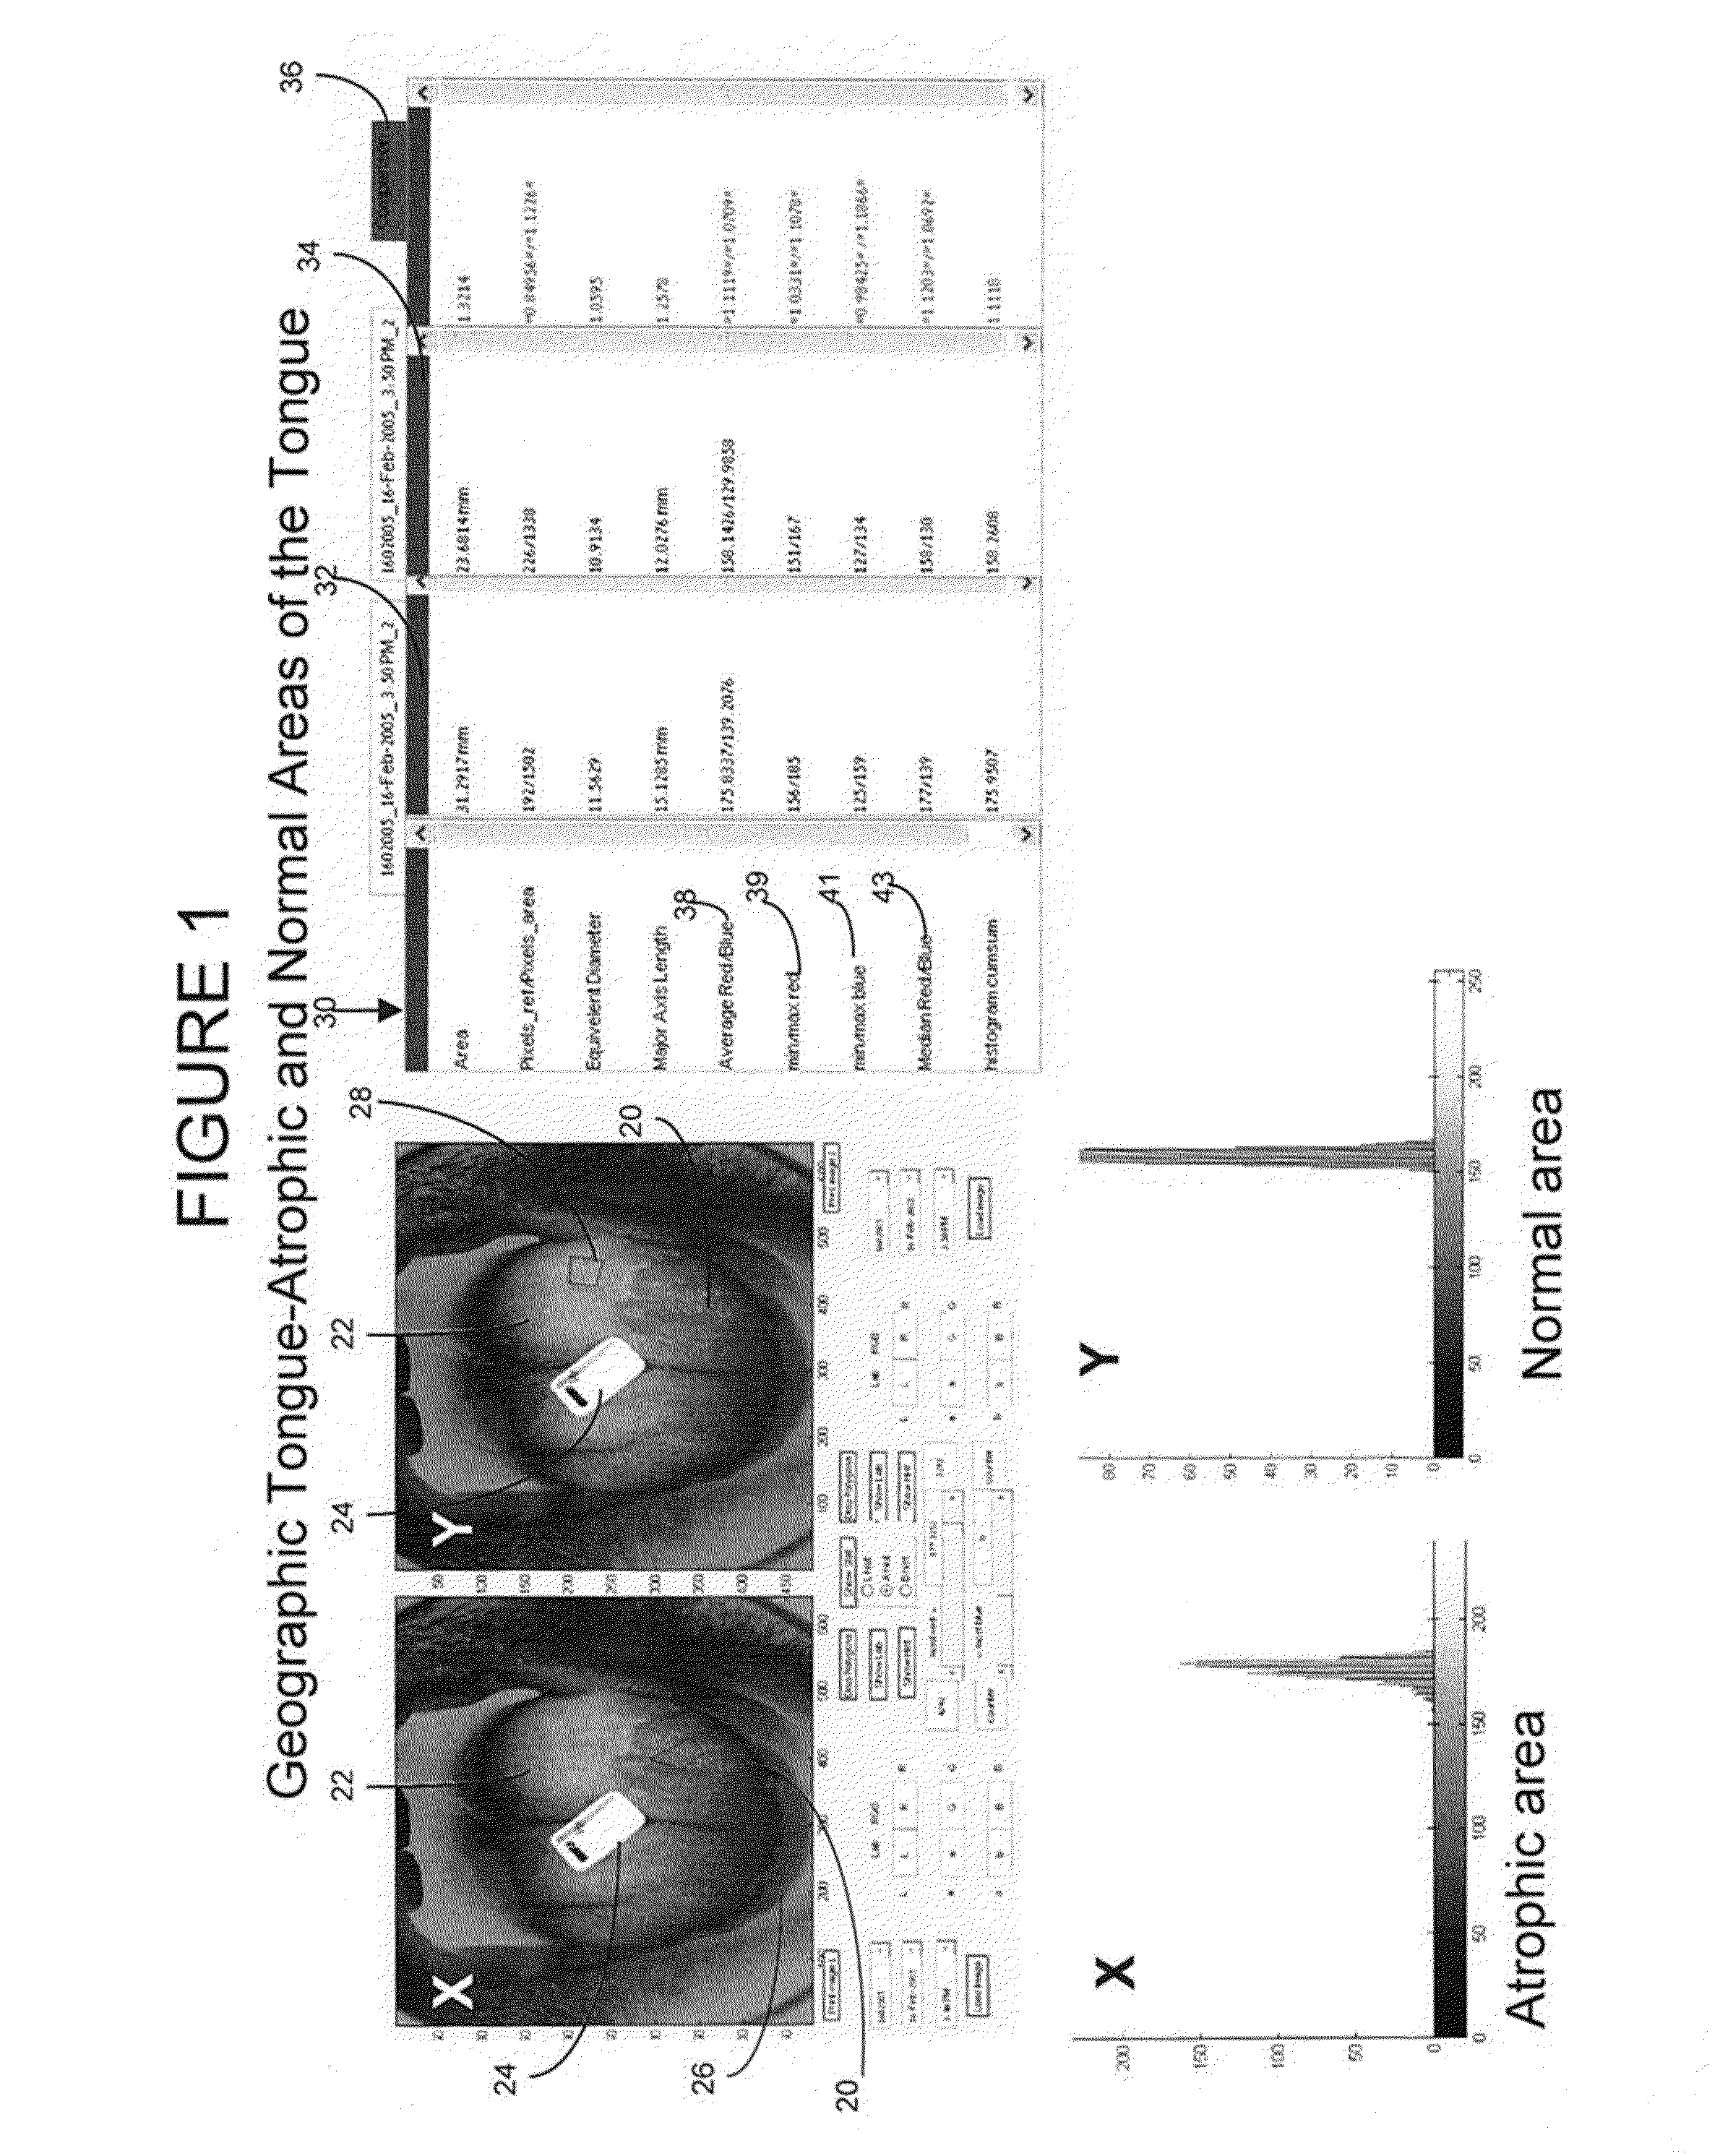
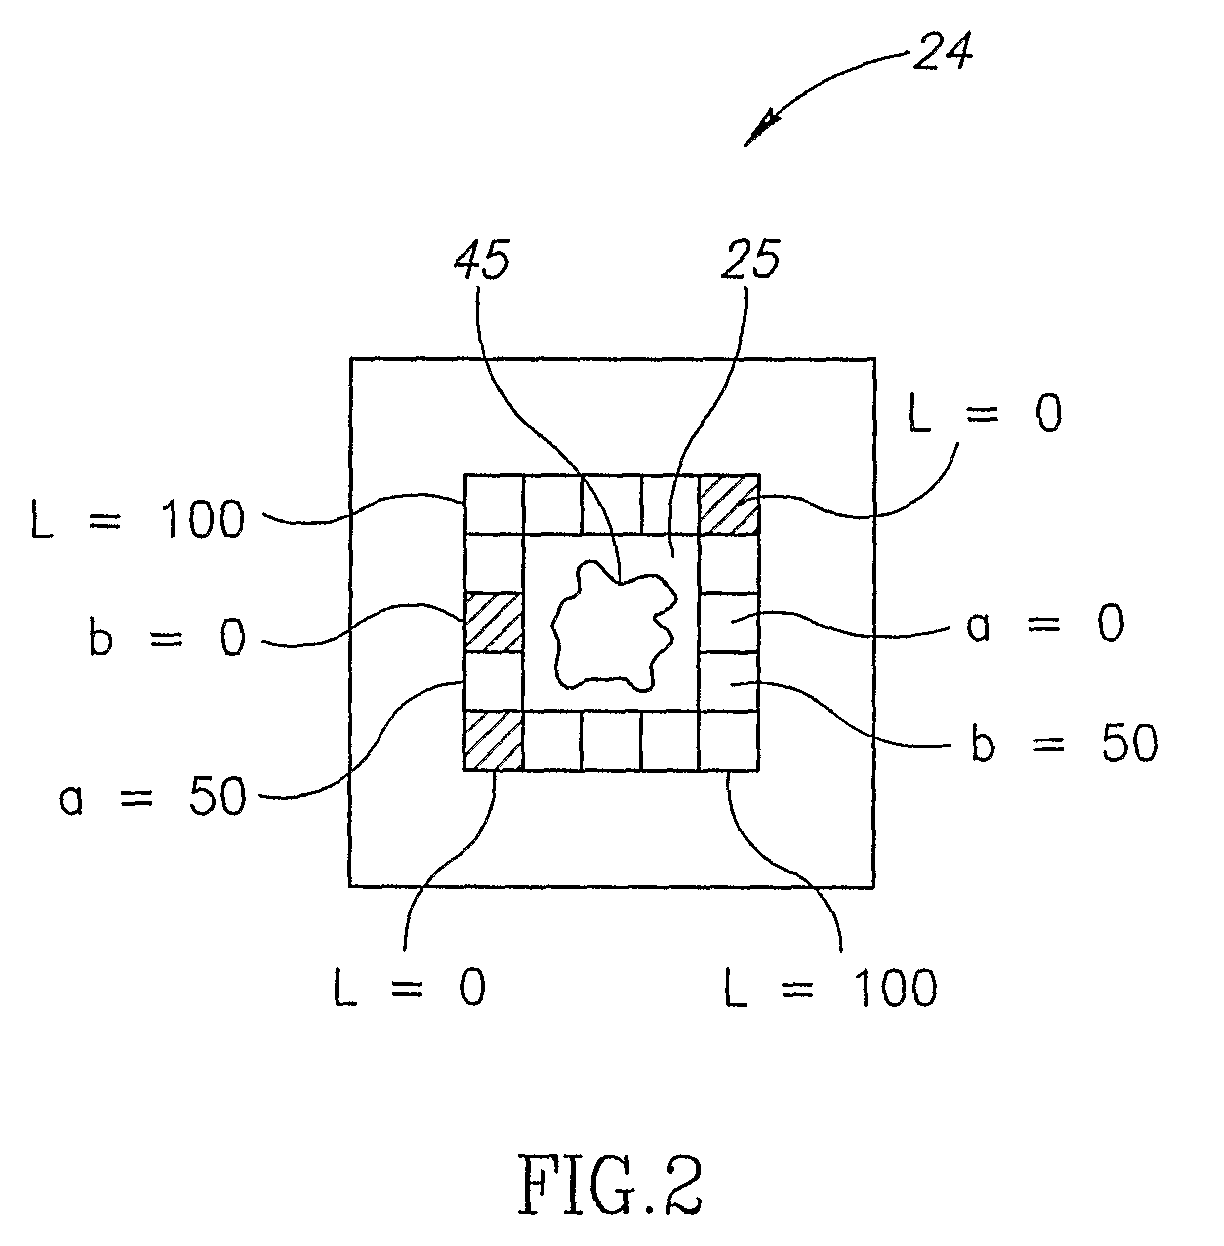
[0145]Referring to FIG. 4, a digital image was captured of a white dysplastic (premalignant) lesion. Note reference label 24 having reference colors, placed adjacent to the lesion 64 before the image was captured. In the left-most panel (referenced “X”), the area of interest selected comprises the lesion. The borders of the lesion have been traced onscreen, and appear with a faint blue outline 66. In the panel referenced “Y”, the digital image is identical, however the area of interest selected comprises normal tissue (faint blue outline 68 above the lesion). Color analysis thus allows comparison between the normal tissue and the lesion.
[0146]Note histogram 70, 72 pertaining to each panel, appearing at bottom left. The color information attributes calculated appear in panel 74 at right, with the results pertaining to the lesion in column 76 (second from the left), and the results pertaining to normal tissue in column 78 (second from the right). A numerical comparison of the lesion a...
PUM
 Abstract
Description
Claims
Application Information