Imaging based symptomatic classification using a combination of trace transform, fuzzy technique and multitude of features

a trace transform and classification technology, applied in the field of medical image processing, can solve the problems of limiting the blood supply to the involved organs, affecting the quality of life of patients, and affecting the quality of life of patients, and achieves significant accuracy and high accuracy

Inactive Publication Date: 2013-09-10
ATHEROPOINT
View PDF57 Cites 13 Cited by
  • Summary
  • Abstract
  • Description
  • Claims
  • Application Information

AI Technical Summary

Benefits of technology

[0008]The on-line system consists of Atherosclerotic Wall Region estimation using AtheroEdge™ (for longitudinal Ultrasound) or Athero-CTView™ (for CT) or Athero-MRView (for MR) and extendable to 3D carotid Ultrasound or 3D IVUS. This grayscale Wall Region is then fed to a feature extraction processor which computes: (a) Higher Order Spectra-based features; (b) Discrete Wavelet Tansform (DWT)-based features; (c) Texture-based features and (d) Wall Variability. The output of the Feature Processor is fed to the Classifier which is trained off-line from the Database of similar Atherosclerotic Wall Region images. The off-line Classifier is trained from the significant features from (a) Higher Order Spectra; (b) Discrete Wavelet Transform (DWT); (c) Texture and (d) Wall Variability, selected using t-test. Symptomatic ground truth information about the training patients is drawn from cross modality imaging such as CT or MR or longitudinal Ultrasound or 3D ultrasound or 3D IVUS in the form of 0 or 1 (1 for symptomatic). Support Vector Machine (SVM) or similar classifier (such as KNN, PNN or Decision Tree or Adaboost) supervised classifier of varying kernel functions is used off-line for training. The obtained training parameters are then used to evaluate the test set. One can then achieve high accuracy with the radial basis function kernel and the one with a polynomial kernel of order two. The system also yields the risk score value on the basis of the wall features. The proposed technique demonstrates that plaque classification between symptomatic vs. asymptomatic could be achieved with a completely automated CAD tool with a significant accuracy. Performance of the system can be evaluated by computing the accuracy, sensitivity, specificity, and Positive Predictive Value (PPV). Hence, such a tool would prove to be a valuable inclusion in the current treatment planning protocol by vascular surgeons.
[0049]Extracting LIMA borders in presence of Calcium Shadow: Calcium is an important component of the media layer. It is not exactly known how the calcium is formed, but it is said that calcium accumulates in the plaques. During the beginning of Atherosclerosis disease, the arterial wall creates a chemical signal that causes a certain type of WBC (white blood cells) such as monocytes and T cells that attaches the arterial wall. These cells then move into the wall of the artery. These T cells or monocyles are then transformed into foam cells, which collect cholesterol and other fatty materials and trigger the growth of the muscle cells (which are smooth in nature) in the artery. Over time, it is these fat-laden foam cells that accumulate into plaque covered with a fibrous cap. Over time, the calcium accumulates in the plaque. Often times, the calcium is seen in the near wall (proximal wall) of the carotid artery or aortic arteries. This causes the shadow cone formation in the distal wall (far wall). As a result the LI boundaries (for Atherosclerotic Wall Region computation) are over computed from its actual layer. The shadow causes the LI lining over the actual LI boundary. As a result, the LI-MA distances are over computed in the shadow zone. Because of this, the Atherosclerotic Wall Region formation is over computed in these cases. This application particularly takes care of Atherosclerotic Wall Region computation during the shadow cone formation. We will see how the actual LI boundaries are recovered if calcium is present causing the shadow cone. As a result, the Atherosclerotic Wall Region computation has the following advantages when using shadow cones (a) Accurate Atherosclerotic Wall Region computation in real time when the calcium is present in the proximal wall (near wall) causing the shadow cone formation; (b) The system allows computing the Atherosclerotic Wall Region in both cases: (a) when calcium is present and when calcium is not present.

Problems solved by technology

Formation of plaques makes the arteries stiff and narrow (stenosis), thereby restricting blood supply to the involved organs.
Such restricted blood supply would damage the organ, and eventually lead to its failure.
Pieces of plaque can also break away and move from the affected artery to smaller blood vessels, block these vessels completely, and consequently, result in tissue damage and death (embolization).
This embolization process is one of the causes of heart attack and stroke.
Unfortunately, atherosclerosis is a chronic disease that remains asymptomatic for decades.
However, ultrasound technique is operator dependent, and hence, the interpretation is subjective.
Moreover, even though studies show that ultrasonographic B-mode characterization of plaque morphology is useful in assessing the vulnerability of atherosclerotic lesions, a confident and reproducible classification of dangerous plaques and its risk score from this plaque is still not available.
Also, the correlation between ultrasonographic findings and the histological findings of carotid plaques is often poor.
These limitations are due to the low image resolution and artifacts associated with ultrasound imaging.
This conclusion indicates that there is a considerable risk for the patient undergoing either of these procedures.
Since the ultrasound vascular scans do not always have the vessel orientation horizontal with respect bottom edge of the image, manual methods can pose a further challenge towards the Atherosclerotic Wall Region estimation.(v) Guiding Method for the Calibration System: Since the recognition is followed by the calibration (segmentation) process, the calibration system becomes very robust since the calibration processing is done in the region of interest determined by the automated recognition system.
Though speckle reduction is common in ultrasound imaging, but the way speckle reduction is used here is very conservative.
IMT estimation having a value close to 1 mm is a very challenging task in ultrasound images due to large number of variabilities such as: poor contrast, orientation of the vessels, varying thickness, sudden fading of the contrast due to change in tissue density, presence of various plaque components in the intima wall such as lipids, calcium, hemorrhage, etc.
Under normal resolutions, a one mm thick media thickness is difficult to estimate using stand-alone image processing techniques.
Over and above, the image processing algorithms face an even tighter challenge due to the presence of speckle distribution.
Manual Atherosclerotic Wall Region (AWR) and measurement of IMT from B-mode images is time consuming, subjective, and difficult.
Therefore, complete automation cannot he achieved and also inter-observer variability prevails.
However it can cause a small decrease in resolution and blurring because of the averaging nature.
Also, while part of the MA and LI edge estimation may be done using the edge flow algorithm, the segmentation cannot yet be considered complete as there are still some missing MA and LI edges and the edges found must be classified as either belonging to the MA profile or the LI profile.
Secondly, since there can still be small unwanted edge objects around the interested area, small edge objects are defined as those which have an area ratio below a certain limit φ and are subsequently removed from the image.
IMT measurements and AWR computation in such cases can become difficult or challenging.
This application just not finds the reliable and automated IMT measurements and AWR computation in ordinary arterial walls, but also in the presence of calcification.
Such an imbalance in sensitivity and specificity values indicates that the classifier has more capability of classifying only one class correctly than the other.

Method used


Image

  • Imaging based symptomatic classification using a combination of trace transform, fuzzy technique and multitude of features
  • Imaging based symptomatic classification using a combination of trace transform, fuzzy technique and multitude of features
  • Imaging based symptomatic classification using a combination of trace transform, fuzzy technique and multitude of features

Examples


Embodiment Construction

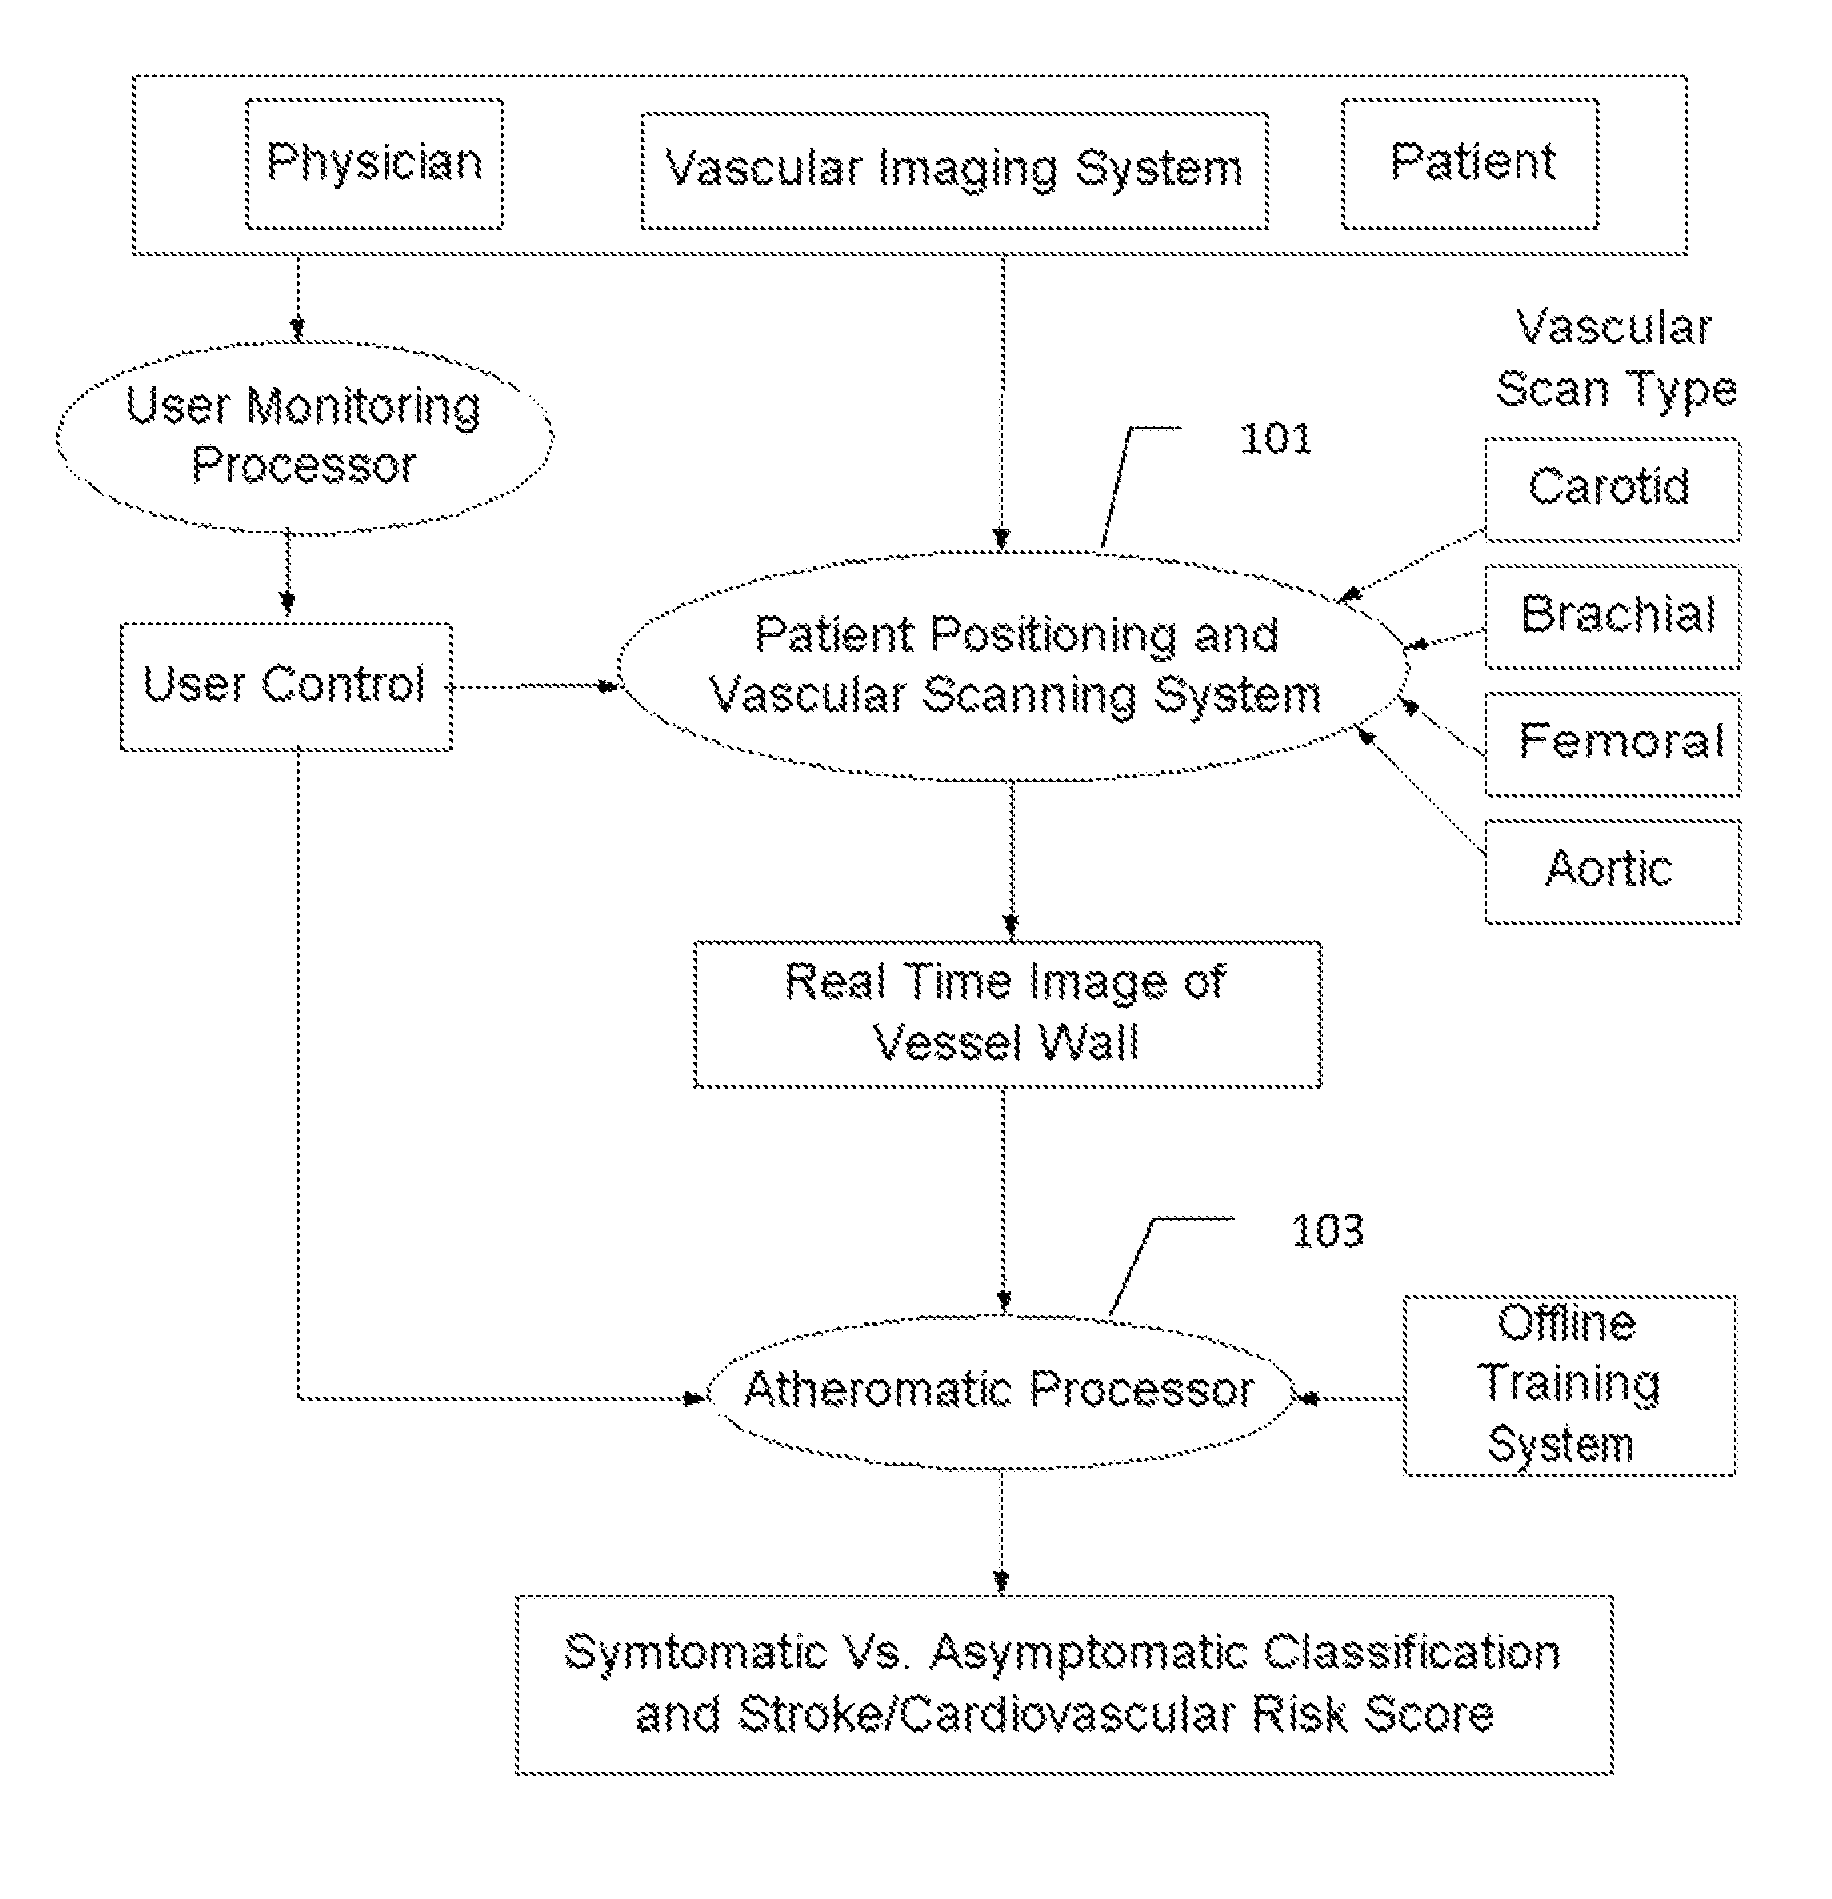
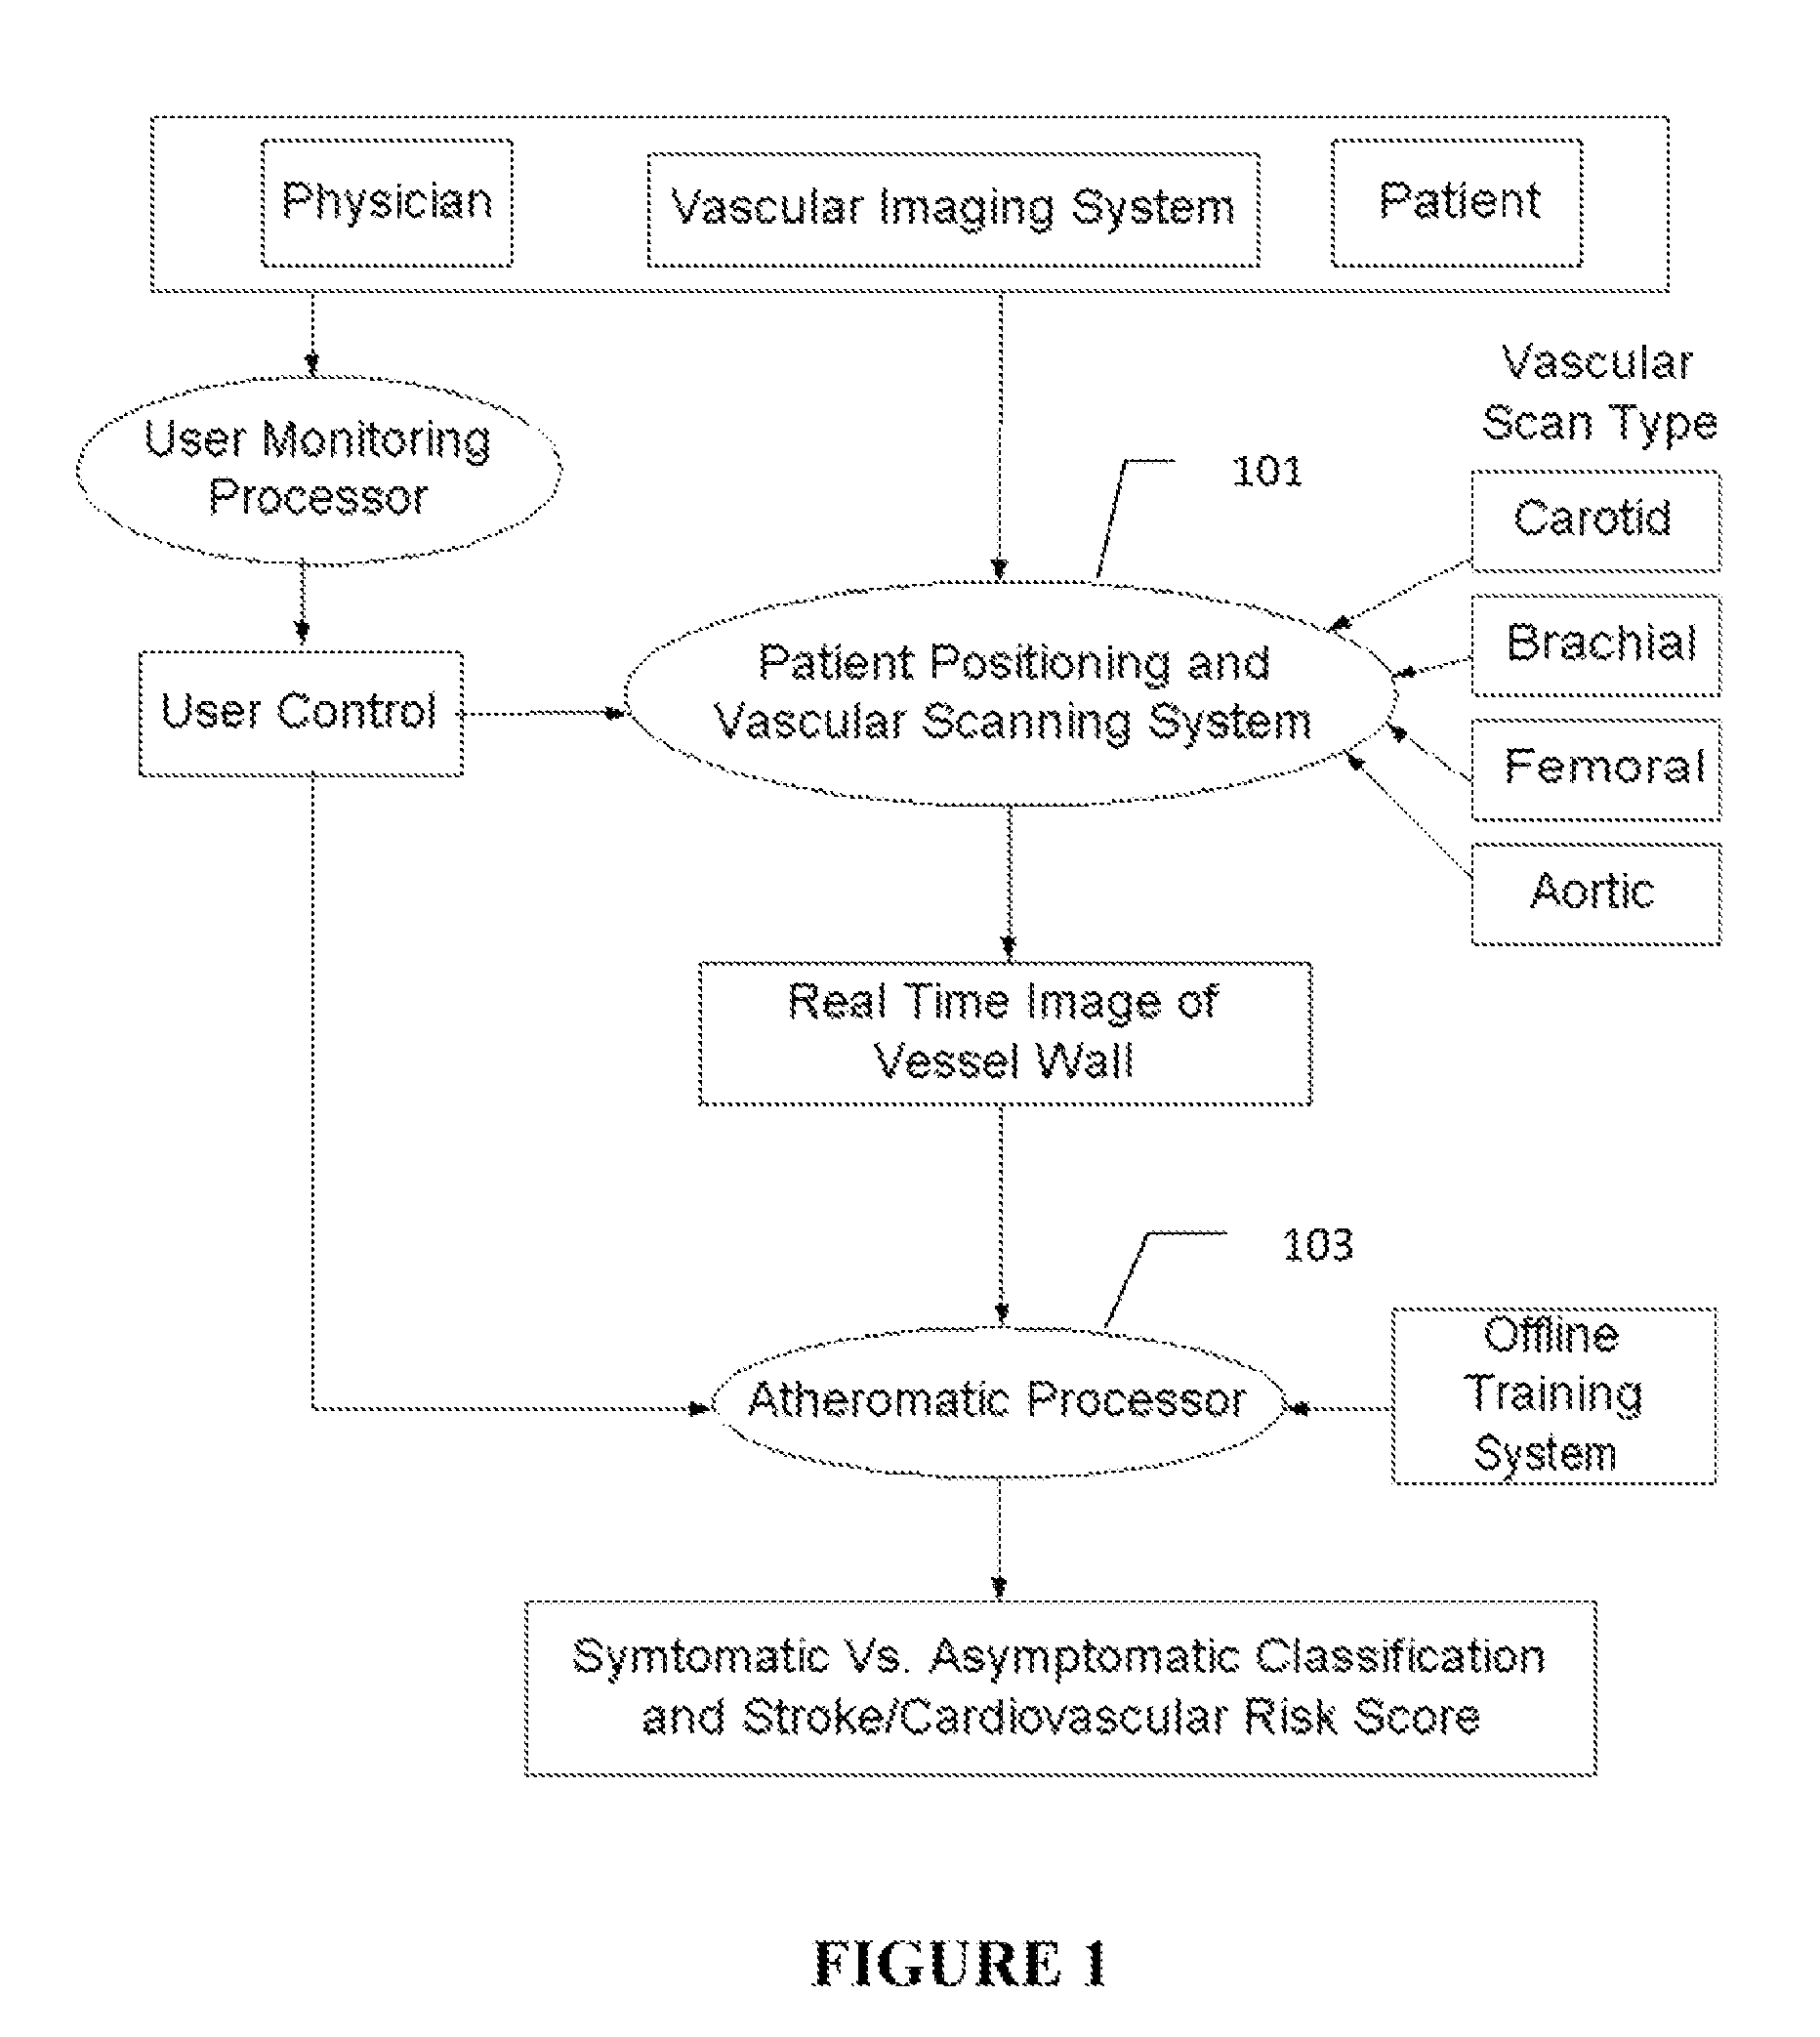
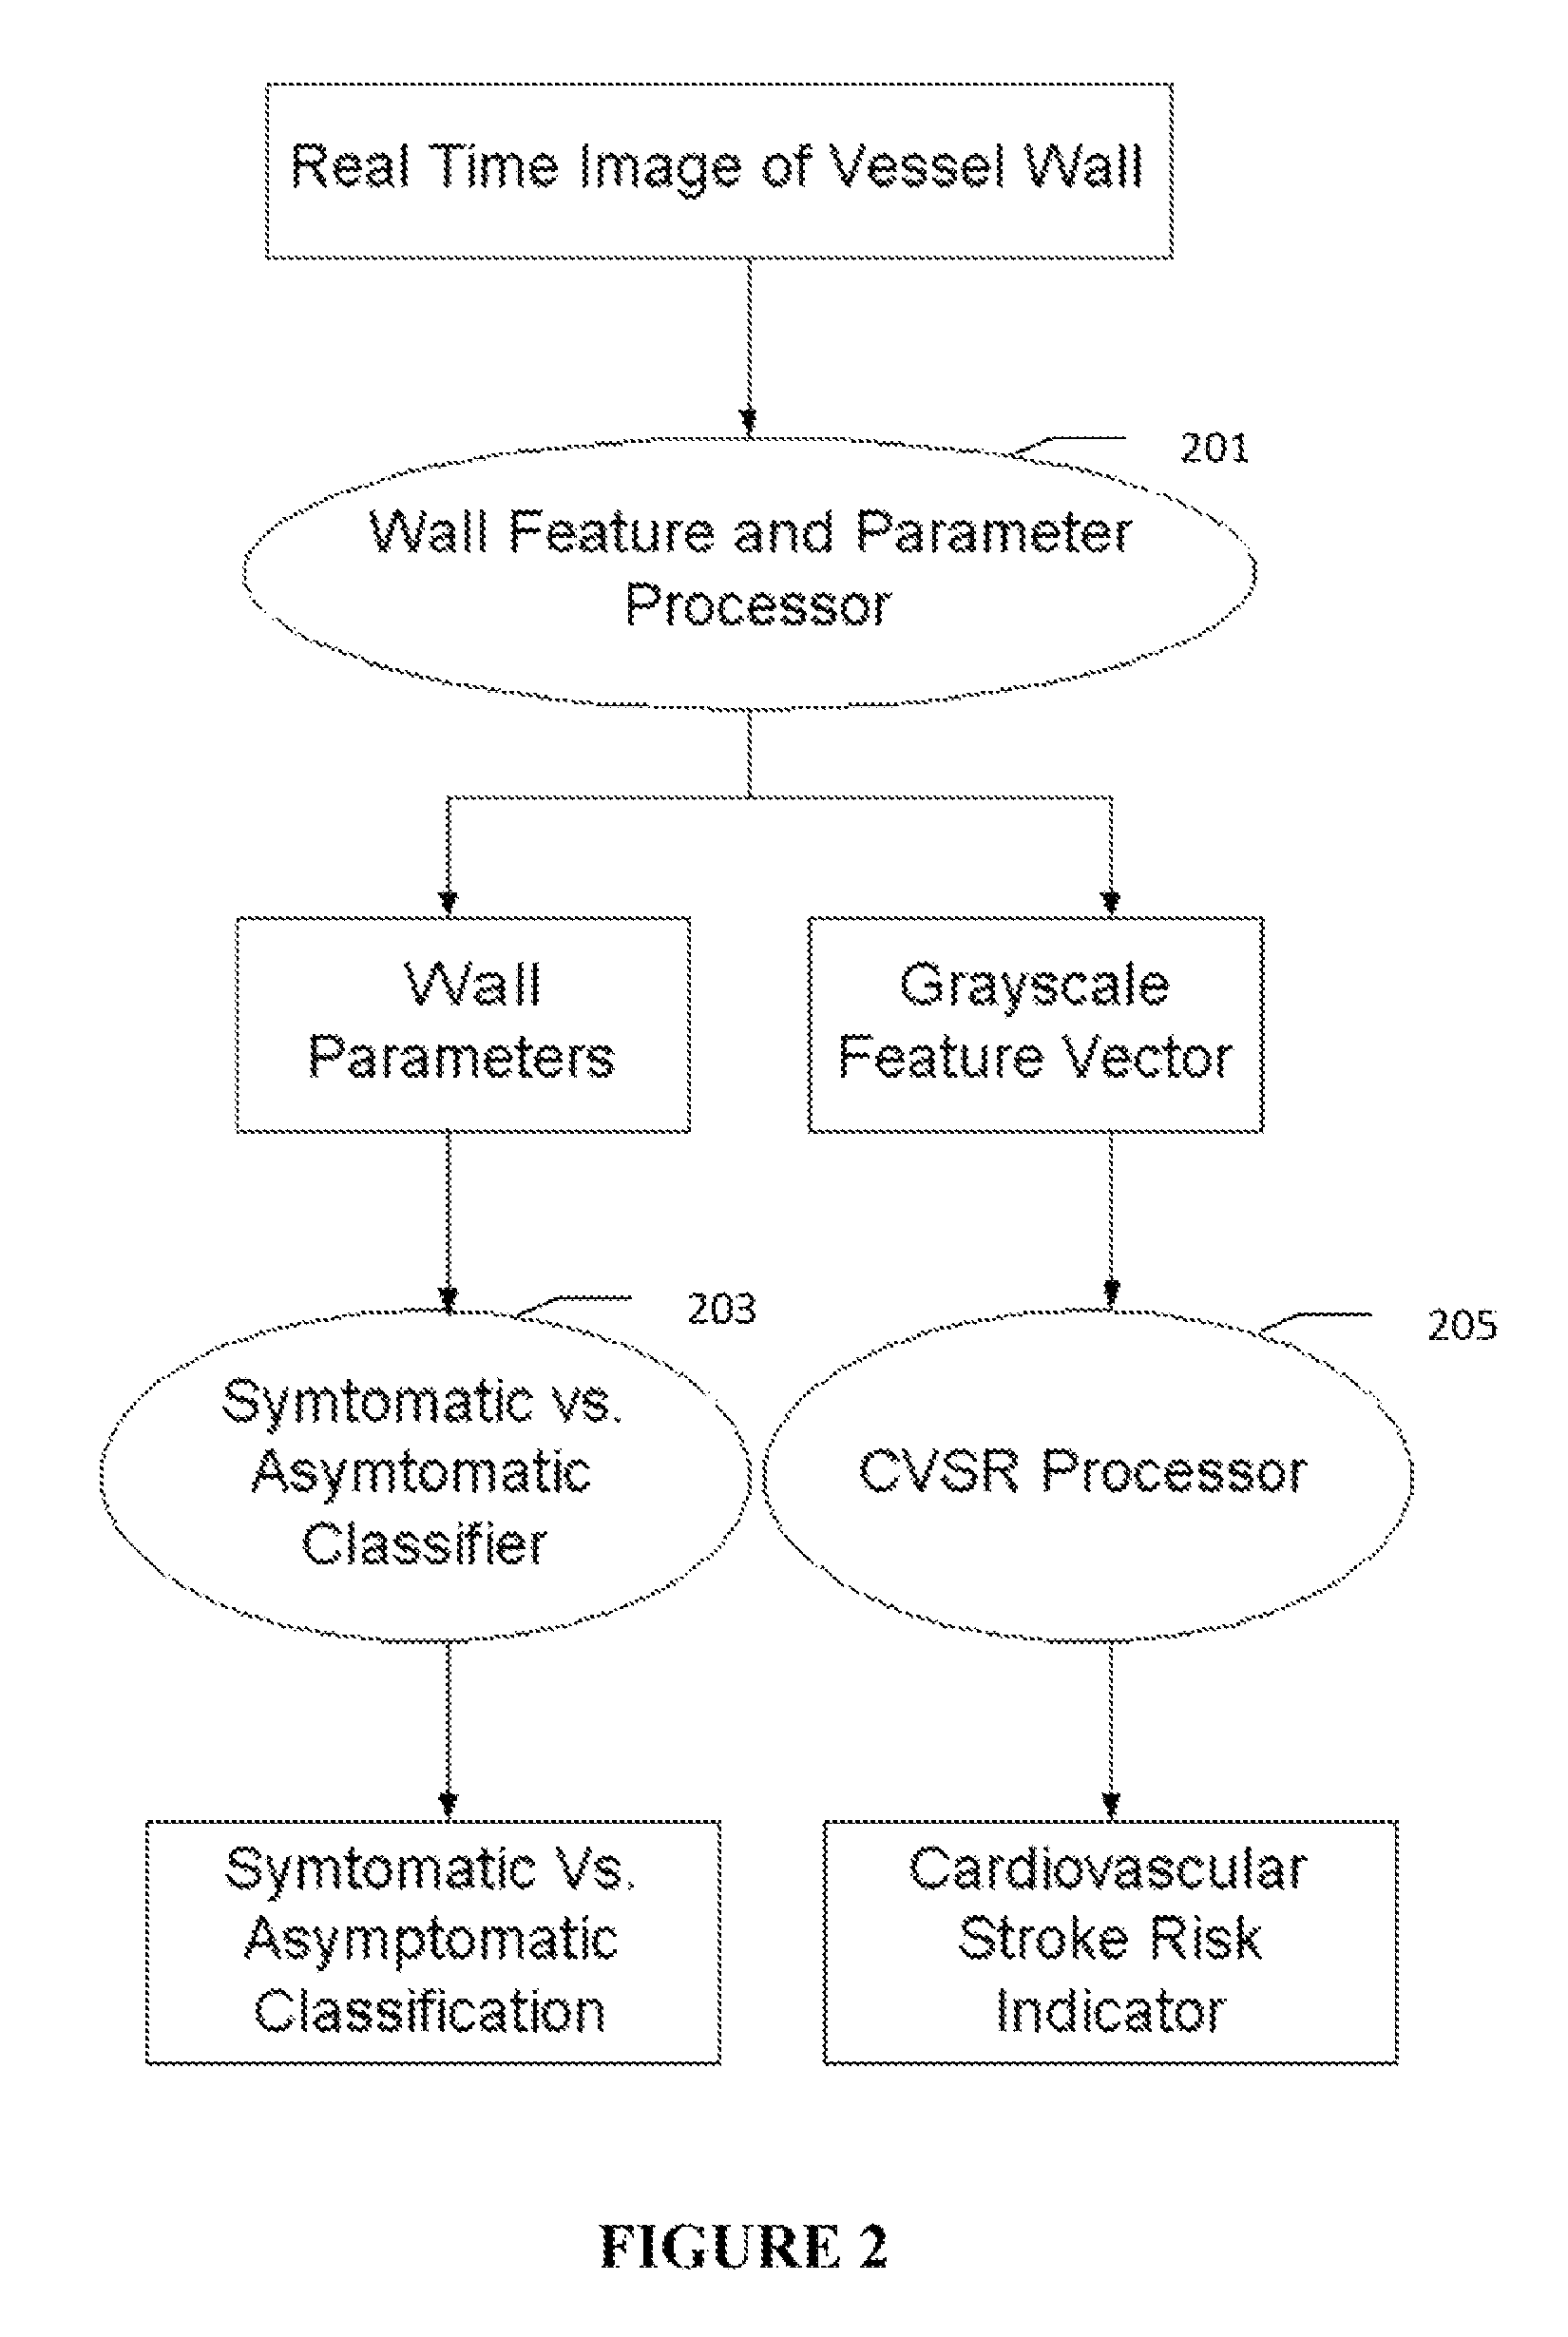
[0007]Atherosclerosis is a degenerative disease of the arteries that results in the formation of plaques, and consequent narrowing of blood vessels (stenosis). Characterization of carotid atherosclerosis and classification of plaque into symptomatic or asymptomatic along with the risk score estimation are key steps necessary for allowing the vascular surgeons to decide if the patient has to definitely undergo risky treatment procedures that are needed to unblock the stenosis. This application describes a (a) Computer Aided Diagnostic (CAD) technique for symptomatic versus asymptomatic plaque automated classification of carotid ultrasound images and (b) presents a cardiovascular risk score computation in longitudinal 2D Ultrasound, cross-sectional MR, CT and 3D Ultrasound and 3D IVUS. We show this for Ultrasound, CT and MR modalities and extendable to 3D Carotid Ultrasound and 3D IVUS.

[0008]The on-line system consists of Atherosclerotic Wall Region estimation using AtheroEdge™ (for l...


PUM


Abstract

Characterization of carotid atherosclerosis and classification of plaque into symptomatic or asymptomatic and risk score estimation are of clinical value. A statistical system is described for symptomatic versus asymptomatic plaque automated classification of carotid ultrasound images and cardiovascular risk score computation. The technique is applicable for the following types of modalities for carotids: 2D Ultrasound, 3D Ultrasound, CT, MR. Wall region is segmented and features are extracted consisting of type 1 combination consisting of: (a) Higher Order Spectra; (b) Discrete Wavelet Transform (DWT); (c) Texture and (d) Wall Variability; type 2 combination consisting of: (a) Local Binary Pattern; (b) Law's Mask Energy and (c) Wall Variability and type 3 combination: (a) Trace Transform; (b) Fuzzy Grayscale Level Co-occurrence Matrix and (c) Wall Variability. These features are trained using a training classifier on training images and the coefficients are applied to on-line test patient images. The system yields the cardiovascular risk score value using the feature combinations.

Description

PRIORITY APPLICATIONS[0001]This is a continuation-in-part patent application of co-pending patent application Ser. No. 12 / 799,177; filed Apr. 20, 2010 by the same applicant. This is also a continuation-in-part patent application of patent application Ser. No. 12 / 802,431; filed Jun. 7, 2010 now U.S. Pat. No. 8,313,437 by the same applicant. This is also a continuation-in-part patent application of co-pending patent application Ser. No. 12 / 896,875; filed Oct. 2, 2010 by the same applicant. This is also a continuation-in-part patent application of co-pending patent application Ser. No. 12 / 960,491; filed Dec. 4, 2010 by the same applicant. This is also a continuation-in-part patent application of co-pending patent application Ser. No. 13 / 053,971; filed Mar. 22, 2011 by the same applicant. This is also a continuation-in-part patent application of co-pending patent application Ser. No. 13 / 077,631; filed Mar. 31, 2011 by the same applicant. This is also a continuation-in-part patent applic...

Claims


Application Information

Patent Timeline
Patent Type & Authority Patents(United States)
IPC IPC(8): G06K9/00A61B5/05
CPCA61B8/0891A61B8/483G01R33/5608A61B8/12
Inventor SURI, JASJIT S.
Owner ATHEROPOINT
Why Eureka
Try Eureka