
Optimised region of interest selection

a region of interest and selection technology, applied in the field of selection of regions of interest, can solve the problems of difficult comparison of large subject groups, low reliability of inter/intra observer, and difficulty in fundamental voxel correspondence, and achieve the effect of reducing the sample siz

Active Publication Date: 2013-09-17
BIOCLINICA
View PDF6 Cites 1 Cited by
  • Summary
  • Abstract
  • Description
  • Claims
  • Application Information

AI Technical Summary

Benefits of technology

This patent describes a method for identifying a specific part of an image called a region of interest (ROI). The method uses a computer program that calculates a weighted map of the image, where the weights at each location in the map are minimized to distinguish a first group of examples from a second. This is done by computing a function that measures the smoothness of the weighted map at each location and applying a penalty term to penalize any spatial variation in the image. The method can be implemented using a computer software program. The technical effects of this patent are an improved accuracy and efficiency in identifying specific parts of an image, which can be useful in various applications such as object recognition or image analysis.

Problems solved by technology

However, due to the manual segmentation task, these methods are labor-intensive and therefore typically focus on a limited number of ROIs.
The time and cost involved in the manual segmentation task also makes it difficult to compare large subject groups.
Another important problem is that often it is not obvious how to define the subregions that are optimal for the ROI analysis meaning that inter / intra observer reliability might be low.
These techniques, however, are based on voxel-by-voxel statistical comparisons where it is assumed that each voxel represents the same anatomical position across all the images, and Bookstein (Bookstein, 2001) pointed out that imperfect registration might lead to interpreting the results as a characteristic of the disease, while in fact this effect might be caused by misalignment of the images.
Although smoothing can help alleviate mis-registration, the fundamental voxel correspondence problem still remains challenging.
A drawback of these methods is that they do not consider prior information, such as the anatomical neighbourhood relationship of a particular voxel.
Without prior information, the ROI problem is combinatorial and therefore, finding an optimal solution requires an exhaustive search, which makes the problem computationally intractable.

Method used


Image

  • Optimised region of interest selection
  • Optimised region of interest selection
  • Optimised region of interest selection

Examples


Embodiment Construction

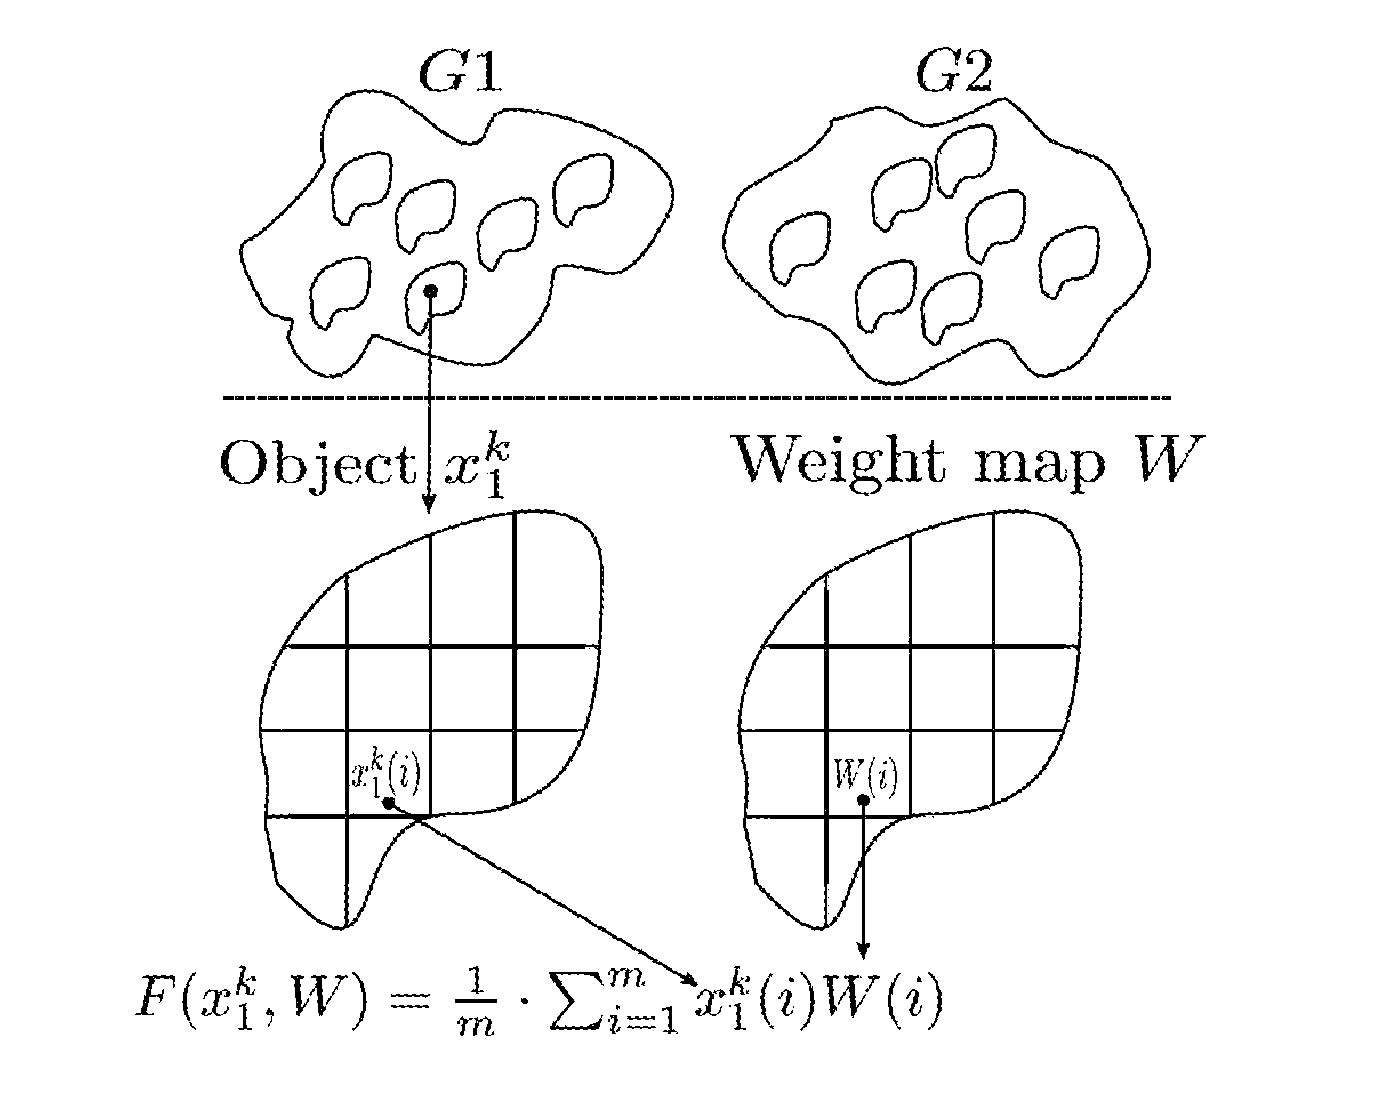
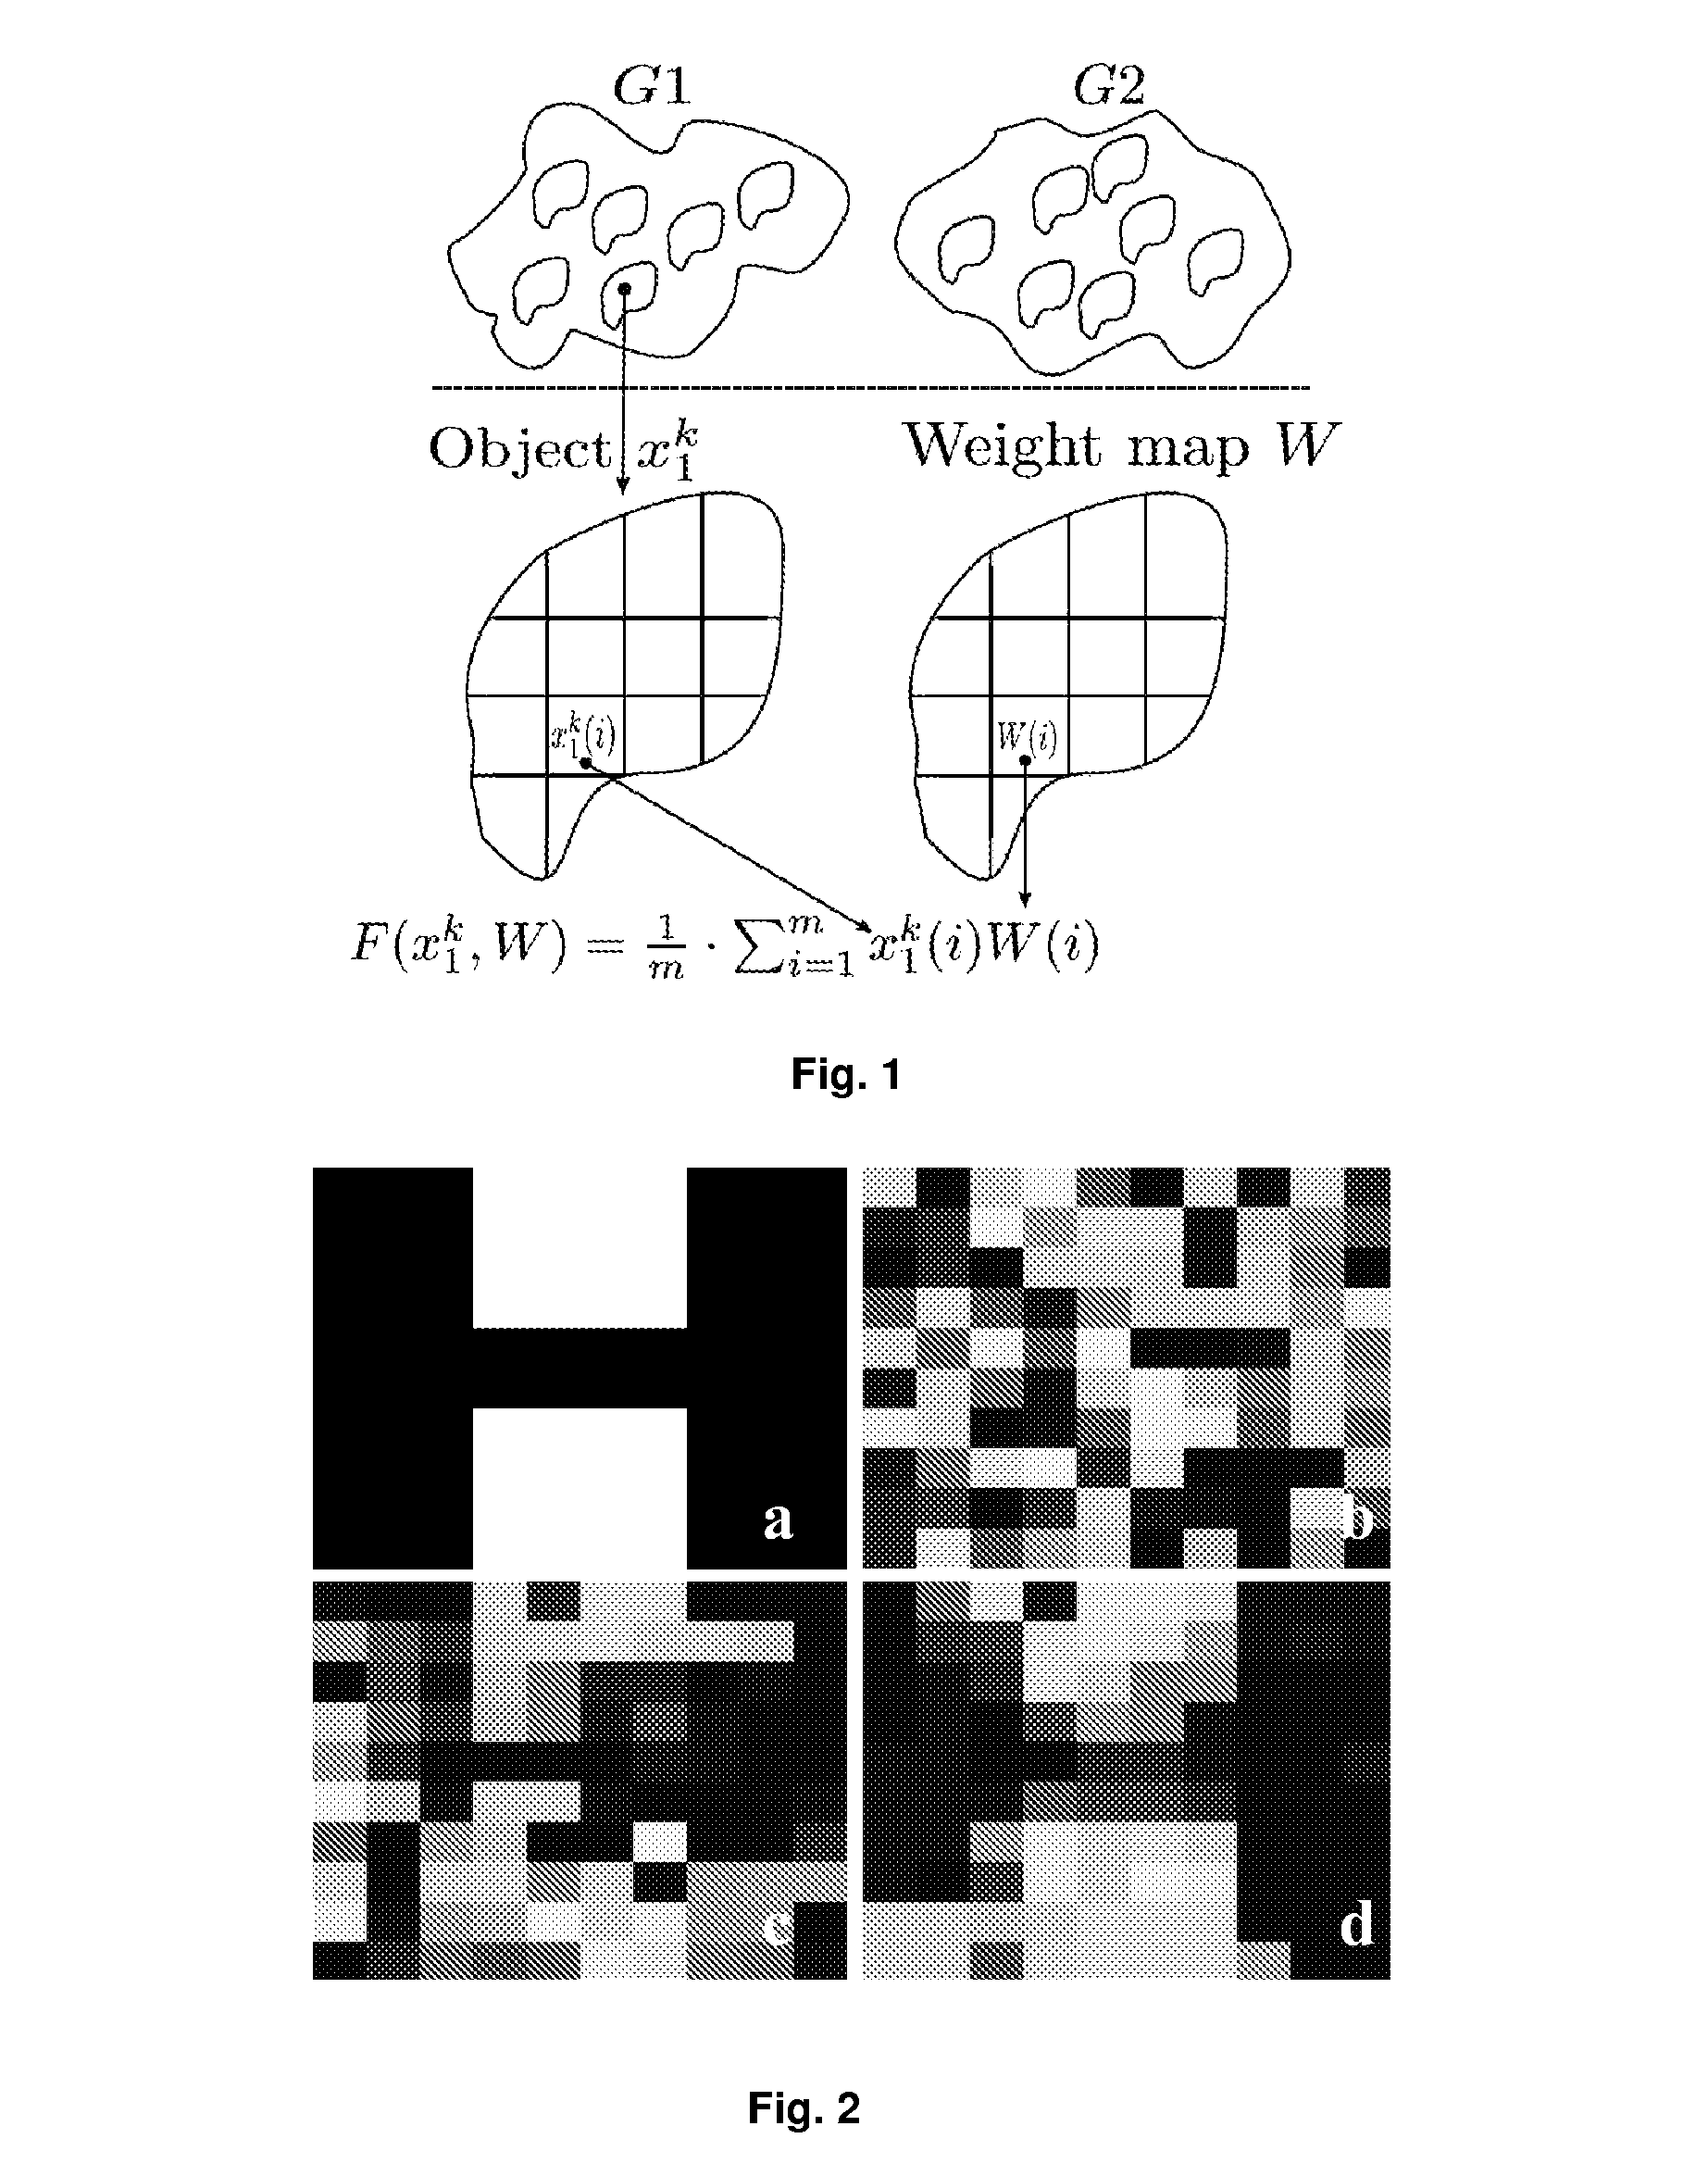
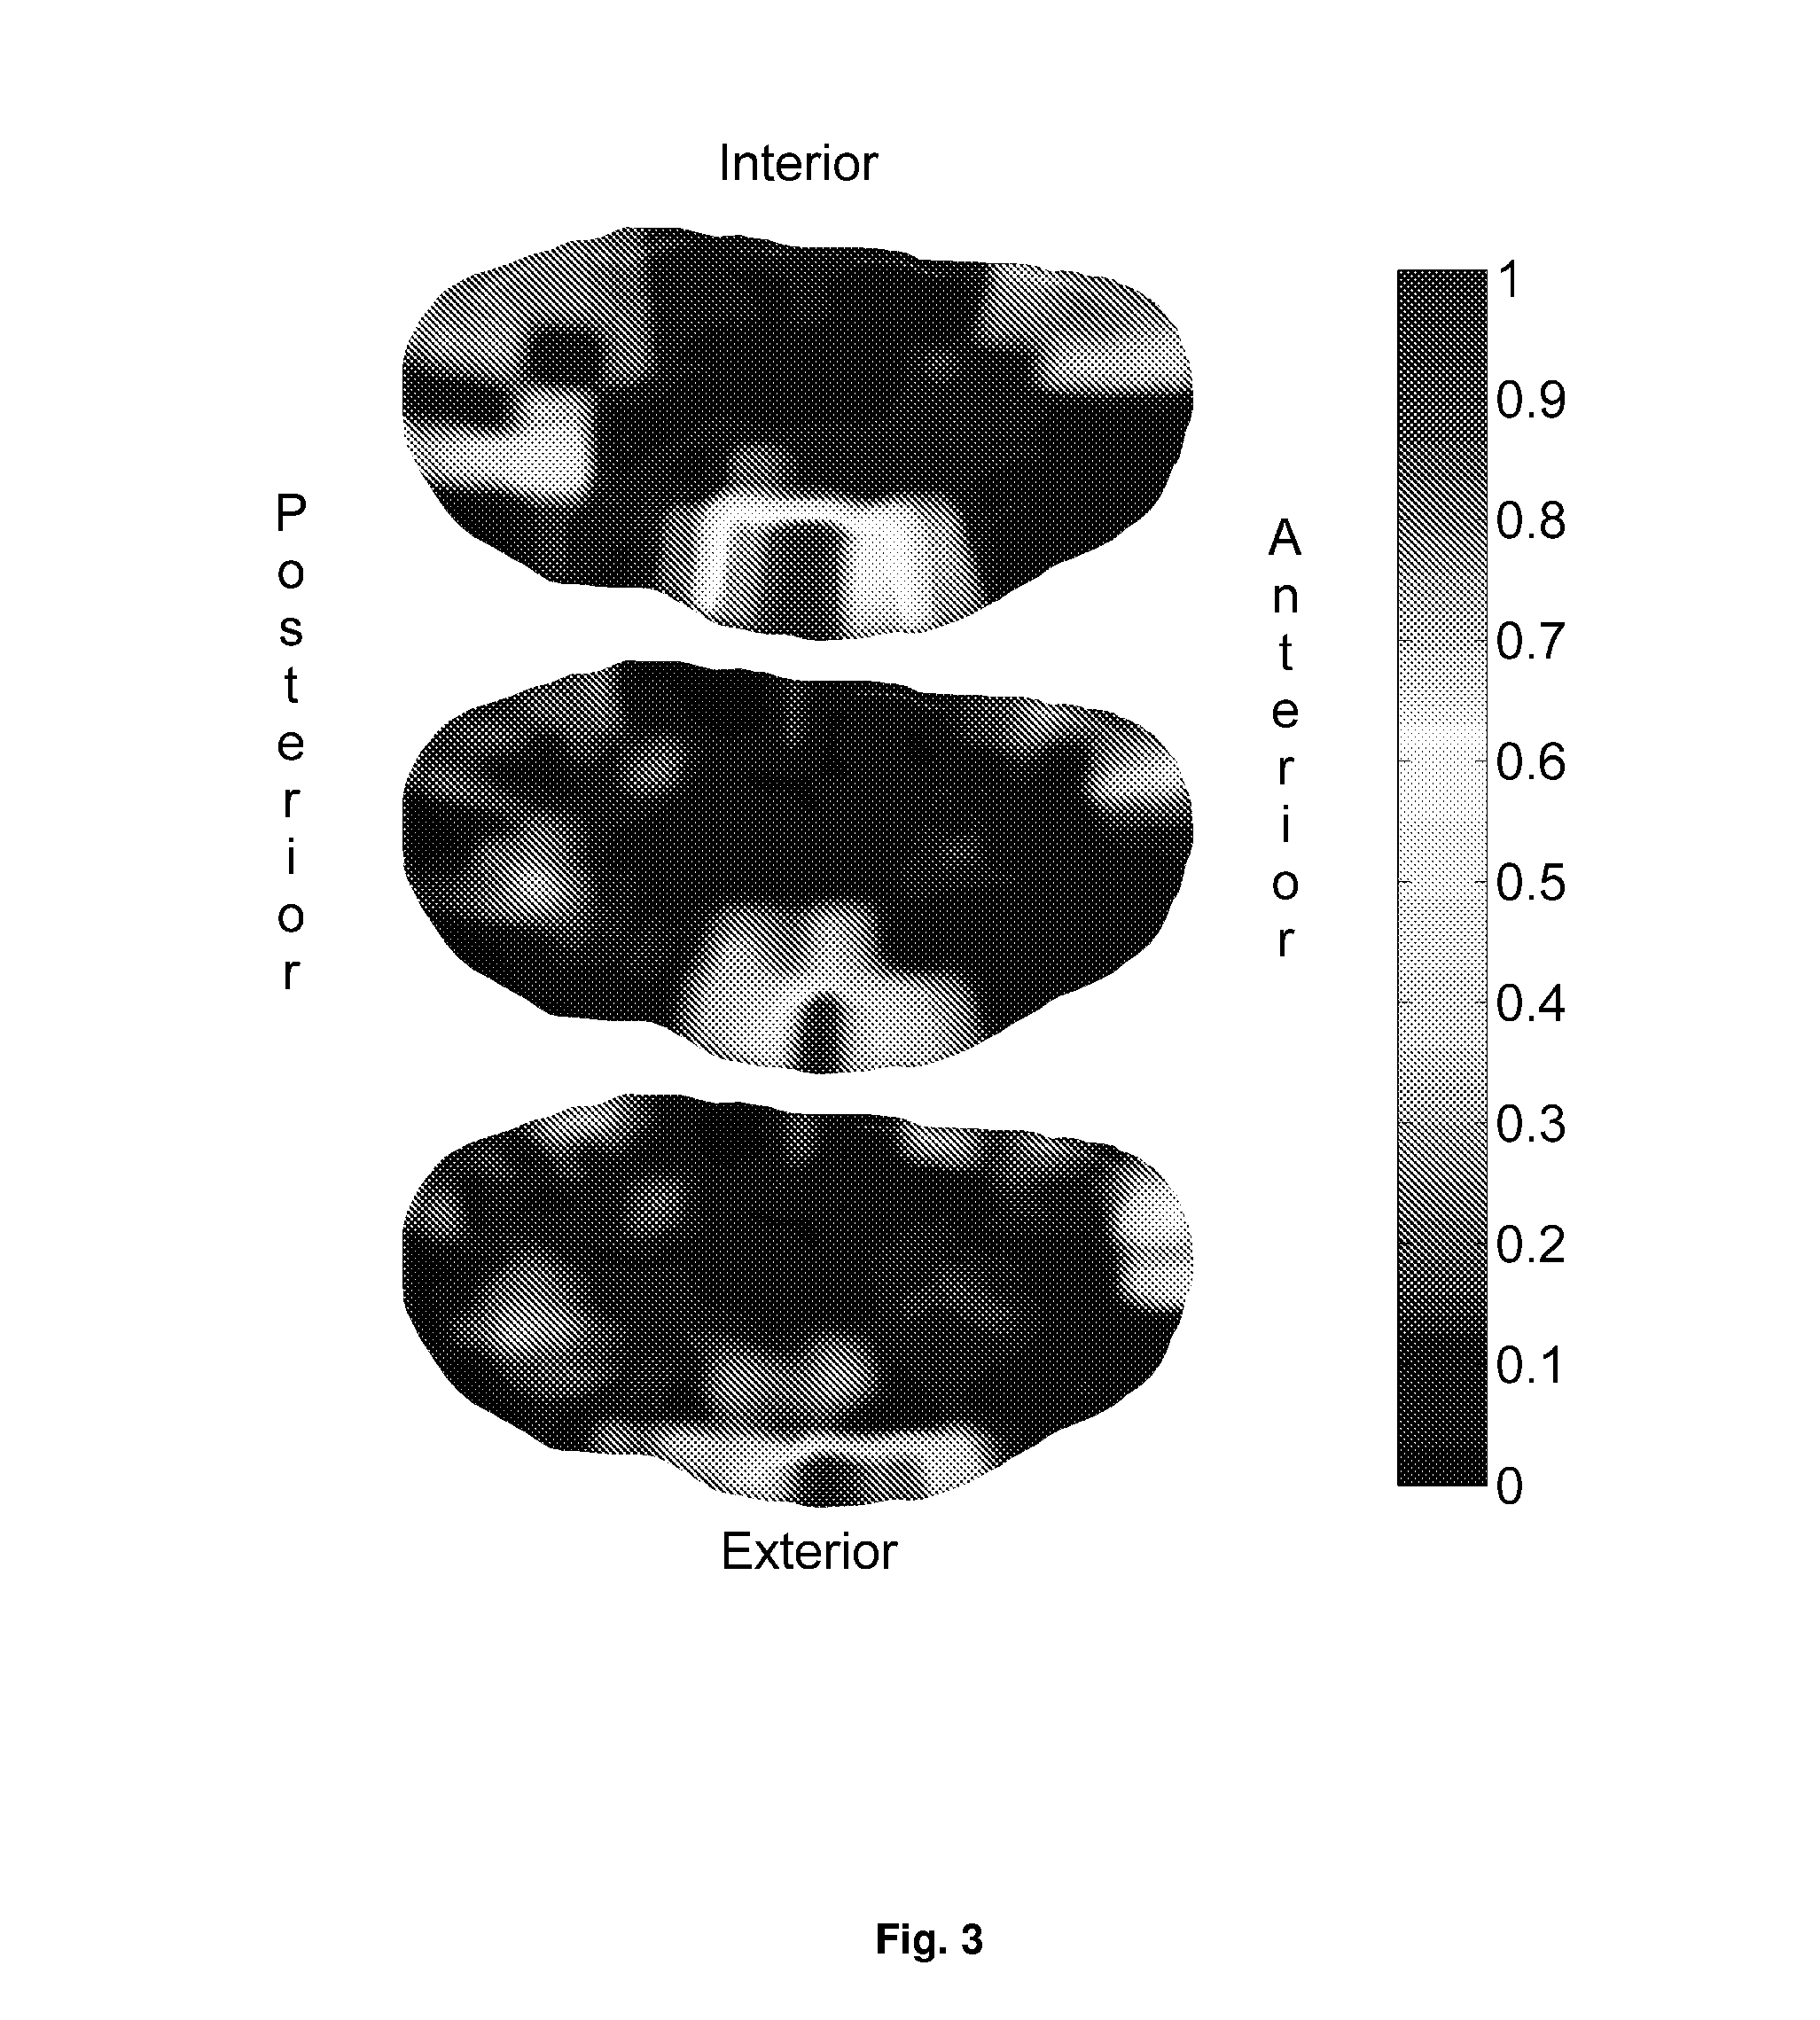
[0033]This invention utilises a novel methodology, having statistical underpinnings and incorporating prior knowledge of neighborhood relationships between features, for finding the most discriminative regions between patient groups. We formulate the problem in a smooth optimization scheme that minimizes the sample size required to discriminate two groups. For quantification methods that are to be used in clinical studies, the sample size is a crucial and specific end goal to optimize rather than more generic measures, such as classification accuracy. The sample size estimation determines the number of study participants and thereby the study feasibility and cost (and the patient burden). Given spatially normalized feature maps from objects belonging to two groups, the output of the method is a non-negative, real-valued weight map, where each weight reflects the local importance of the feature in separation of the two groups. We use the terms ‘soft regions’ or ‘areas’ to reflect the...


PUM

PropertyMeasurementUnit
flip angleaaaaaaaaaa
weightsaaaaaaaaaa
weightaaaaaaaaaa

Abstract

A statistical framework for identifying regions of discrimination between two groups of imaged objects involves determining a weight map defining the regions of discrimination by minimizing the sample size required to discriminate the two groups in a numerical optimization scheme.

Description

RELATED APPLICATION[0001]This application claims the benefit of U.S. provisional application Ser. No. 61 / 203,094, filed Dec. 17, 2008, the entire disclosure of which is incorporated herein by reference.BACKGROUND OF THE INVENTION[0002]The present invention relates to selecting a region of interest for use in extracting useful information from one or more images.[0003]Identification of the most affected regions relating to physiological changes in a human organ can help in capturing the dynamics of the underlying pathology. For example, it is known that the articular cartilage undergoes morphometric changes during osteoarthritis (Eckstein et al., 2006). Characterization of the regions that best discriminate the healthy and the diseased can be used to reduce the sample size in clinical studies which is desirable since this translates into reduced costs and less patient burden. By studying the important regions it may also be possible to find clues about the pathophysiology of the dise...

Claims


Application Information

Patent Timeline
Patent Type & Authority Patents(United States)
IPC IPC(8): G06K9/00G01N23/06G06V10/771
CPCG06K9/623G06K9/6234G06K2209/05G06V2201/03G06V10/771G06F18/2113G06F18/2132
Inventor DAM, ERIK B.NIELSEN, MADSQAZI, ARISHLILLHOLM, MARTINJORGENSON, DAN RICHTER
Owner BIOCLINICA
Learn More