Method and system for monitoring and analyzing energy consumption in operated chemical plants

a technology of energy consumption and chemical plant, applied in the direction of testing/monitoring control system, process and machine control, instruments, etc., can solve the problems of inability to apply the method proposed by the prior art, inability to control, and general comparison of assessment methods to achieve the effect of reducing energy consumption

Active Publication Date: 2013-10-08
COVESTRO DEUTSCHLAND AG
View PDF8 Cites 4 Cited by
  • Summary
  • Abstract
  • Description
  • Claims
  • Application Information

AI Technical Summary

Benefits of technology

[0027]Furthermore, according to a further implementation, the step of periodically graphing the energy consumption of the at least one plant via a bar graph starting from the plant type specific theoretical energy consumption optimum value and getting up as an energy cascade to a current energy consumption of the at least one plant by adding the provided, partly retrieved single rates of the respective parameters in groups comprises a periodically still more often repeated re-graphing of the rates of the dynamic parameters associated with the operating conditions of the plant. That means that particularly the dynamic operating conditions of the plant are monitored in shorter time intervals than the rest of the other influencing factors. This shorter time interval is to be chosen in dependence on experienced data with respect to the fluctuation of the respective operating conditions. A monthly, daily or even shorter monitoring and thus a monthly, daily or correspondingly shorter re-graphing of exactly those corresponding parameters in the energy cascade might be appropriate. Such an online monitoring ensures sustainability of operational improvements.
[0070]A particularly lasting reduction in energy consumption is made possible by the fact that the steps of periodically graphing the energy consumption of the at least one plant via a bar graph starting from the plant type specific theoretical energy consumption optimum value and arriving at an energy cascade to a current energy consumption of the at least one plant by adding the provided, partly retrieved single rates of the respective parameters in groups and forming an energy cascade comprises a periodically still more often repeated re-graphing of the rates of the dynamic parameters associated with the operating conditions of the plant. The repetition of the graphing of the rates as a whole after a time interval, in particular at the latest after a year, makes it possible to check whether measures have been implemented correctly. Secondly, the effectiveness of those measures for reducing the respective energy consumption rates and the achievement of best practice can be checked and a suitable reporting form is chosen for the respective level of management involved in the reporting and analysis.

Problems solved by technology

Comparative assessment methods are limited generally to the comparison of similar facilities.
In the case that there are no similar facilities or the respective data are not available, the method proposed by the prior art cannot be applied.
A control not quite possible because every activity is to be evaluated individually.
Moreover, not every activity is accessible by the respective central management.
An objective prioritization and tracking of different factors over a longer period of time is only hard to achieve.
Generally, numerical values obtained by a so-called per gap analysis or benchmarking are useful, but do not allow per se an improvement of a such numbered improvement potential since the relevance of the numerical difference can generally not be made visible.
However, he often does not overview the complexity of parameters influencing each other in every operative status of the facility in order to implement thereon an overall comprehensive improvement management.
Moreover, no present system currently allows to distinguish windfall gains, such as energy savings by production rates, from sustainable gains, which usually denote an overall efficiency improvement and which are the achievements which have to be recognized and then managed to become sustainable achievements.

Method used


Image

  • Method and system for monitoring and analyzing energy consumption in operated chemical plants
  • Method and system for monitoring and analyzing energy consumption in operated chemical plants

Examples


Embodiment Construction

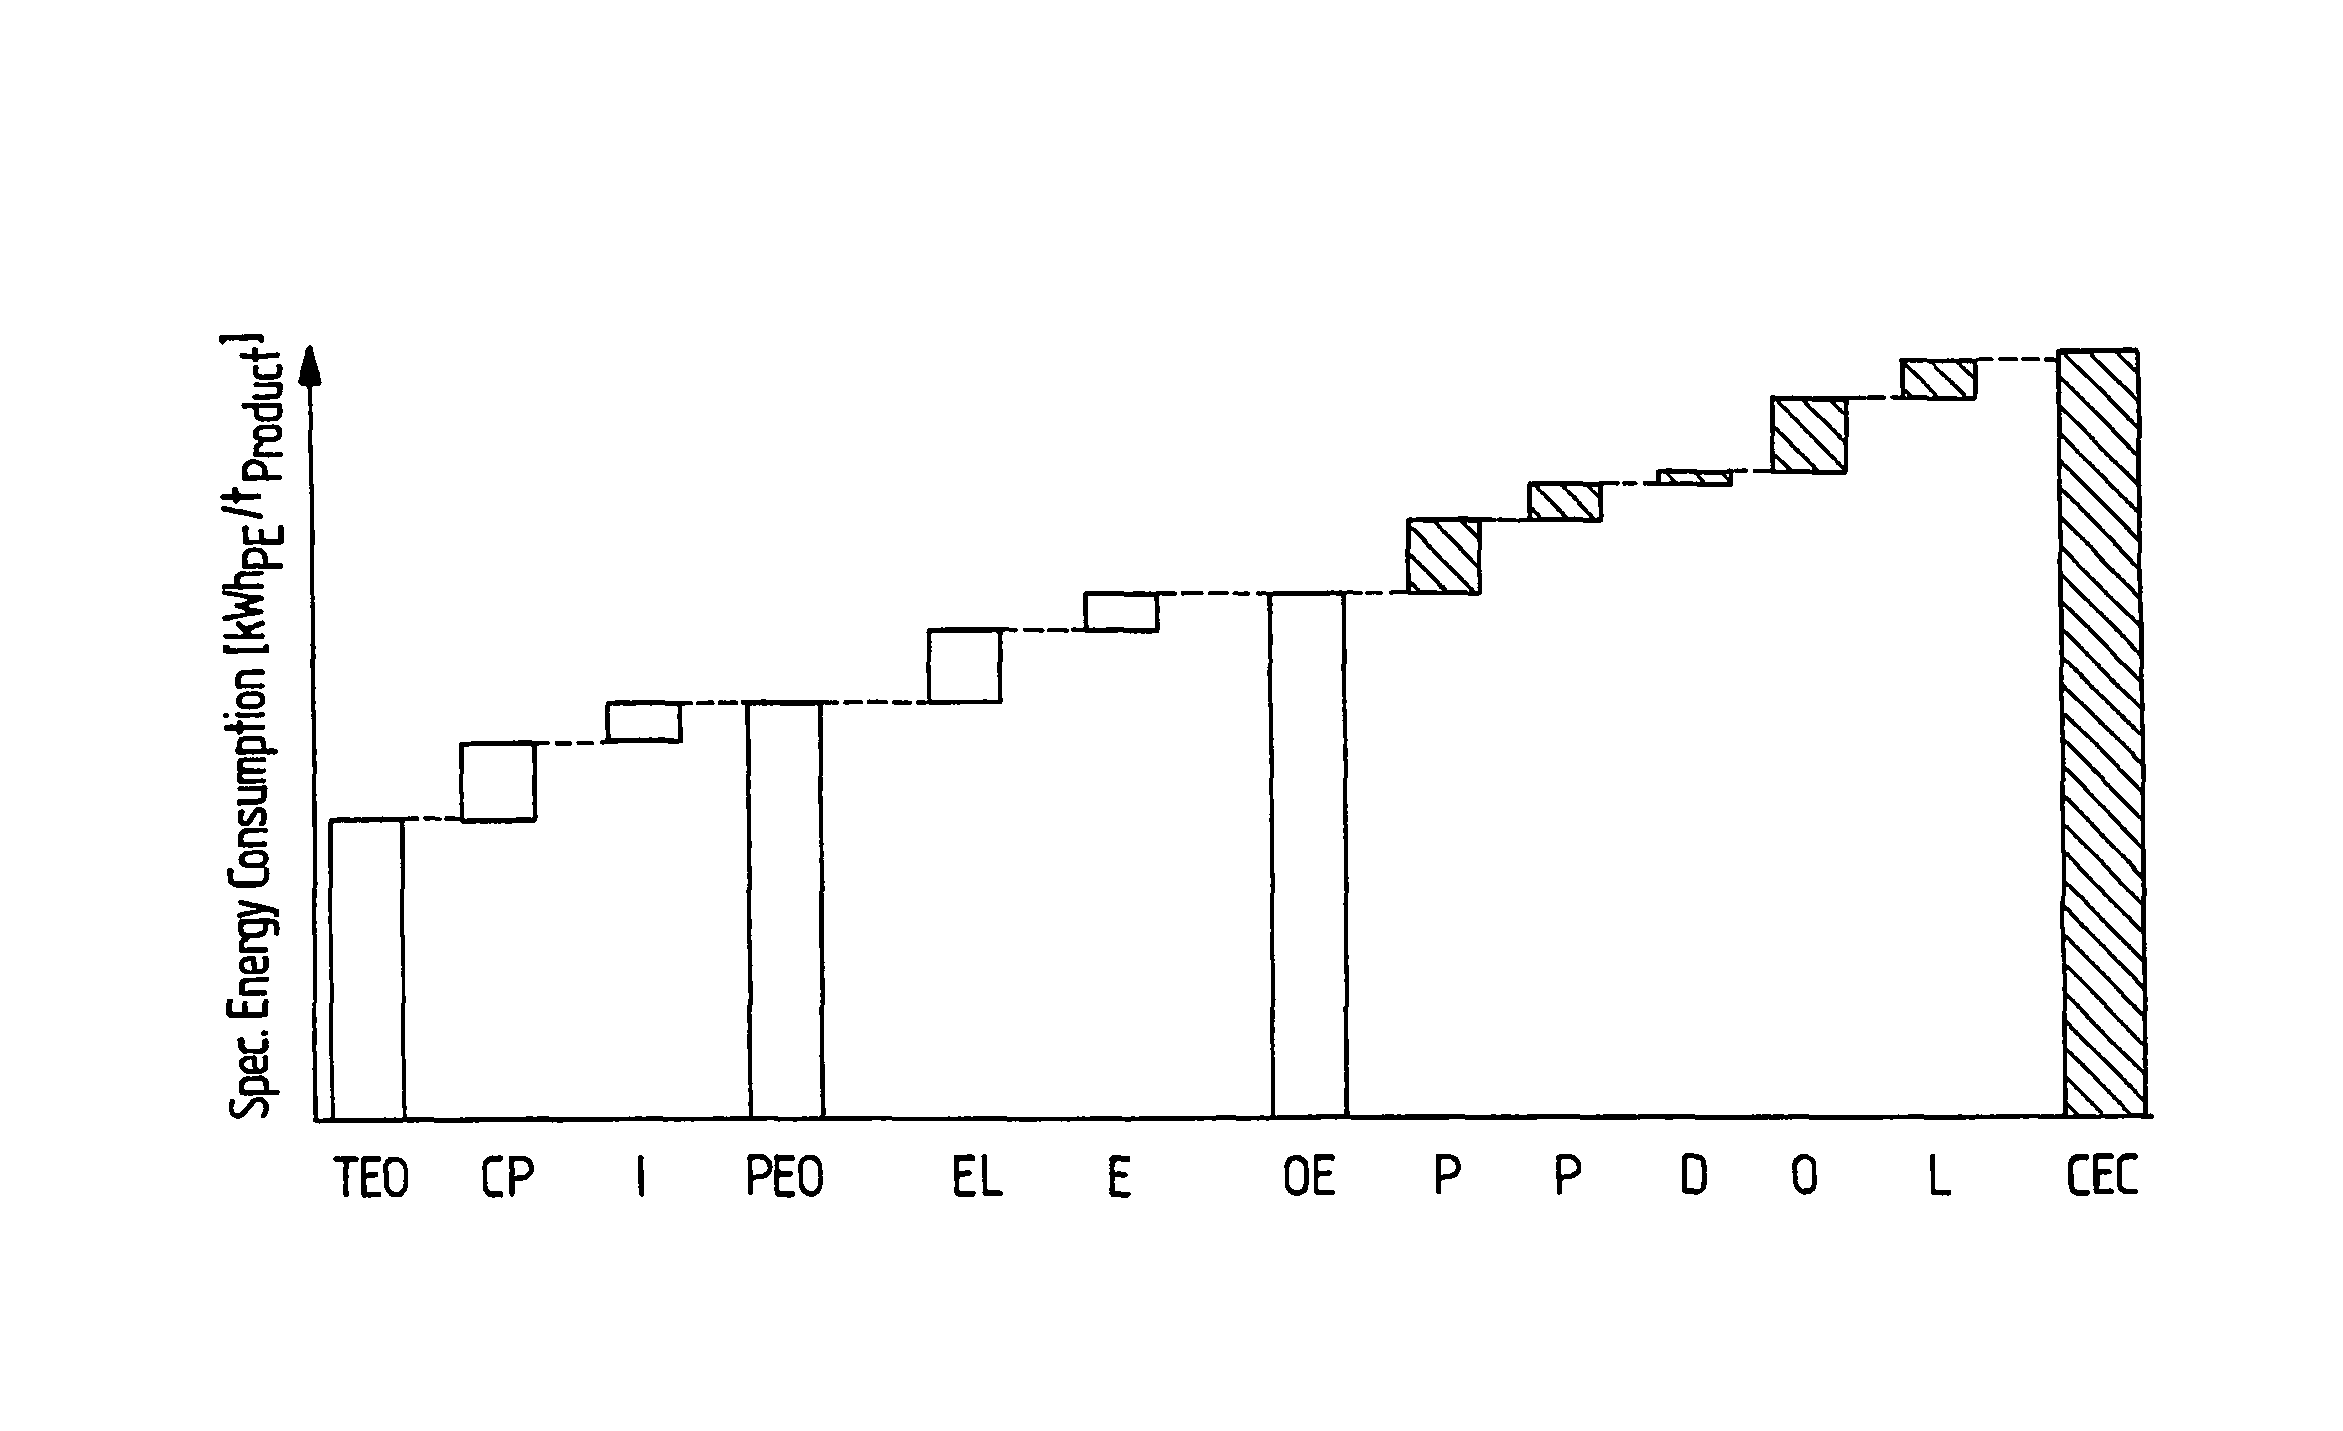
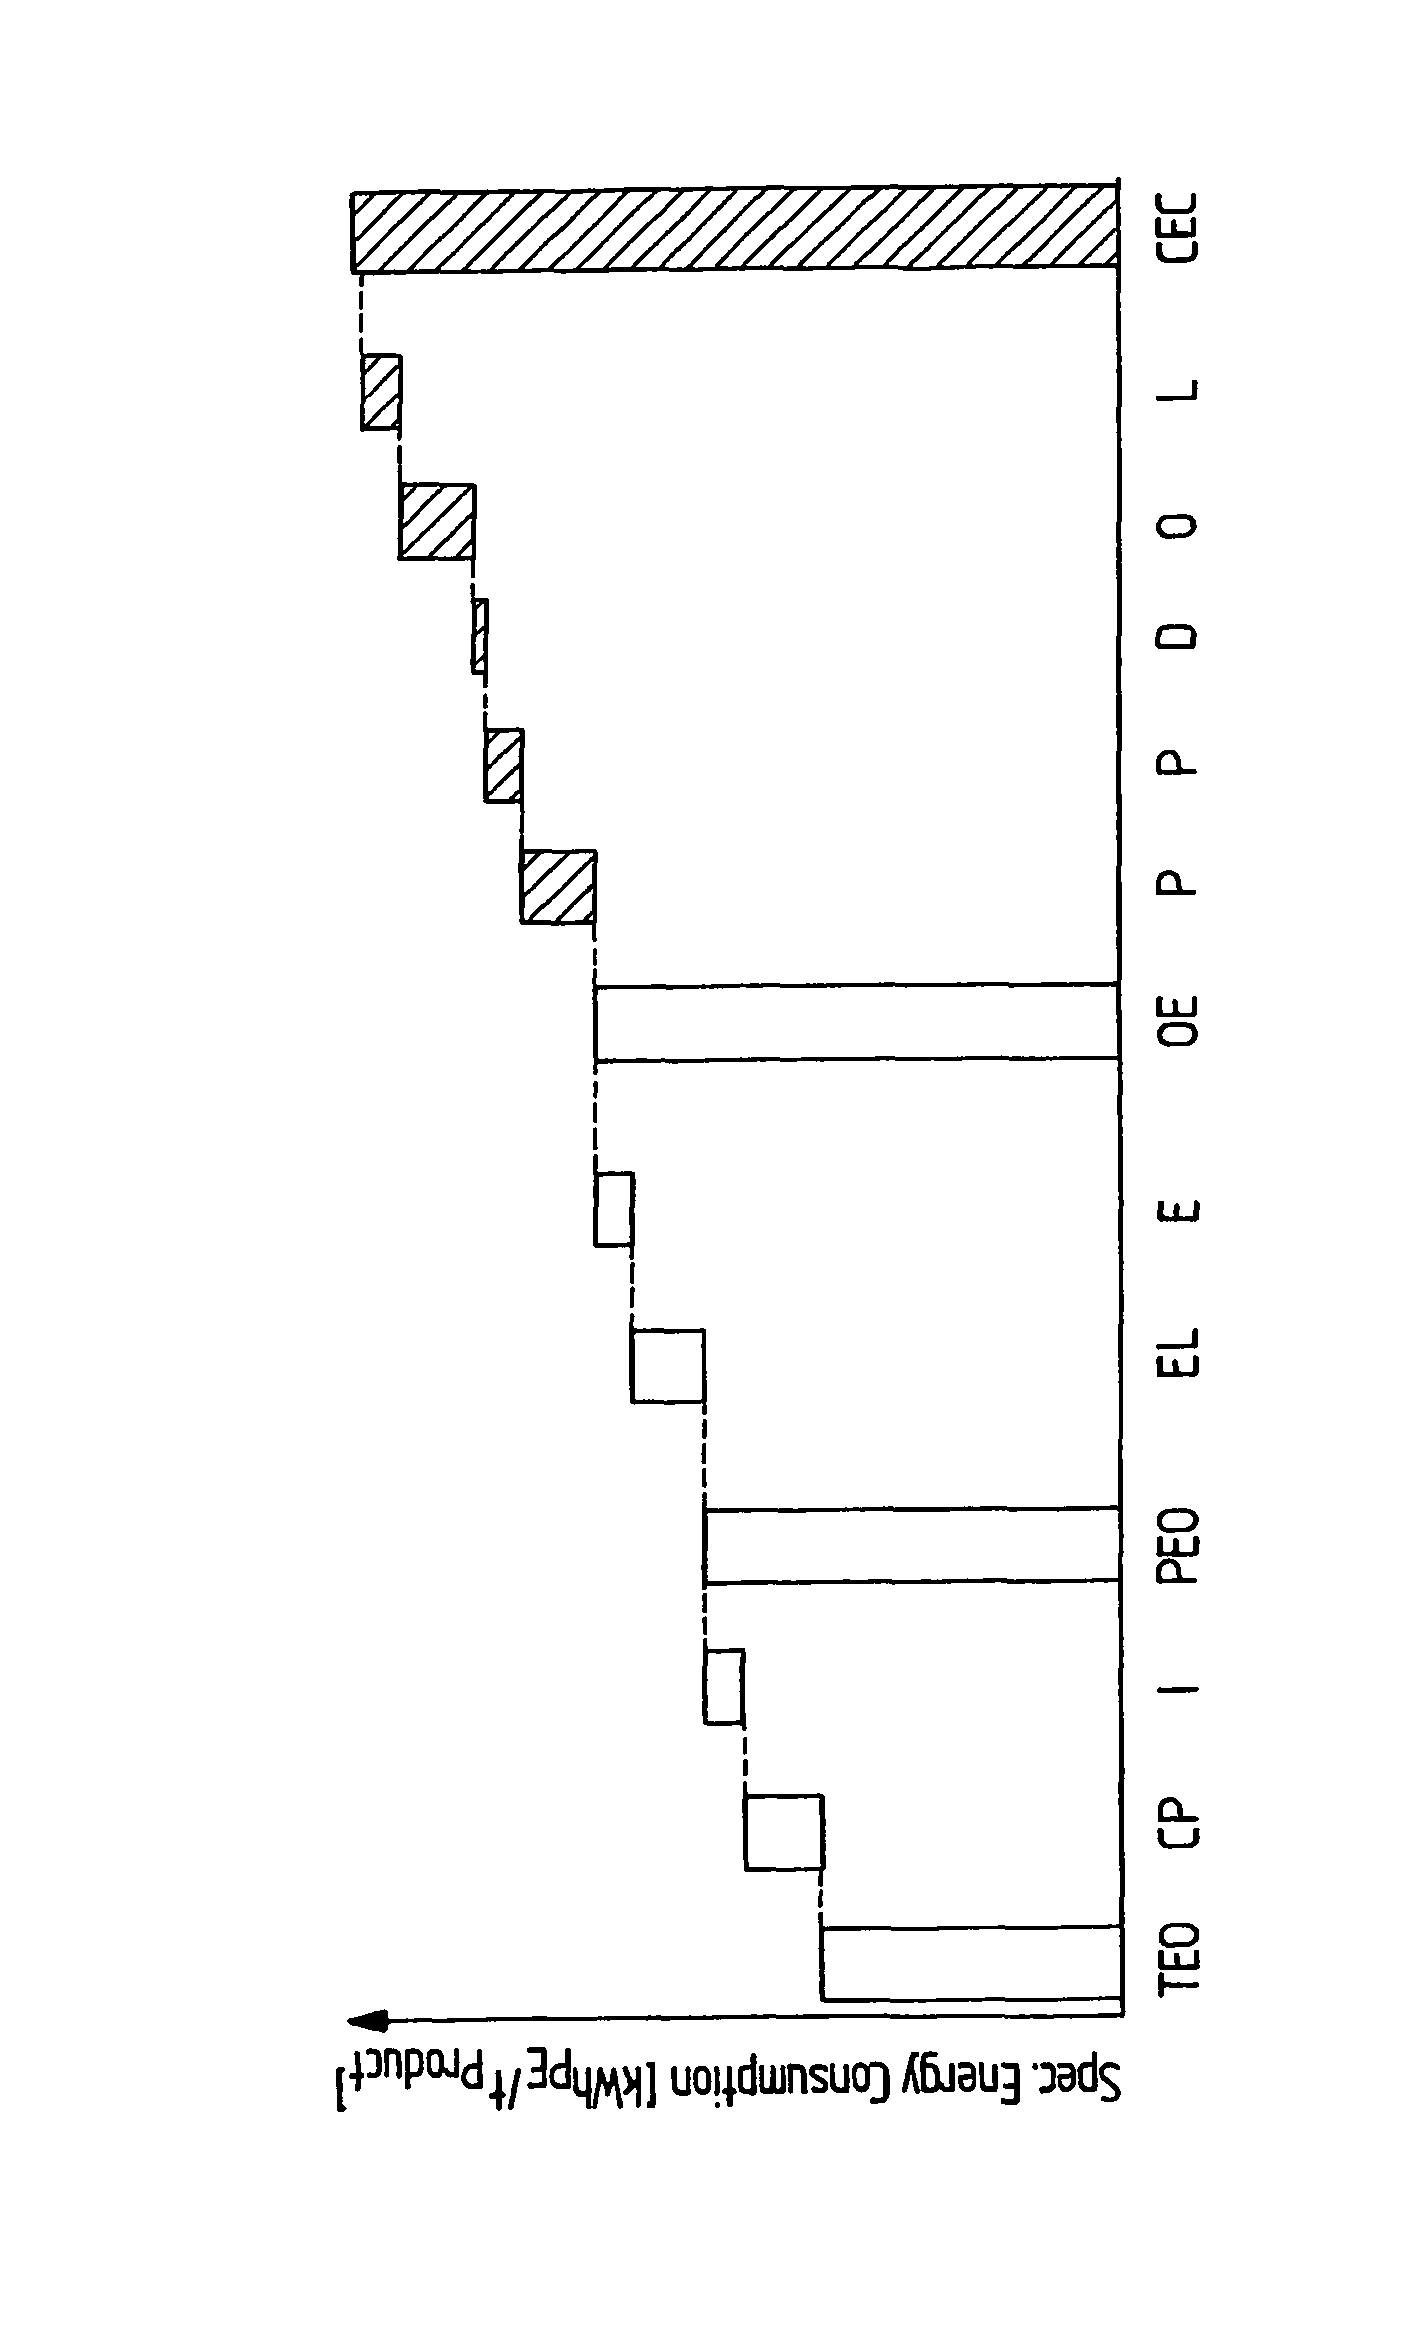
[0074]FIG. 1 shows a schematic presentation of an energy loss cascade as provided by an implementation of the proposed method for monitoring and analyzing energy consumption of an operated chemical plant. The energy cascade as shown in FIG. 1 is represented as a bar graph starting from a theoretical energy consumption optimum value TEO and getting up as an energy cascade to a current energy consumption CEC of the underlying operated chemical plant by adding afore-provided, partly afore-retrieved single energy consumption rates of respective afore-identified parameters in groups. The parameters contributing to an increased energy consumption of the plant with respect to the plant type specific theoretical energy consumption optimum value TEO are first identified and grouped accordingly with respect to their corresponding origin. The energy consumption is shown in FIG. 1 as a specific energy consumption in terms of kWhPE / tproduct, wherein the index PE stands for Primary Energy. In the...


PUM


Abstract

A computer-implemented method for monitoring and analyzing energy consumption of a chemical plant in operation. Plant type specific theoretical energy consumption optimum value based on a corresponding modeled plant are determined, parameters contributing to increased energy consumption are identified and grouped. Energy consumption of a plant is periodically graphed starting from the theoretical energy consumption optimum value and getting up as an energy cascade to a current energy consumption, by adding the provided, partly retrieved single energy consumption rates of the respective parameters in groups such that the resulting energy cascade allows to monitor at least a part of the individual parameters and to automatically compare the current energy consumption of the at least one plant with an energy consumption of another plant and / or with a previous energy consumption of the at least one plant with respect to the individual parameters. Furthermore, an appropriate system is provided.

Description

BACKGROUND OF THE INVENTION[0001](1) Field of the Invention[0002]The present invention relates to a method and system for monitoring and analyzing energy consumption in operated chemical plants.[0003](2) Description of Related ArtBACKGROUND[0004]U.S. Pat. No. 4,146,923 describes a system for controlling a plurality of variable rate consuming units using a unique sequence to optimize the number of units on and the total consumption of the units relative to a target by increasing and decreasing total consumption from a status position in said sequence in response to a comparison of the total consumption of all units with a target and to a comparison of the total consumption with the target minus the differential consumption to the next step from the status position in the unique sequence. The units' status and the results of the comparisons address a device storing that unique sequence to provide a consumption requested status which may be overwritten by a cycling means to provide a m...

Claims


Application Information

Patent Timeline
Patent Type & Authority Patents(United States)
IPC IPC(8): G05D11/00G01M99/00
CPCG05B23/0243G05B23/0294Y02P90/82
Inventor BISCHOF, ERICEICKMANS, JOHANNESPARG, ROLANDJUPKE, ANDREASKAHNIS, HENNINGCONRAD, ANNETTEKUVER, ANDREAS
Owner COVESTRO DEUTSCHLAND AG
Why Eureka
Try Eureka