Method for quantifying peaks in an analytical signal

a technology of analytical signals and quantification methods, applied in the field of quantification methods of analytical signals, can solve the problems of inability to accurately quantify analytes, inability to accurately predict the shape of real peaks, so as to facilitate optimization of peak quantification methods, reduce the chance of quantification errors occurring, and improve the robustness of process monitoring

Active Publication Date: 2013-12-10
SIEMENS AG
View PDF0 Cites 2 Cited by
  • Summary
  • Abstract
  • Description
  • Claims
  • Application Information

AI Technical Summary

Benefits of technology

[0007]It is therefore an object of the present invention to facilitate optimization of a peak quantification method including optimizing the parameters of a peak analysis methodology, thereby reducing the chance of quantification errors occurring when the optimized peak quantification method is used during subsequent calibration and sample analyses, and to improve runtime robustness in process monitoring.
[0009]Thus, before applying the peak analysis methodology to a modified signal to quantify the peaks in the signal, random noise is added to the analytical signal and / or the signal is shifted within an interval under consideration. The step sequence of noise addition and / or signal shift and peak quantification may be repeated multiple times with different noise and / or a different amount and / or direction of shift added or applied each time to the originally recorded signal. The noise-addition methodology and signal-shift methodology can be used either alone or together as needed. A subsequent statistical evaluation of the peak quantification results from the multiple repeated peak analyses of the original and modified signals is used to detect an occurrence of and to reduce a chance of a possible error in the peak quantification that needs to be alarmed or addressed.

Problems solved by technology

These derivatives of the analytical signals are inherently sensitive to noise and signal shifts, especially when low signal-to-noise ratio (S / N) signals are involved.
Real peaks often have poor shapes, such as tailing, fronting, split peaks and / or shouldered peaks.
Consequently, a peak analysis algorithm often requires optimization of a set of algorithm parameters to permit adaption of the algorithm to different peak shapes, which is also often sensitive to noise and shifts in a “raw” signal.
Thus, the natural presence of noise and / or signal shifts in analytical signals often interferes with quantification of the peaks, which causes inaccurate, imprecise, and sometimes erroneous quantification of the analytes corresponding to these peaks.
In a laboratory environment, it may be feasible, albeit expensive or tedious, for an experienced user to manually inspect the results of peak quantification for serious errors caused by such interference.
However, the consequence of this interference is often more serious in a continuous and unattended process monitoring environment, where erroneously reported results may require expensive manual inspections of the monitored process, and may result, for example, in inaccurate gas custody transfer billing, or may even cause the initiation of an erroneous emergency shutdown preparation of an entire process line.

Method used


Image

  • Method for quantifying peaks in an analytical signal
  • Method for quantifying peaks in an analytical signal
  • Method for quantifying peaks in an analytical signal

Examples


example i

Repeated Peak Analyses of the Same Analytical Signal with Noise Additions

example ia

During Method Development

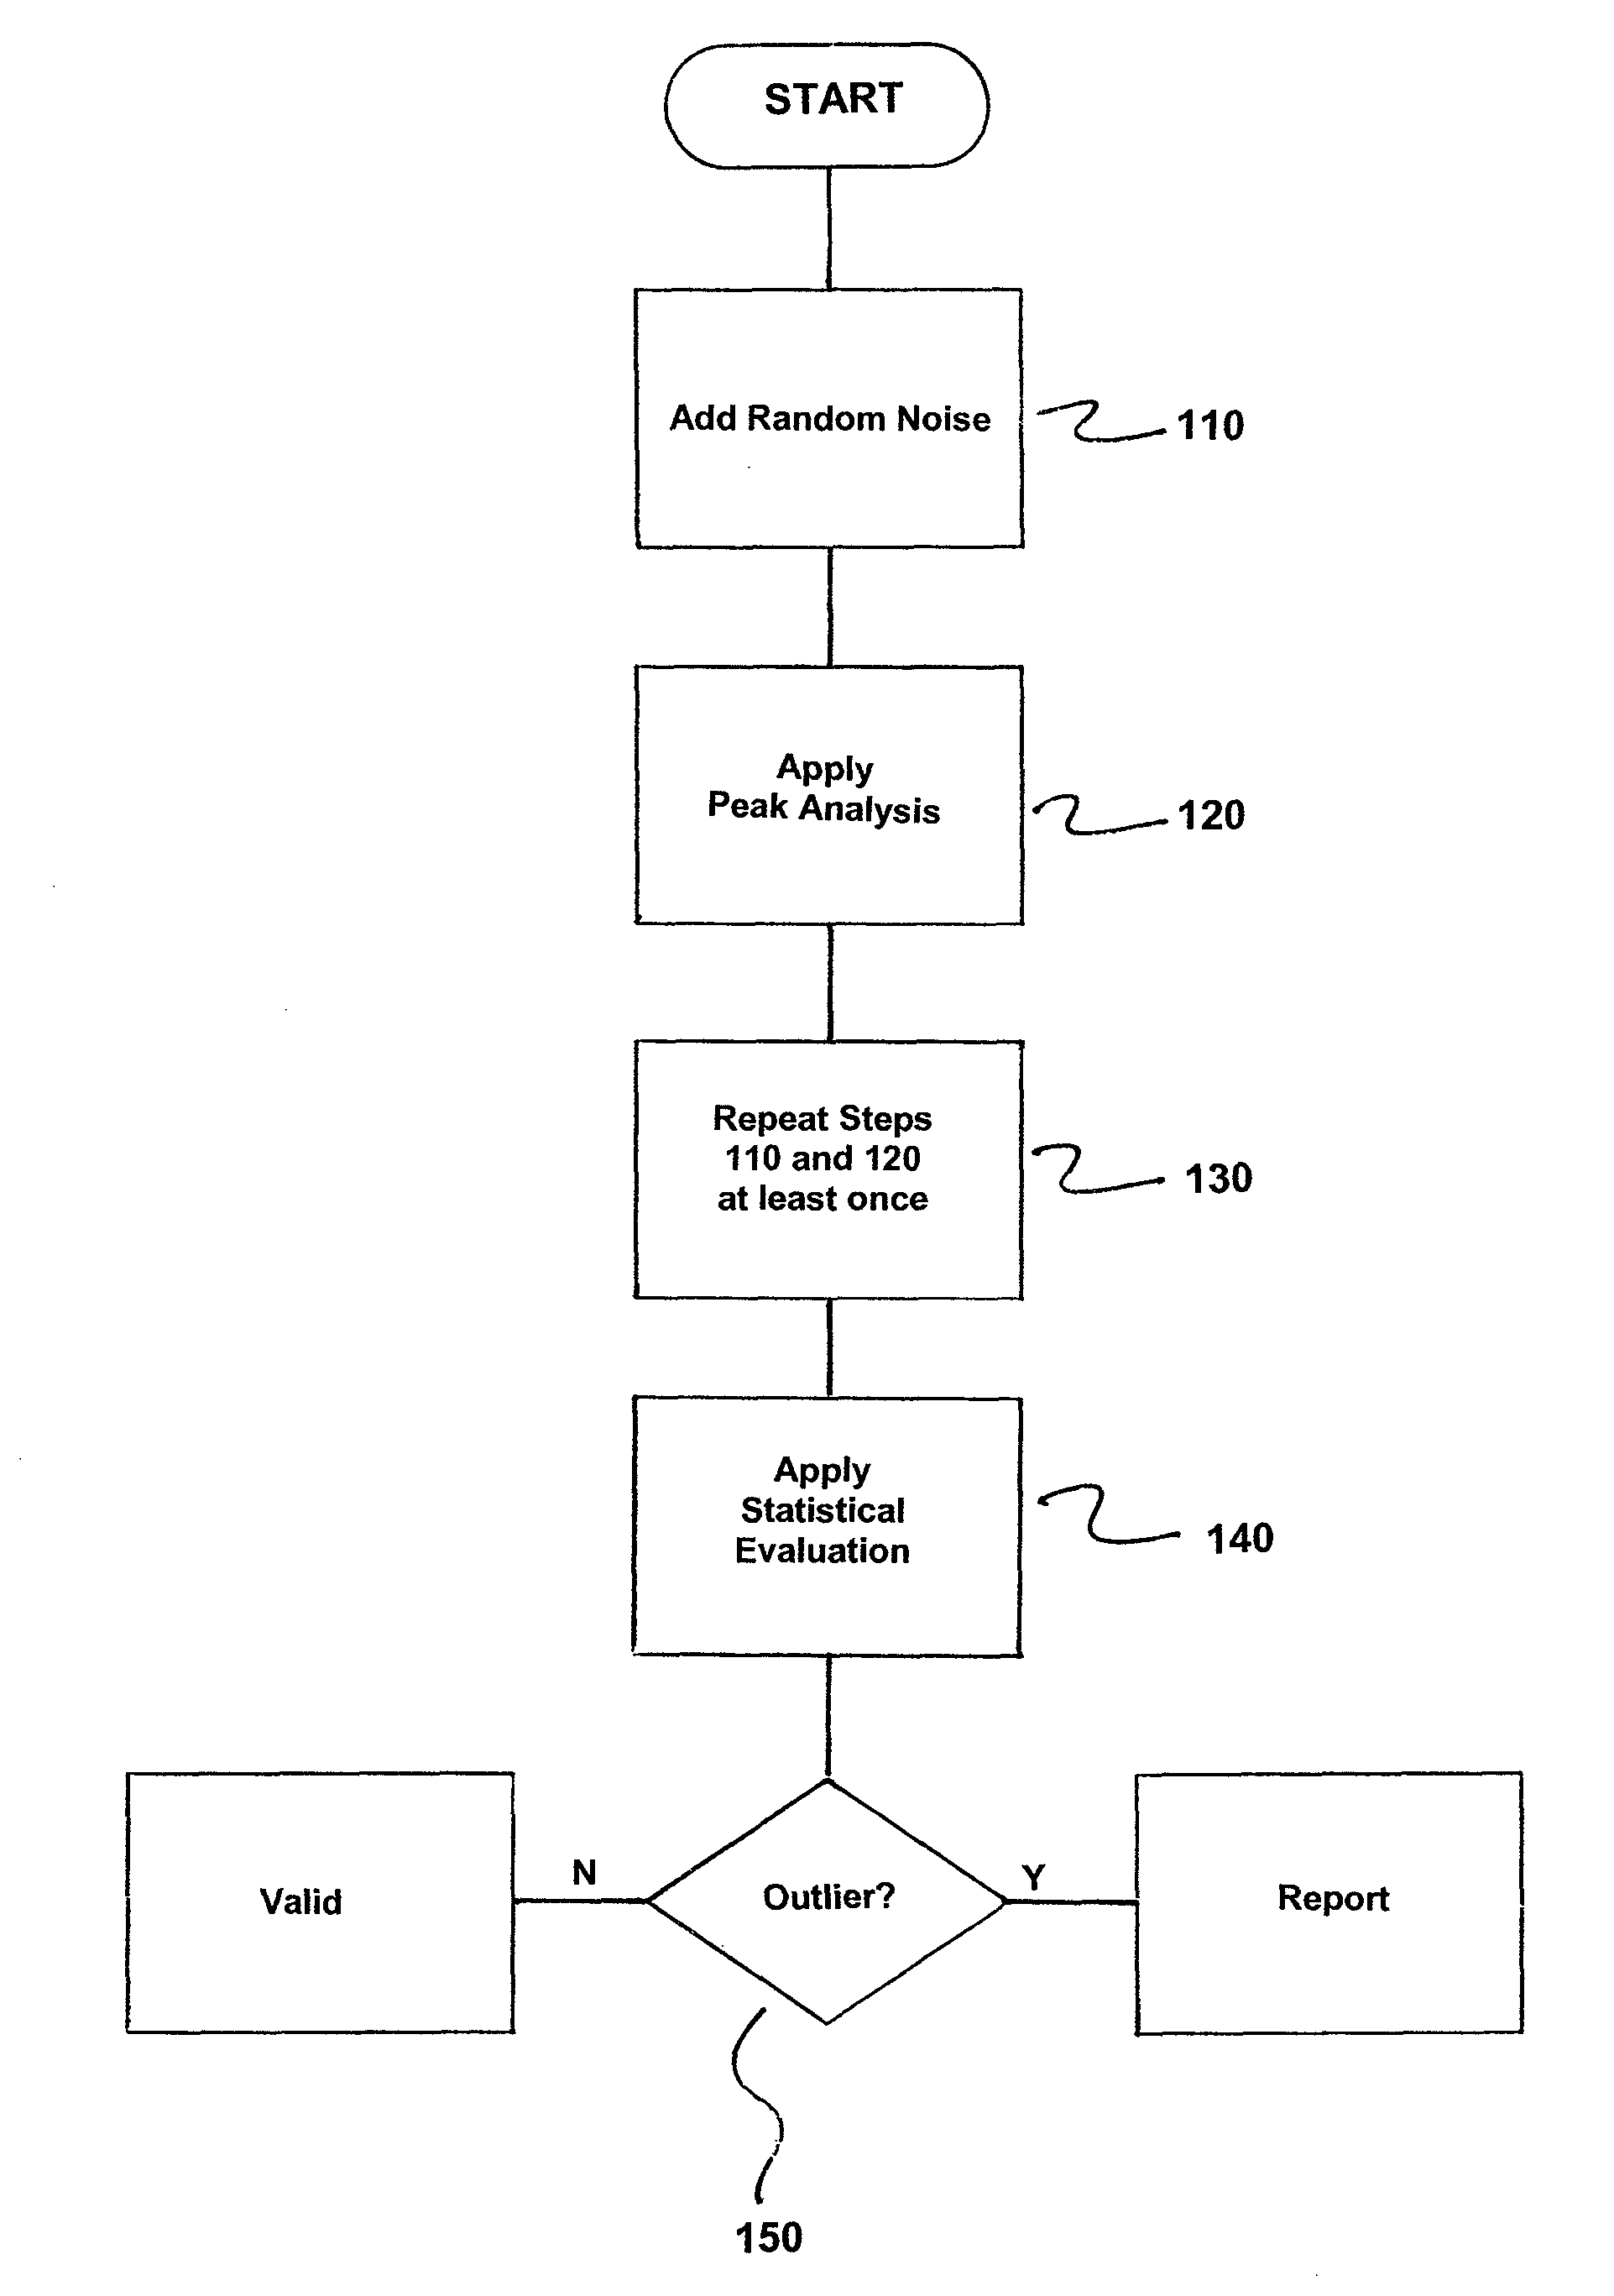
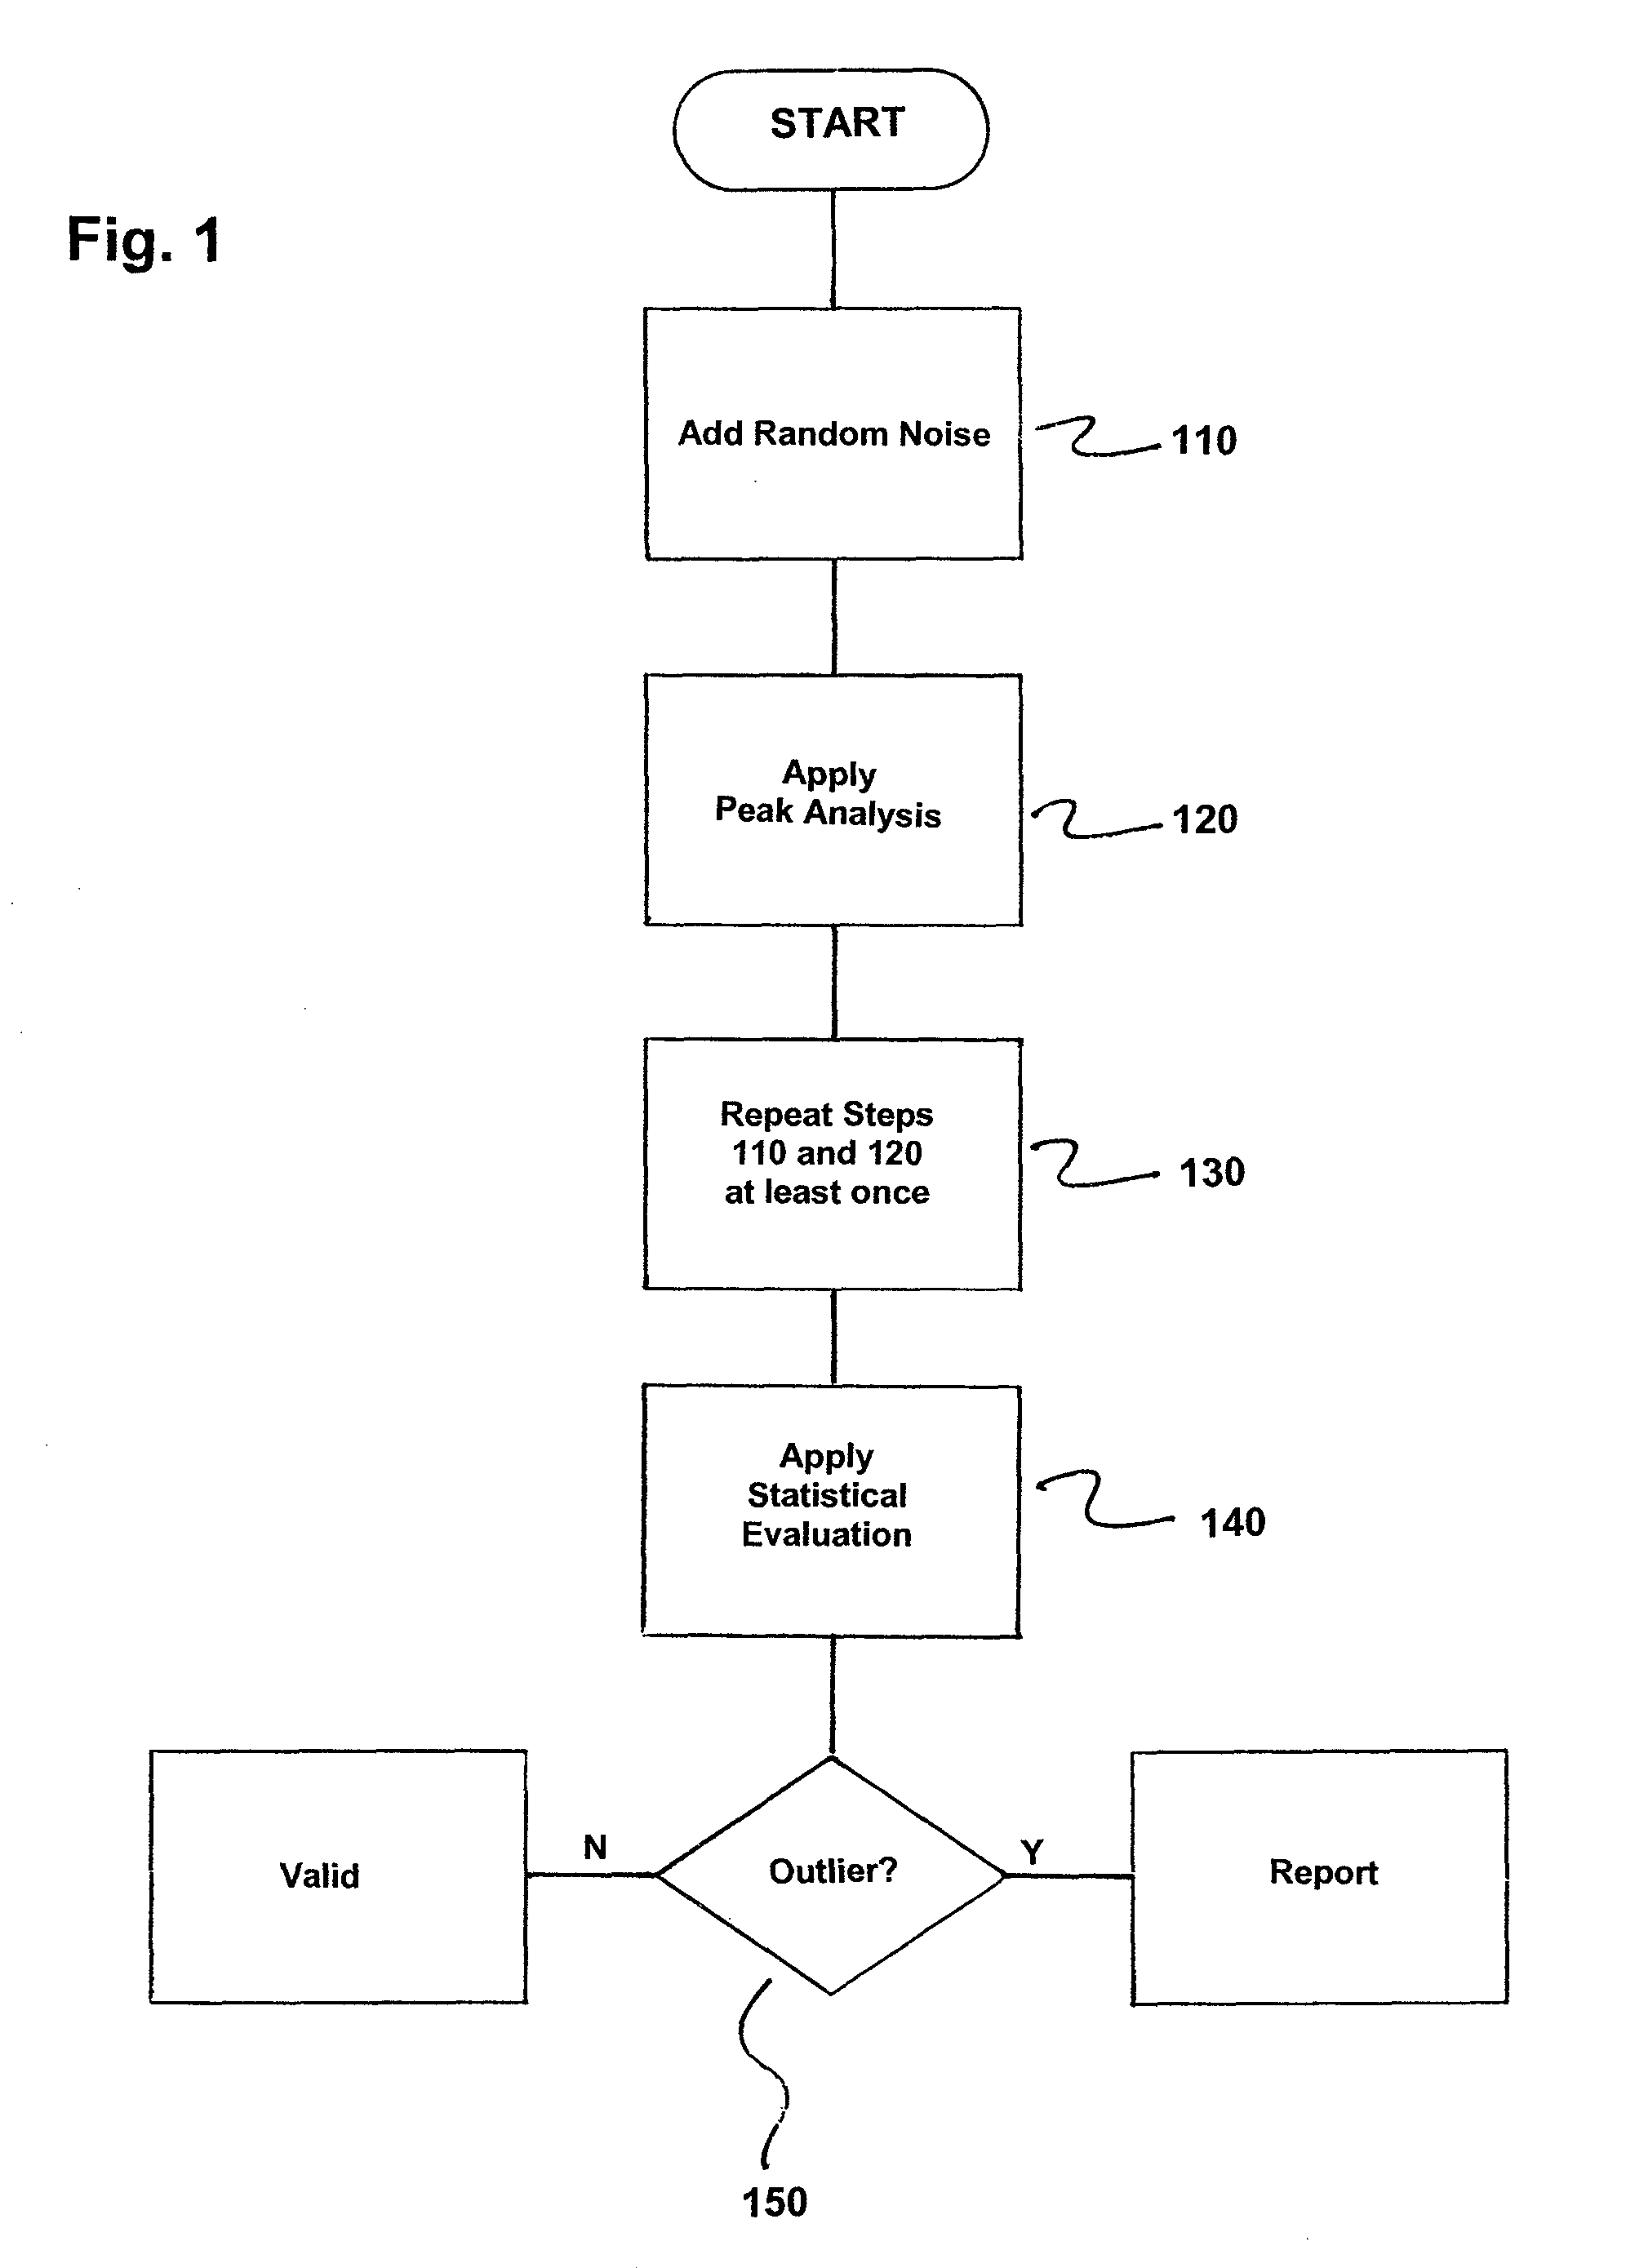
[0017]Step 1 Successive values of an analytical signal are acquired and recorded.

[0018]Step 2 A peak analysis methodology is applied to the recorded successive values of the analytical signal within an interval to quantify peaks in the analytical signal. Here, the interval may contain all signal values or only the signal values of a portion of interest of the recorded signal.

[0019]Step 3 Random noise is added to the recorded successive values of the analytical signal in the interval. The amount of noise may be similar to the signal-to-noise ratio (S / N) of the original signal, where the S / N may be estimated in Step 2.

[0020]Step 4 The peak analysis methodology is applied to random-noise-modified recorded successive signal values of the analytical signal of Step 3 to quantify peaks in the modified signal.

[0021]Step 5 Steps 3 and 4 are repeated at least once with different random noise added.

[0022]Step 6 A statistical evaluation methodology, such as Gubbs' test ...
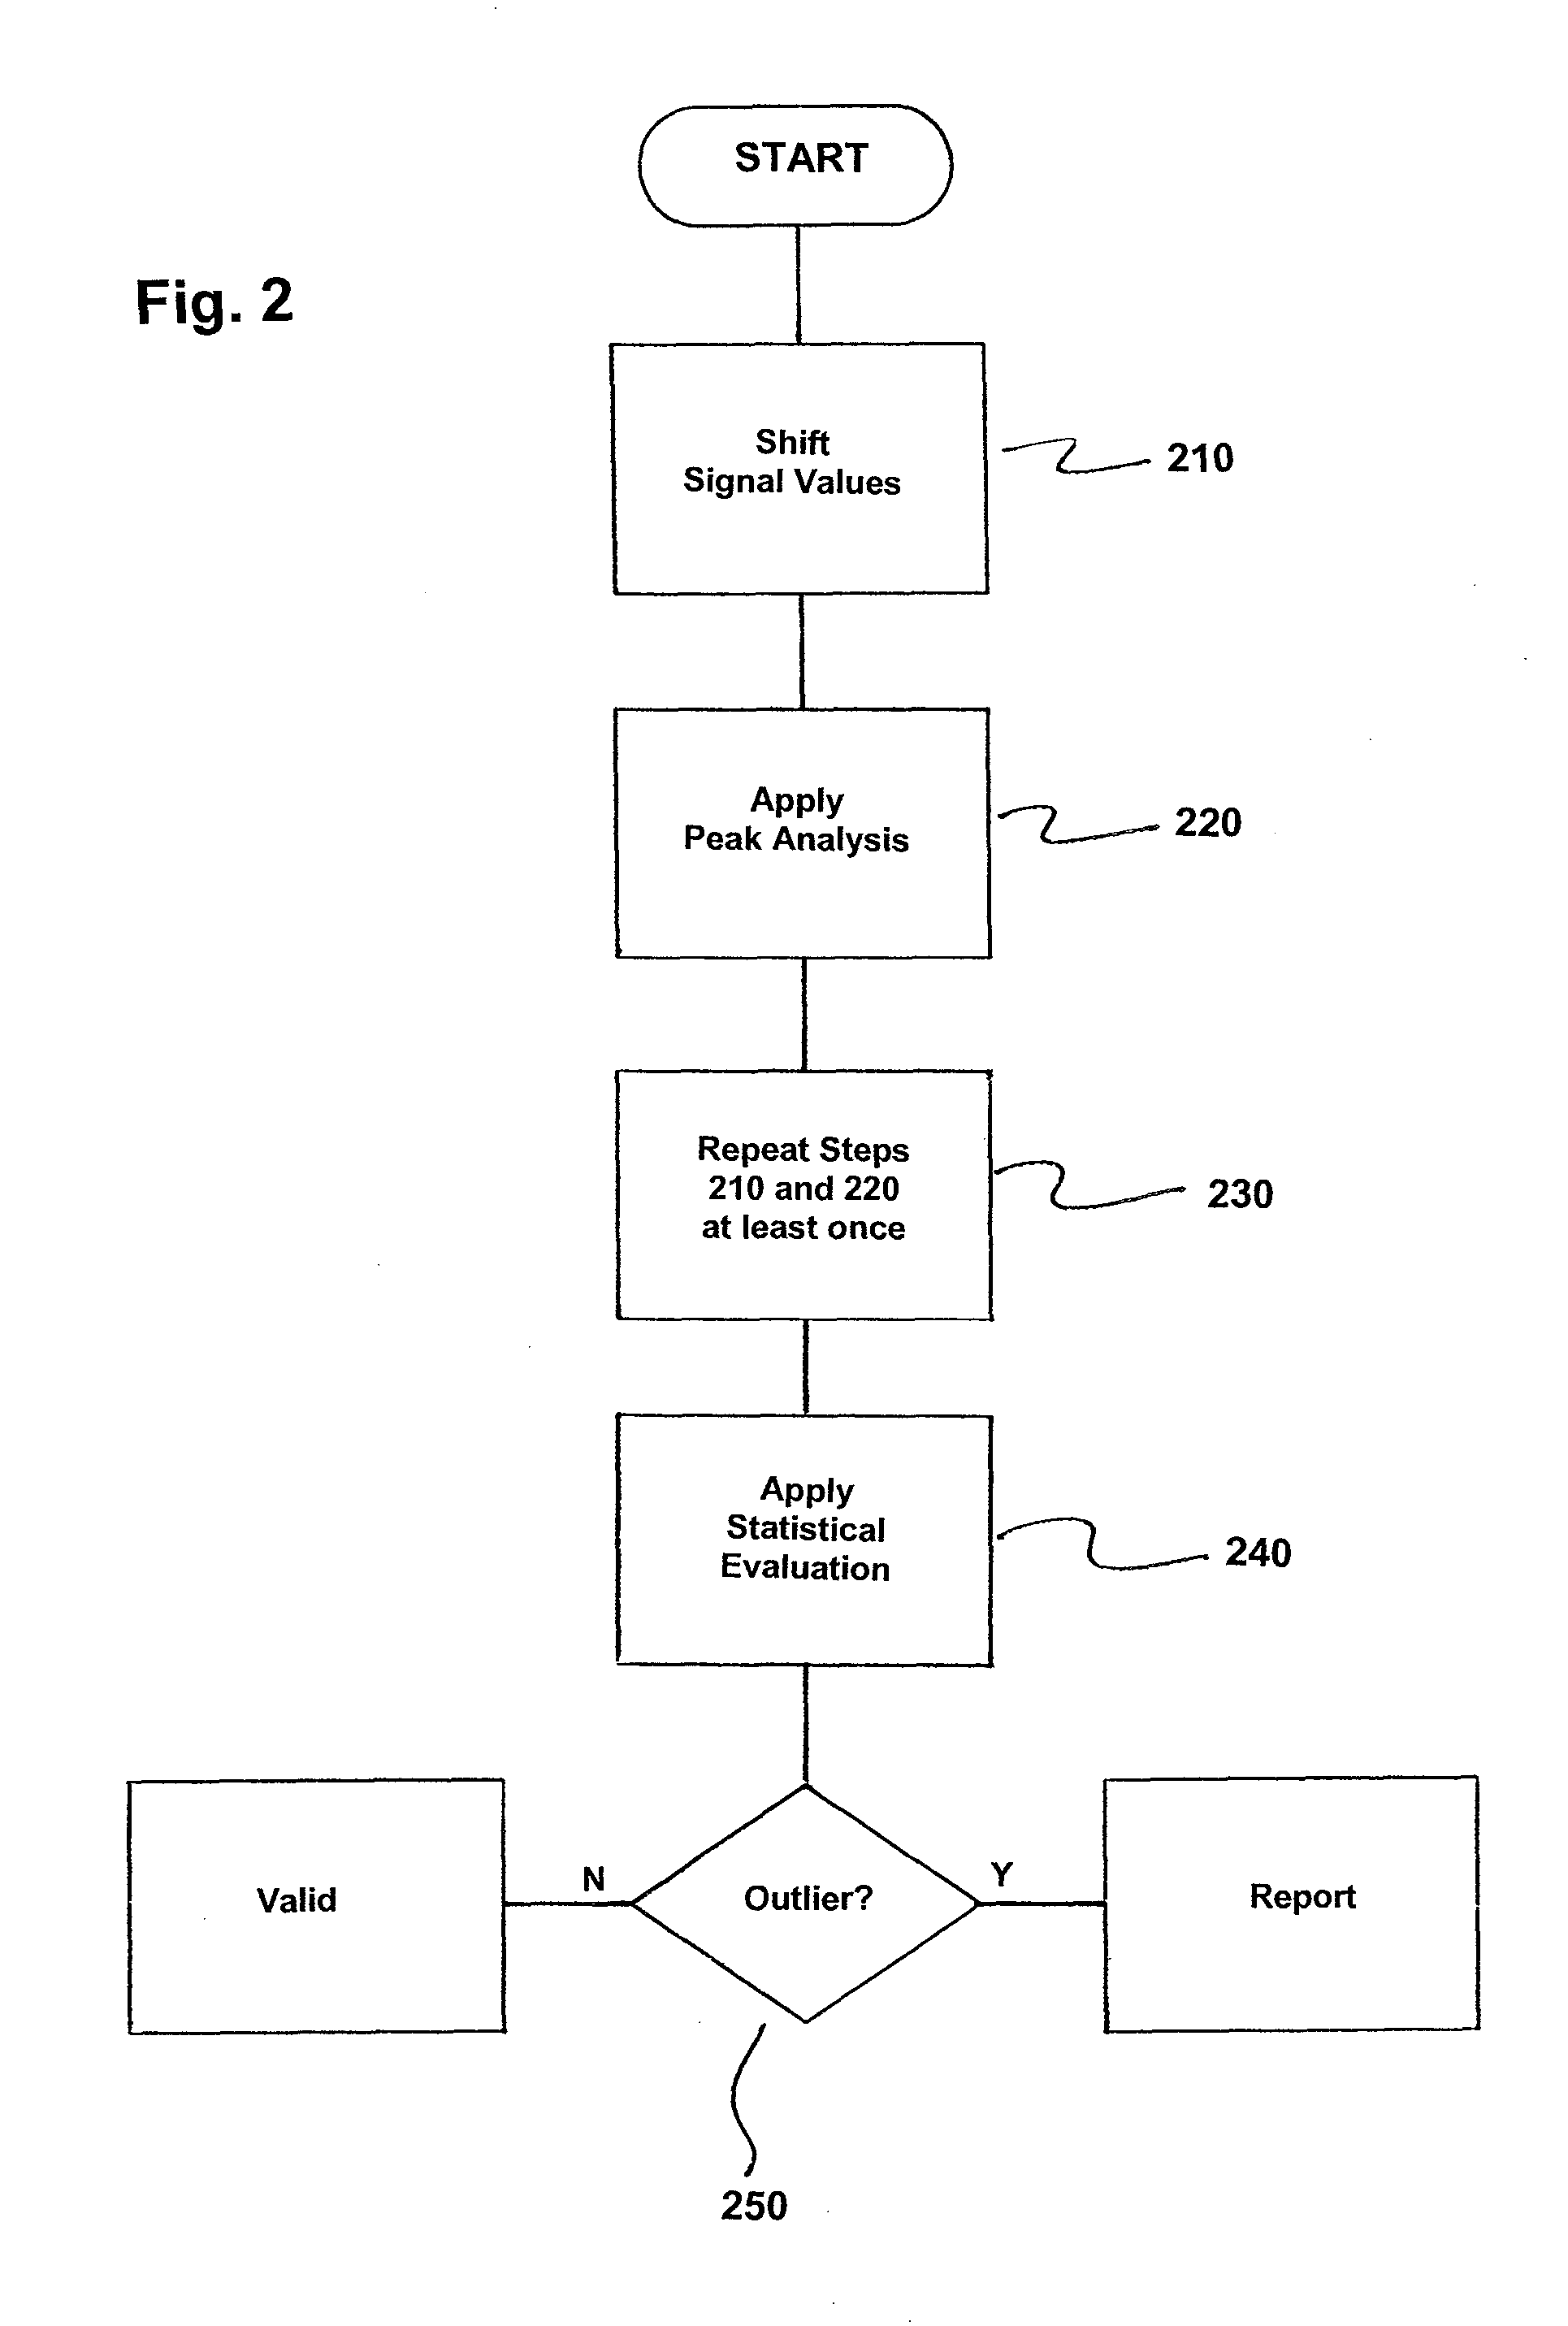
example ib

During Unattended Runtime Quantification

[0025]Steps 1 to 5 are performed as described in Example Ia.

[0026]Step 6 A statistical evaluation methodology, such as Gubbs' test or Dixon's test, is applied to sets of peak quantification results obtained in Steps 2 and 4 to detect whether there is an outlier in the peak quantification results.

[0027](a) Peak quantification results from Step 2 are accepted as valid results if there is no outlier.

[0028](b) Peak quantification results from Step 2 are reported as valid, but a degree of certainty is reduced, if there is one outlier.

[0029](c) Peak quantification results from Step 2 are reported as invalid if there is more than one outlier.


PUM


Abstract

A method for quantifying peaks in an analytical signal, peaks in the analytical signal being quantified by recording successive signal values and applying a peak analysis methodology to the recorded successive signal values within an interval to obtain a set of peak quantification results. Before the same peak analysis methodology is applied to the modified signal to quantify the peaks in the signal, random noise is added to the analytical signal and / or the signal is shifted within the interval to facilitate optimization of the parameters of the peak analysis methodology and to improve the robustness of the method in runtime applications. A subsequent statistical evaluation of the peak quantification results from the multiple repeated peak analyses of the original and modified signals is used to detect an occurrence of and to reduce the chance of a possible error in the peak quantification that needs to be alarmed or addressed.

Description

BACKGROUND OF THE INVENTION[0001]1. Field of the Invention[0002]The present invention relates to a computer-based method for quantifying peaks in an analytical signal by recording successive signal values of the analytical signal and applying a peak analysis methodology to the recorded successive signal values within an interval for obtaining a set of peak quantification results. The interval may contain all signal values or the signal values of a portion of interest of the recorded analytical signal.[0003]2. Description of the Related Art[0004]The majority of conventional peak analysis algorithms commonly used for quantification of peaks (i.e., peak areas or peak heights) in analytical signals, such as chromatograms or spectra, are based on derivatives of the analytical signals. These derivatives of the analytical signals are inherently sensitive to noise and signal shifts, especially when low signal-to-noise ratio (S / N) signals are involved. Real peaks often have poor shapes, such...

Claims


Application Information

Patent Timeline
Patent Type & Authority Patents(United States)
IPC IPC(8): G01R13/00G06F17/18
CPCG01N30/8631G06F17/18
Inventor KLAWUN, CHRISTOPHWANG, AOSHENG
Owner SIEMENS AG
Why Eureka
Try Eureka