Visualizing a time-variant parameter in a biological structure

a biological structure and time-variant technology, applied in image enhancement, tomography, instruments, etc., can solve the problems of difficult to relate the visualization to the actual anatomy, and the health care professional is presented with an ever increasing complexity of visualization data, so as to enhance the visualization of perfusion in the myocardium

Active Publication Date: 2014-11-04
KONINK PHILIPS ELECTRONICS NV
View PDF4 Cites 7 Cited by
  • Summary
  • Abstract
  • Description
  • Claims
  • Application Information

AI Technical Summary

Benefits of technology

[0012]By providing the user with this combination of the two representations, a higher resolution of data may be processed and meaningfully visualized for intermediate volumes between the first and the second boundary. This is based on the insight that it is desirable to view data between boundaries of a structure as well as at different positions through the structure. However, without simple means of visualization, processing a higher resolution of data is not feasible. This is especially useful when performance differences may be present between the structure at the first and the second boundary. For example, perfusion measurements within the myocardium are different for the endocardial and epicardial layers. Therefore, the relative position of the measurements relative to these layers yields valuable data in the evaluation of perfusion. This increases the information which the healthcare professional can extract from imaging data without complicating the representations required to visualize it.
[0017]By providing meaningful indicators to the user, the relationships between the different representations are clarified. This improves the intuitive feel of the displayed information, and makes it easier for the healthcare professional to relate the displayed information to a medical condition.
[0019]By providing high resolution and meaningful data, the system can be made more advantageous and intuitive by allowing the user to directly change parameters used in the determination and visualization of the data.
[0021]By introducing the healthcare professional to the possibility of a higher resolution of data analysis for biological structures, a whole new way of data representation becomes possible. Volume rendering techniques, never considered previously for such intermediate volumes in a structure, may be employed to provide even more advantageous representations.
[0028]The embodiments may also be advantageously combined with the “System For Analyzing Images and Corresponding Method” disclosed in the co-pending application, applicant reference number PH-012697, filed by the same applicant and on the same day as this application. The co-pending application discloses establishing a gradient which is representative of the rate of change in data values between a first and a second border. This gradient may advantageously be used in the embodiments of the current application to determine one of the visualization parameters. Additionally, it may be advantageous to further configure the system of this application to also display the gradientogram disclosed in said co-pending application, or to display the gradientogram in place of the first representation. In particular, the visualization of perfusion in a myocardium may be enhanced by combining the disclosures of the co-pending application with those of the present application.

Problems solved by technology

As medical imaging and analysis techniques are continuously improving, the healthcare professional is presented with an ever increasing complexity of the data available for visualization.
FIGS. 6 and 7 illustrate the difficulties in presenting complex multidimensional data to the user—FIG. 7 makes it difficult to relate the representation to the actual anatomy of the patient, and FIG. 6 does not show changes in intensity observed over time.

Method used


Image

  • Visualizing a time-variant parameter in a biological structure
  • Visualizing a time-variant parameter in a biological structure
  • Visualizing a time-variant parameter in a biological structure

Examples


Embodiment Construction

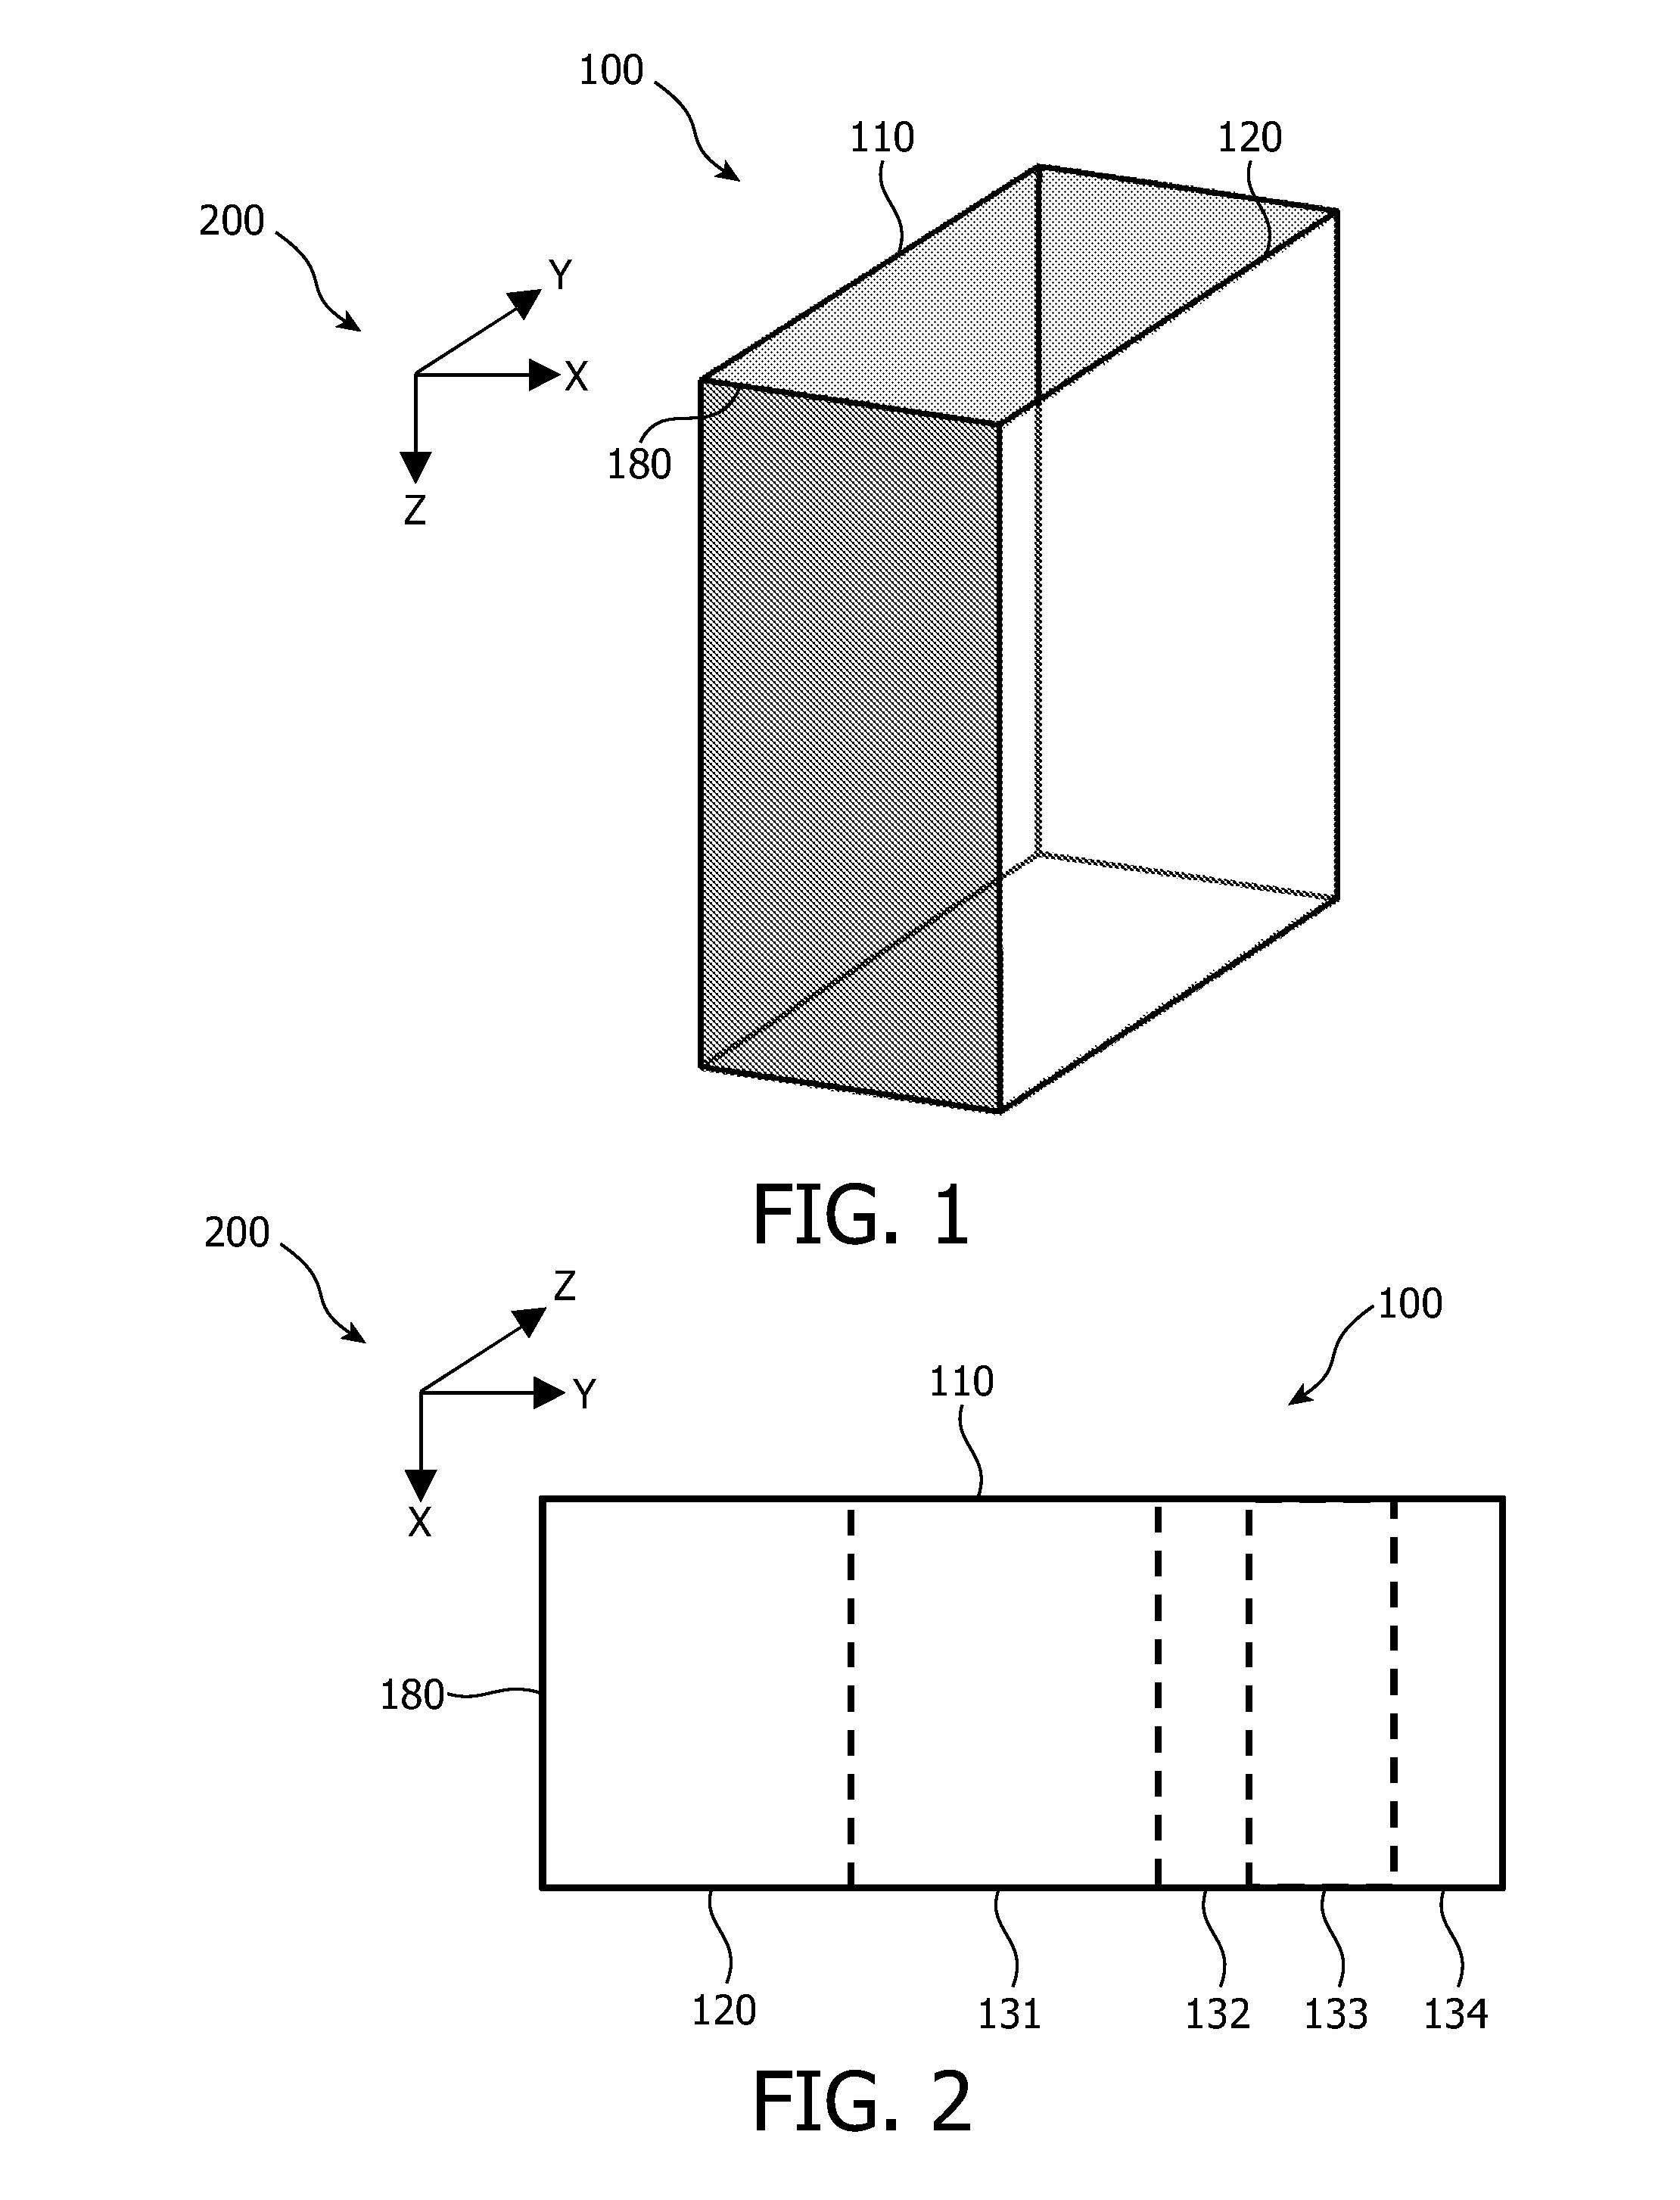
[0049]FIG. 1 depicts a biological structure 100 for which a representation may be determined. The structure 100 extends in mutually perpendicular X, Y and Z directions 200. These directions 200 are chosen arbitrarily—any other coordinate system or convention may be used. The structure 100 is defined by a first boundary 110 and a second boundary 120, each boundary extending in YZ planes. The structure is also bounded by an XY plane 180.

[0050]The skilled person will realize that the structure 100 and its boundaries here described do not necessarily coincide with the anatomical extent of biological tissue. For example, the boundaries of the structure 100 may coincide with the walls of a blood vessel or tissue walls, such as the endocardial and epicardial layers of the myocardium, but they may also be selected to define a volume of interest for imaging purposes inside or outside such walls. Similarly, any boundaries in the Z direction may also be arbitrarily selected. Typically, however...


PUM


Abstract

The invention relates to a system and a method for visualizing a time-variant parameter at a plurality of positions in a biological structure, wherein a visualization display is configured to display a first representation showing a first visualization parameter at a plurality of time intervals, determined in a first volume between a first and a second boundary of the structure, and to display a second representation showing first and second visualization parameters determined in the first and in a second volume extending between the first and the second boundary of the structure. By providing the user with this combination of the two representations, a higher resolution of data may be processed and meaningfully visualized for intermediate volumes between the first and the second boundary. This is based on the insight that it is desirable to view data between boundaries of a structure as well as at different positions through the structure. However, without simple means of visualization, processing a higher resolution of data is not feasible. This is especially useful when performance differences may be present between the structure at the first and the second boundary. For example, perfusion measurements within the myocardium are different for the endocardial and epicardial layers. Therefore, the relative position of the measurements relative to these layers yields valuable data in the evaluation of perfusion. This increases the information which the healthcare professional can extract from imaging data without complicating the representations required to visualize it.

Description

FIELD OF THE INVENTION[0001]The invention relates to a system and method for visualizing a time-variant parameter in a biological structure.BACKGROUND OF THE INVENTION[0002]As medical imaging and analysis techniques are continuously improving, the healthcare professional is presented with an ever increasing complexity of the data available for visualization. Starting with measurements of a parameter within a volume of interest, the parameter may be analyzed in different quantitative ways, for example to extract maximum intensity, mean intensity, minimum intensity, average slope values, maximum slope values, minimum slope values, for any desired piece of the volume of interest. The professional must then be able to visualize the data in a meaningful way. For example, visualization of time-intensity curves and associated quantitative analysis data derived from medical images, such as for images of a diseased heart acquired with first pass enhancement cardiac magnetic resonance imaging...

Claims


Application Information

Patent Timeline
Patent Type & Authority Patents(United States)
IPC IPC(8): G06T15/08G06T7/00G06T7/20G06T19/20
CPCG06T7/20G06T2210/41G06T19/20G06T2200/24G06T7/0012G06T2219/2012A61B6/507G06T2207/10088G06T15/08G06T2207/30048G06T11/206
Inventor HAUTVAST, GUILLAUME, LEOPOLD, THEODORUS, FREDERIK
Owner KONINK PHILIPS ELECTRONICS NV
Why Eureka
Try Eureka