Method of visualization of contrast intensity change over time in a DSA image

a technology of contrast intensity and image, applied in the field of visualization of contrast intensity change over time in an image, can solve the problem of not providing an indication of flow over time at different points in an imag

Active Publication Date: 2015-04-28
SIEMENS HEALTHCARE GMBH
View PDF7 Cites 10 Cited by
  • Summary
  • Abstract
  • Description
  • Claims
  • Application Information

AI Technical Summary

Problems solved by technology

A known system may provide a static color image showing a single characteristic of a point in the image (e.g., time of contrast peak) but this fails to provide an indication of flow over time at different points in an image.

Method used


Image

  • Method of visualization of contrast intensity change over time in a DSA image
  • Method of visualization of contrast intensity change over time in a DSA image
  • Method of visualization of contrast intensity change over time in a DSA image

Examples


Embodiment Construction

[0011]A system provides a display image enabling a user to visualize and compare blood flow characteristics over time at selected points in an angiographic X-ray image. The system generates a graph of contrast agent intensity (representing blood flow) over time during display of a DSA (digitally subtracted angiography) image, in response to user selection of a point of interest in the DSA image. DSA involves acquiring a reference image (called a mask) which contains only static background detail and is acquired before injection of a contrast agent (e.g., an X-ray opaque dye) into patient anatomy. In order to remove static background detail from images, a mask image is subtracted from subsequent images acquired when a contrast agent is in patient blood which yields a clear picture of blood vessels filled with the contrast agent.

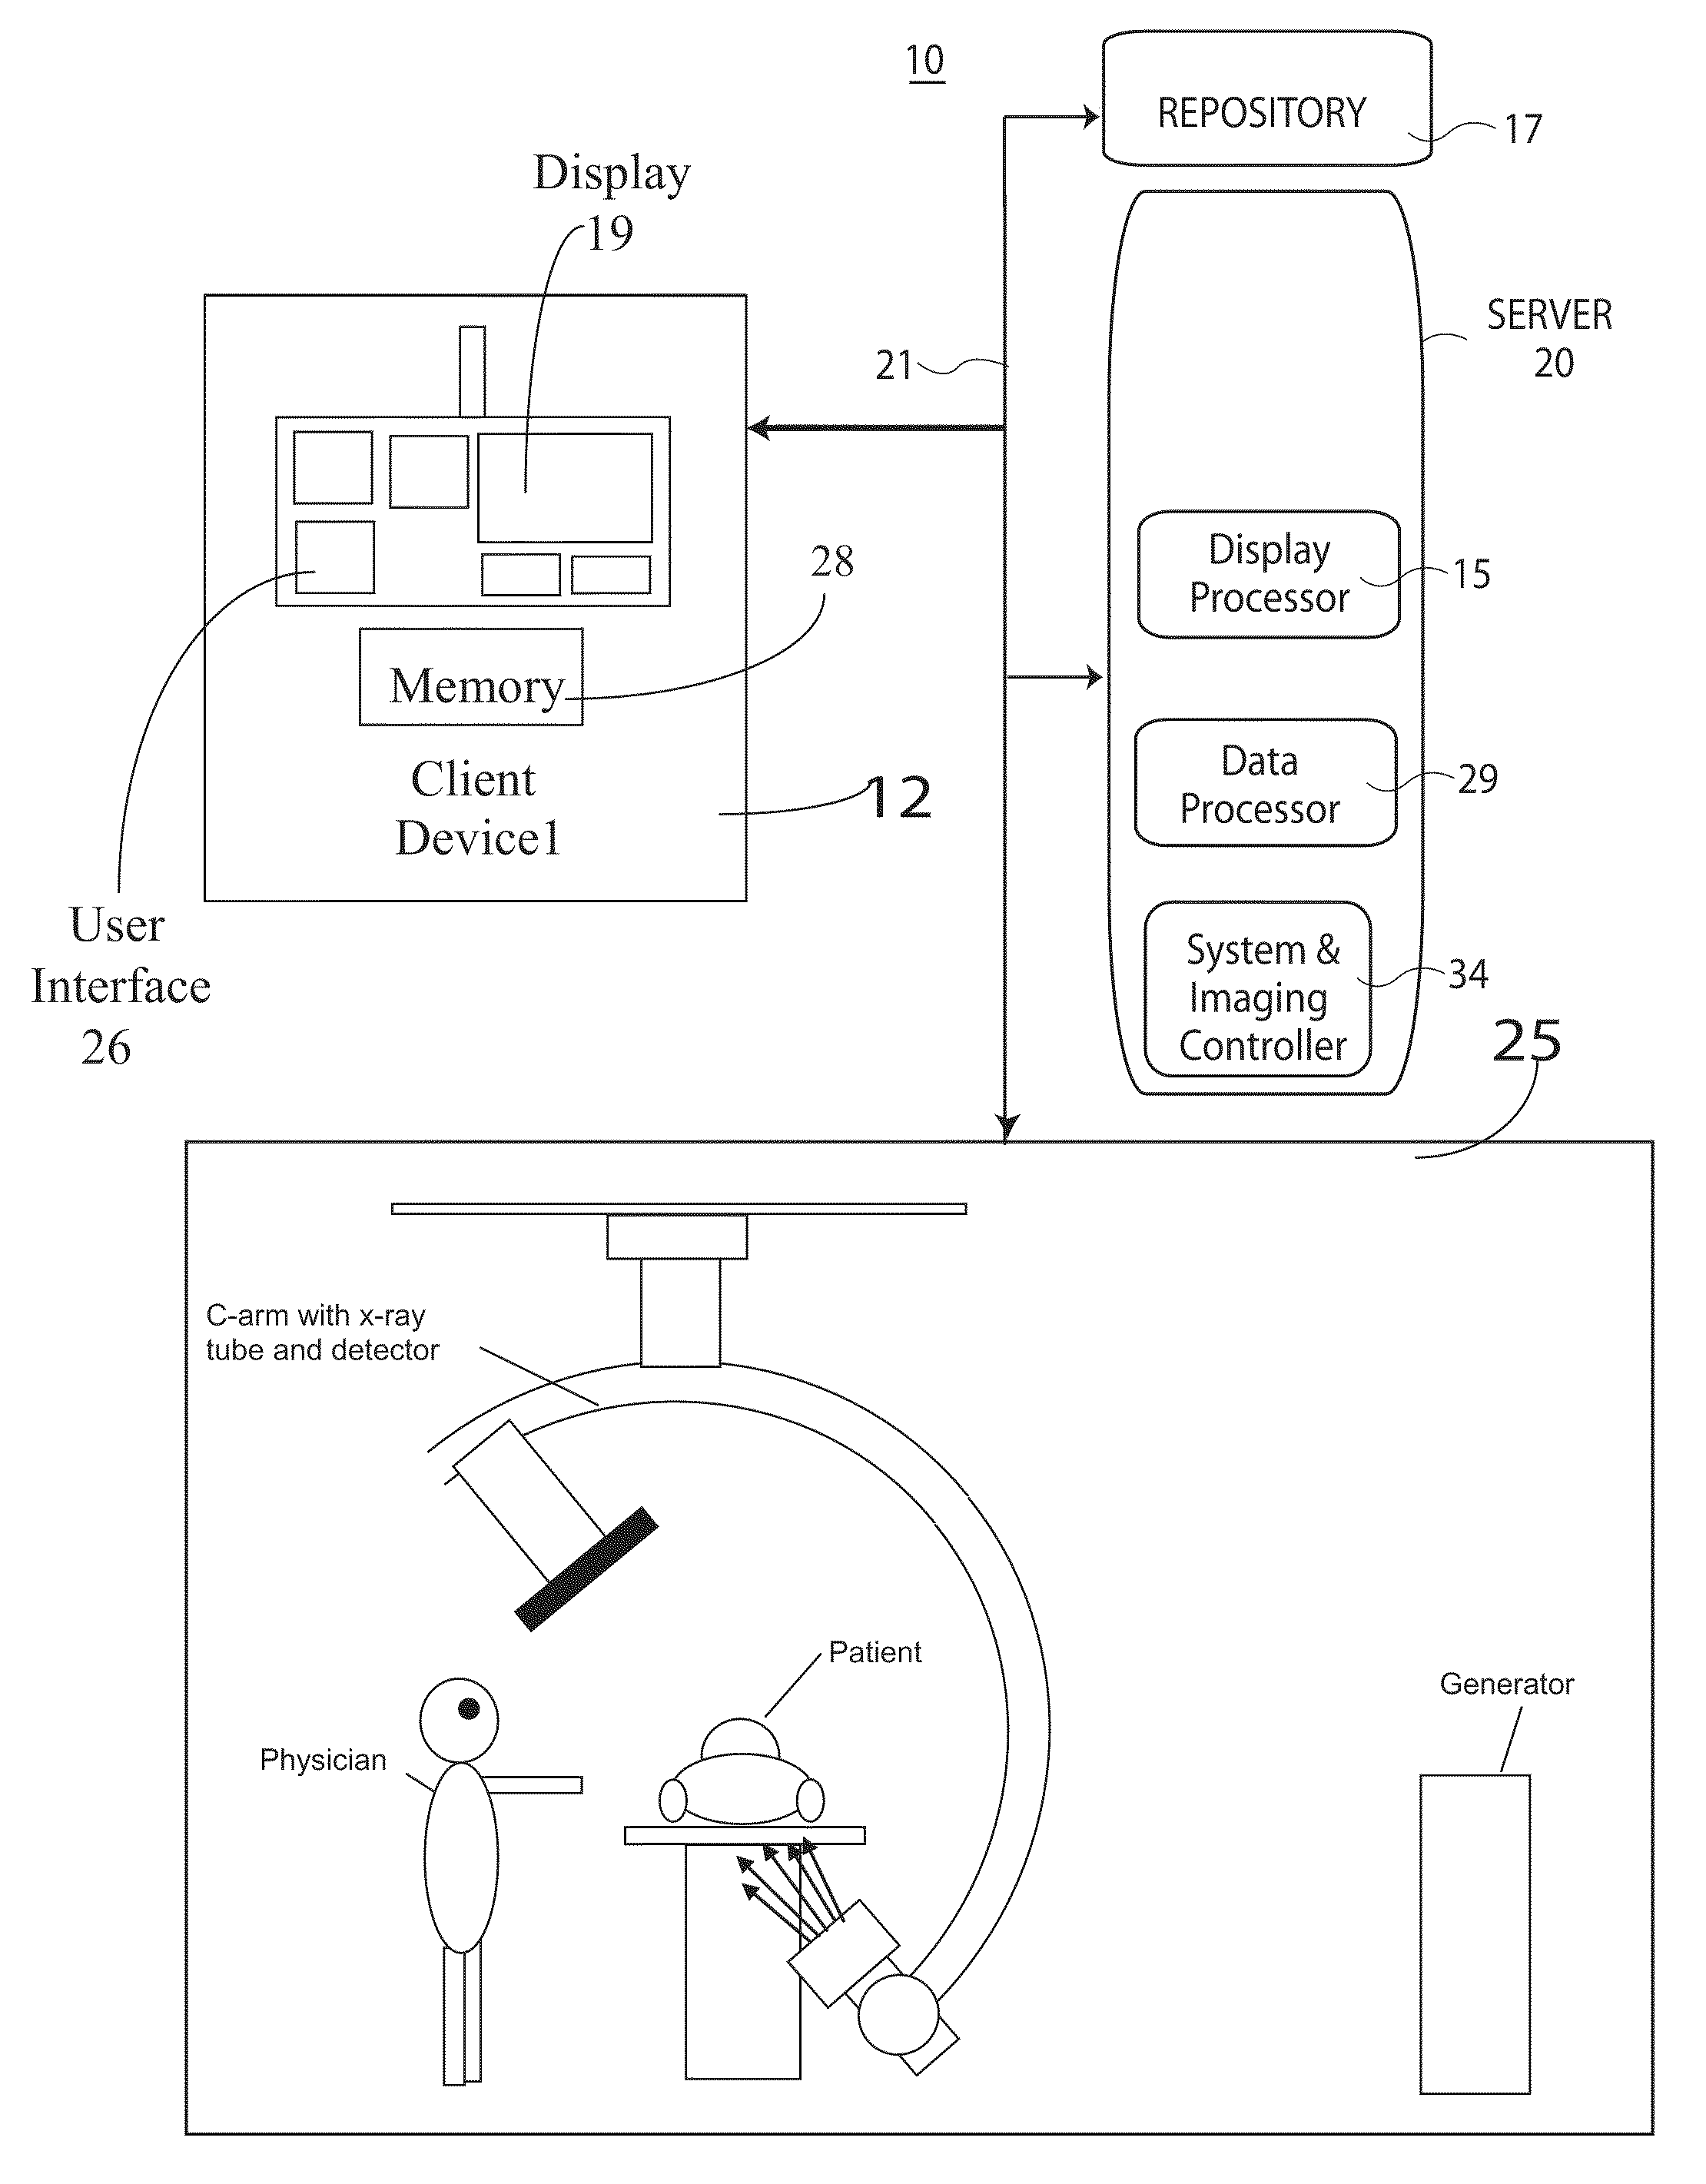
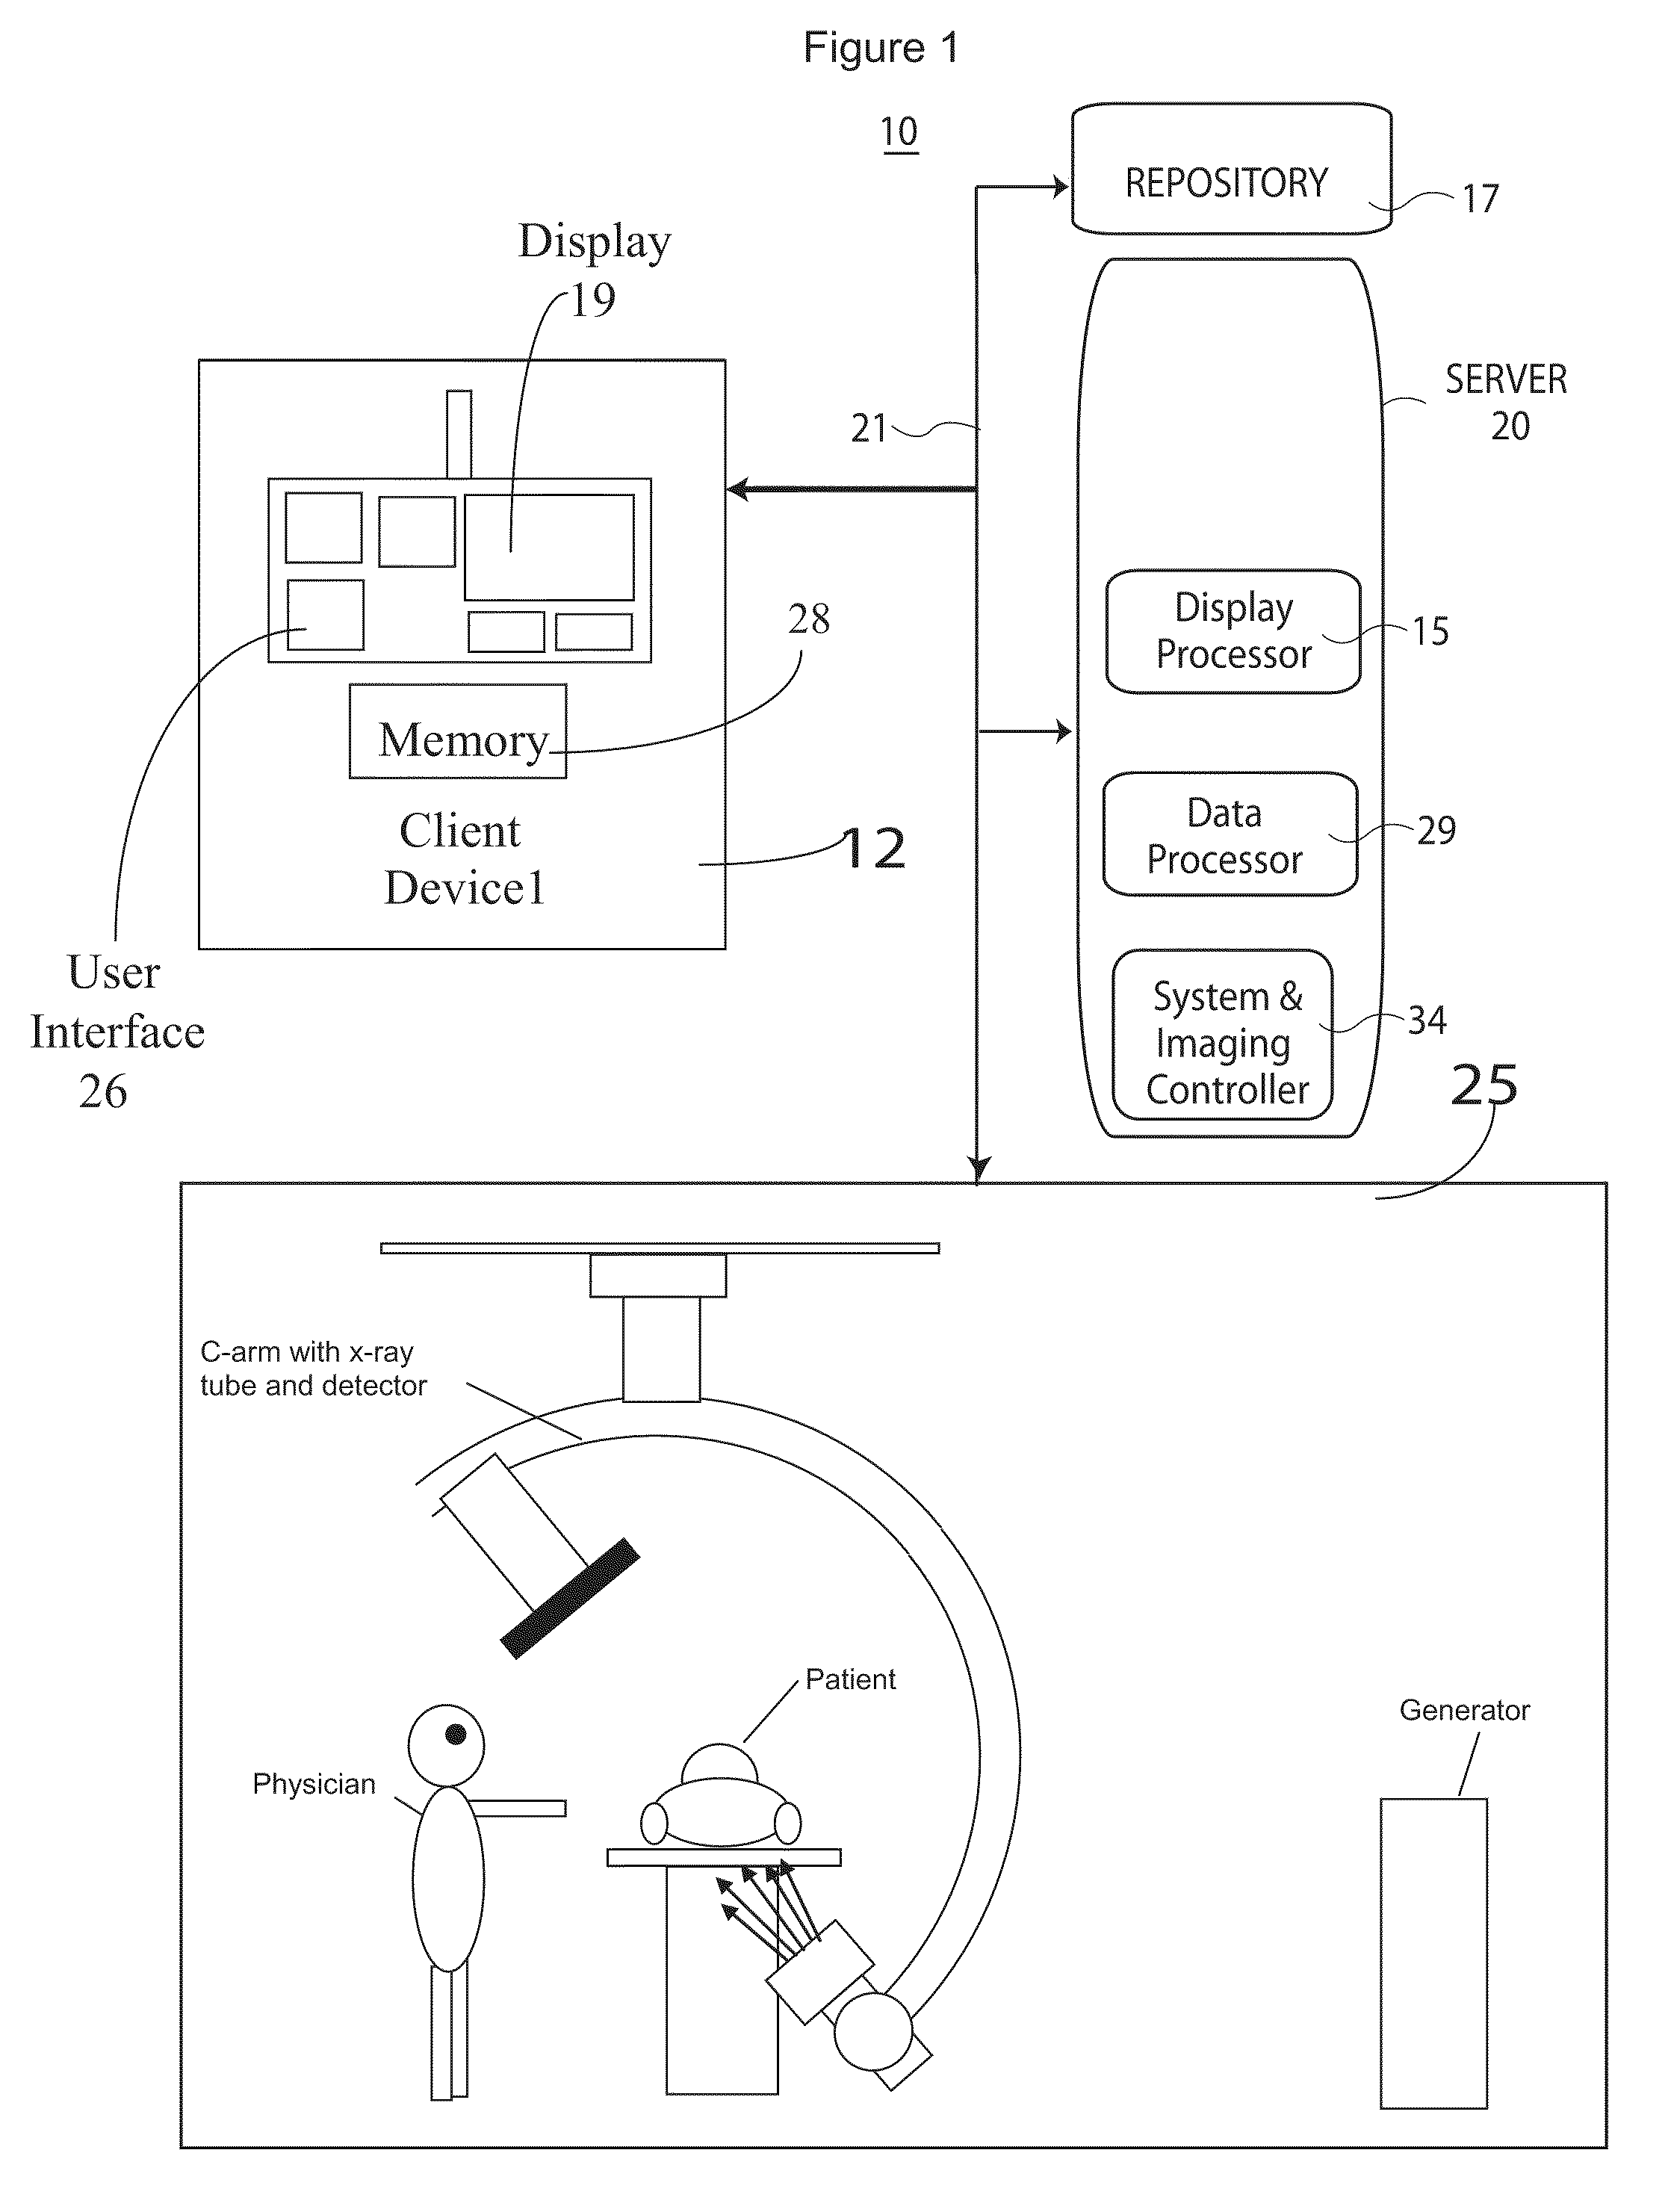
[0012]FIG. 1 shows system and user interface 10 enabling user interaction with a medical vessel structure image to determine individual vessel blood flow char...


PUM


Abstract

A system provides a display image enabling a user to visualize and compare blood flow characteristics over time at selected points in an angiographic X-ray image. A system and user interface enables user interaction with a medical vessel structure image to determine individual vessel blood flow characteristics. The system includes a user interface cursor control device and a display processor for generating data representing a single composite display image. The composite display image includes, a first image area showing a patient vessel structure and contrast agent flow through the patient vessel structure over a first period of time and a second image area showing a graph of contrast agent concentration in a particular portion of the vessel structure over a second period of time. The particular portion of the vessel structure is selected in response to user command using the cursor control device.

Description

[0001]This is a non-provisional application of provisional application Ser. No. 61 / 168,262 filed Apr. 10, 2009, by J. Baumgart et al.FIELD OF THE INVENTION[0002]This invention concerns a system and user interface enabling user interaction with a medical vessel structure image to determine individual vessel blood flow characteristics including contrast agent concentration in a particular portion of a vessel structure, for example.BACKGROUND OF THE INVENTION[0003]In order to study contrast agent flow, which is representative of blood flow through vessels in an angiography (e.g., Digitally Subtracted Angiography (DSA)) image sequence, it is useful to visualize the characteristics of flow over time at various points within an image while evaluating the need for treatment or the effectiveness of treatment. A DSA image sequence may be interpreted in known systems by determining contrast agent changes over time to indicate blood flow at particular points in an image. A known system may pro...

Claims


Application Information

Patent Timeline
Patent Type & Authority Patents(United States)
IPC IPC(8): G09G5/00A61B6/00
CPCA61B6/504A61B6/463A61B6/467A61B6/469A61B6/481
Inventor BAUMGART, JOHNMARTUCCI, GARY S.
Owner SIEMENS HEALTHCARE GMBH
Why Eureka
Try Eureka