System and method of generating data points from one or more data stores of data items for chart creation and manipulation

a data item and data store technology, applied in the field of chart creation and manipulation, can solve the problems of insufficient search and filtering options, large volume of data for many chart creation tools, and inability to effectively handle large volumes of data, etc., and achieve the effect of facilitating the identification of patterns or correlations

Active Publication Date: 2017-11-14
PALANTIR TECHNOLOGIES
View PDF972 Cites 29 Cited by
  • Summary
  • Abstract
  • Description
  • Claims
  • Application Information

AI Technical Summary

Benefits of technology

[0008]In some embodiments, a chart creation tool creates charts from one or more received data points. In some embodiments, the chart creation tool may be implemented as a web app. The chart creation tool may be configured by the user to synchronize manipulations between different charts, allowing them to be more effectively compared with each other. In addition, the user may select different charts of different types to be merged or overlaid, allowing easier identifying of patterns or correlations indicative of market manipulation and / or other suspect behavior.
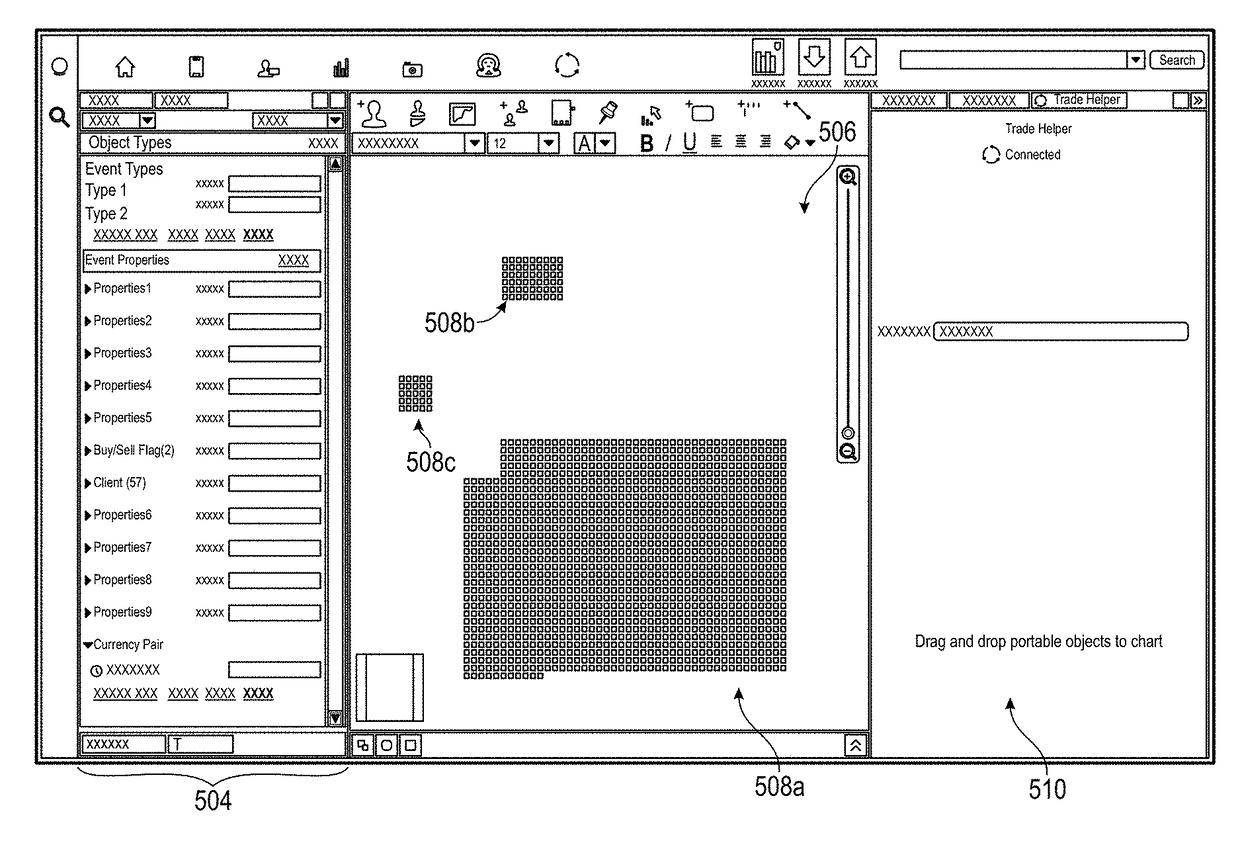
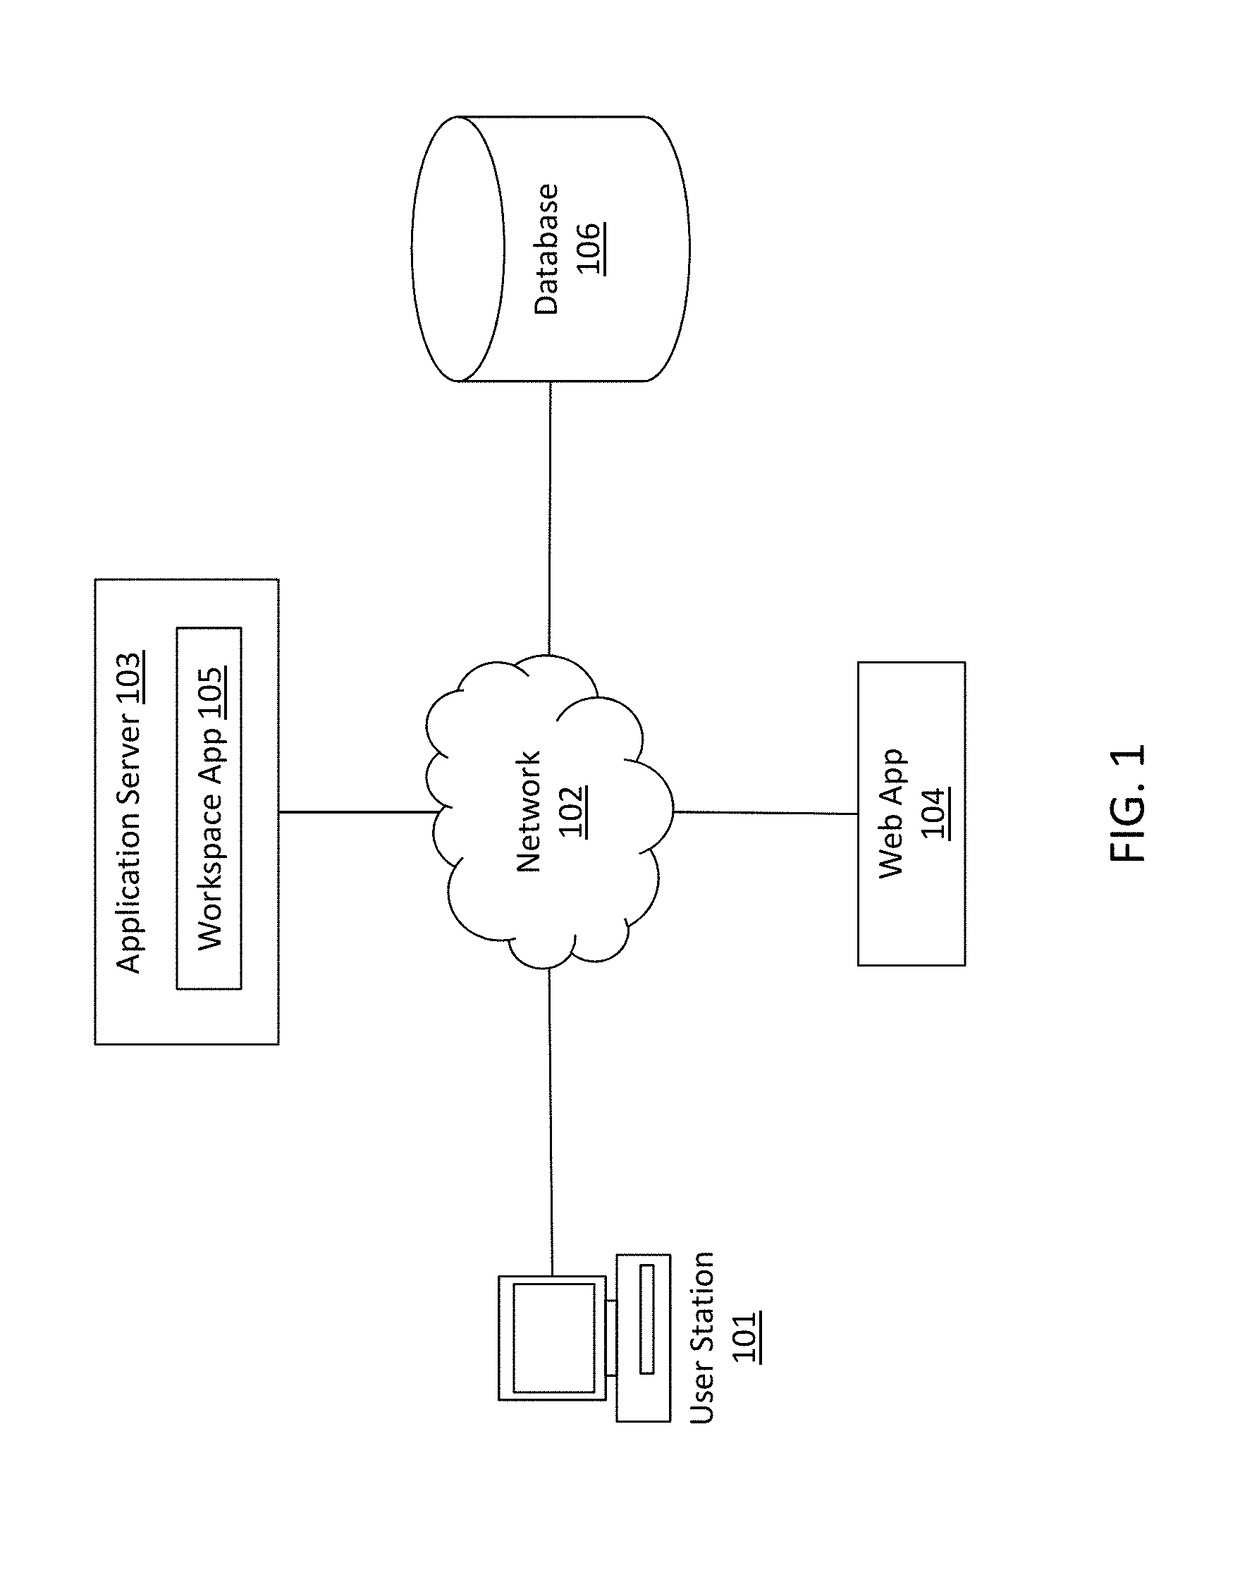
[0009]In some embodiments, the chart creation tool coordinates with a separate data analysis workspace application to receive more customized and refined sets of data points for chart creation. The workspace application may contain more specialized tools for searching through and filtering large sets of data (potentially spanning hundreds of terabytes) and / or data spread over multiple databases or servers. In addition, the workspace application provides additional customization options allowing a user to select, remove, or cherry-pick the data items for visualization as a chart or graph. After defining one or more sets of data points using the workspace application, the user may then transmit the selected data points to the chart creation tool.

Problems solved by technology

Analysts and regulators often must often sift through large amounts of data when attempting to identify occurrences of market manipulation and / or other types of bad behavior in a particular market or network.
This can be an arduous and time-consuming process, especially since the data may be very large (potentially spanning hundreds of terabytes) and be spread across multiple databases or servers.
For example, many chart creation tools are not able to effectively handle large volumes of data, or data spanning multiple servers or databases.
They may also lack sufficient search and filtering options to define the set of data from which to create a chart, and may not be dynamically updatable in response to interactive user inputs.
In addition, the chart creation tool may not possess functionality to allow an analyst to drill down into the full metadata of data items corresponding to the data points in the chart.

Method used


Image

  • System and method of generating data points from one or more data stores of data items for chart creation and manipulation
  • System and method of generating data points from one or more data stores of data items for chart creation and manipulation
  • System and method of generating data points from one or more data stores of data items for chart creation and manipulation

Examples


Embodiment Construction

[0023]Although certain preferred embodiments and examples are disclosed below, inventive subject matter extends beyond the specifically disclosed embodiments to other alternative embodiments and / or uses and to modifications and equivalents thereof. Thus, the scope of the claims appended hereto is not limited by any of the particular embodiments described below. For example, in any method or process disclosed herein, the acts or operations of the method or process may be performed in any suitable sequence and are not necessarily limited to any particular disclosed sequence. Various operations may be described as multiple discrete operations in turn, in a manner that may be helpful in understanding certain embodiments; however, the order of description should not be construed to imply that these operations are order dependent. Additionally, the structures, systems, and / or devices described herein may be embodied as integrated components or as separate components. For purposes of compa...


PUM


Abstract

Embodiments of the present disclosure relate to a data analysis system configured to implement cross-application coordination between a chart creation tool and a data analysis workspace, in order to create one or more charts from customized sets of data points, synchronize chart manipulations between charts, and drill down into the metadata of data points in the created charts. The user uses the data analysis workspace to select, remove, or cherry-pick data items to be used to create a chart, which may be transmitted from the workspace to the chart creation tool as data points. In addition, the user may select the data points in the chart to retrieve one or more identifiers to be transmitted back to the workspace, where they are used to identify the data items associated with the data points, and retrieve the full metadata of the data items.

Description

INCORPORATION BY REFERENCE TO ANY PRIORITY APPLICATIONS[0001]Any and all applications for which a foreign or domestic priority claim is identified in the Application Data Sheet as filed with the present application are hereby incorporated by reference under 37 CFR 1.57.BACKGROUND OF THE INVENTION[0002]Embodiments of the present disclosure generally relate to the creation and manipulation of charts used for data analysis.[0003]Analysts and regulators often must often sift through large amounts of data when attempting to identify occurrences of market manipulation and / or other types of bad behavior in a particular market or network. For example, such data may include trade execution data, order data, employee data, market price data, etc. This can be an arduous and time-consuming process, especially since the data may be very large (potentially spanning hundreds of terabytes) and be spread across multiple databases or servers.[0004]Visualizations of the collected data (such as charts,...

Claims


Application Information

Patent Timeline
Patent Type & Authority Patents(United States)
IPC IPC(8): G06F3/0484G06F3/0486G06T11/20
CPCG06F3/04847G06F3/0486G06F3/04842G06T11/206G06T2207/20072H04L43/045G06F40/18H04L67/535
Inventor STOKES, CHRISTOPHERMAAG, PETERO'BRIEN, TOMSHROFF, NAYTRIALBIN, MACIEJDABOVILLE, ALEXIS
Owner PALANTIR TECHNOLOGIES
Why Eureka
Try Eureka