

Hypothermic storage technology for biological material
a biological material and storage technology, applied in the field of hypothermic storage technology for biological materials, can solve the problems of biological material beginning to undergo a noticeable amount of deterioration, limited extension period, serious defects in existing technologies,
- Summary
- Abstract
- Description
- Claims
- Application Information
AI Technical Summary
Benefits of technology
Problems solved by technology
Method used
Image

Examples
example 1
Determination of the melting point depression
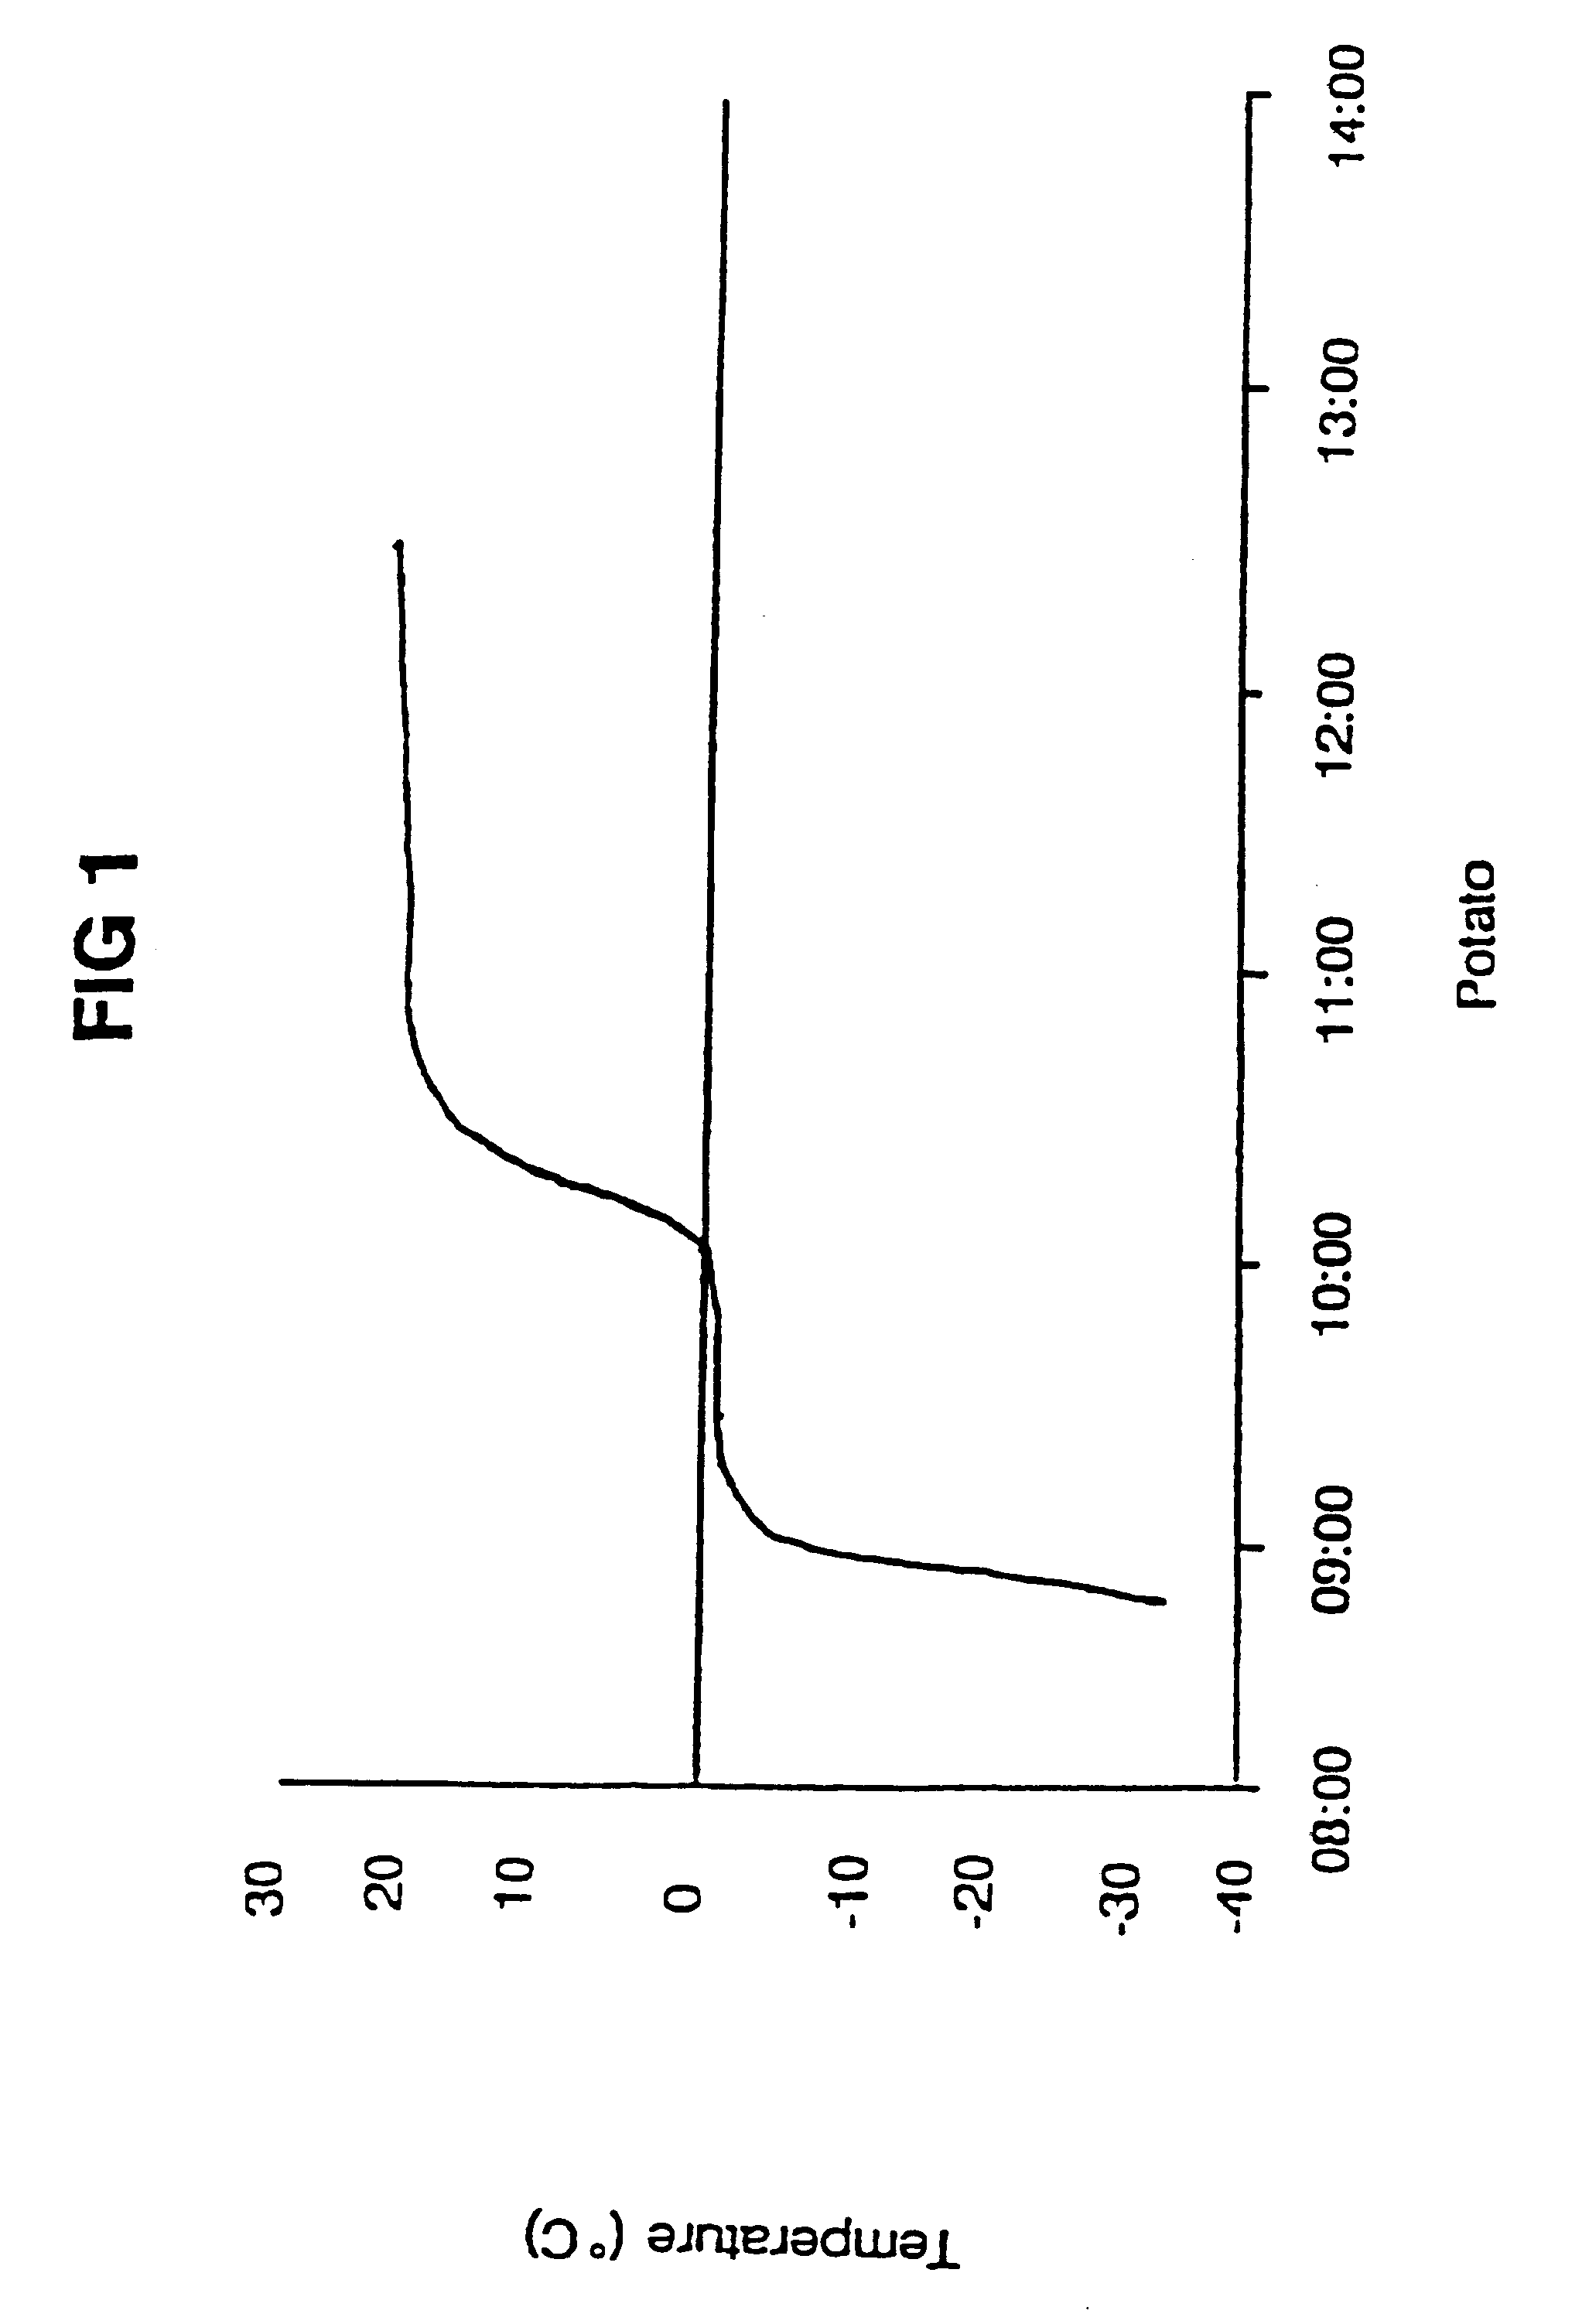
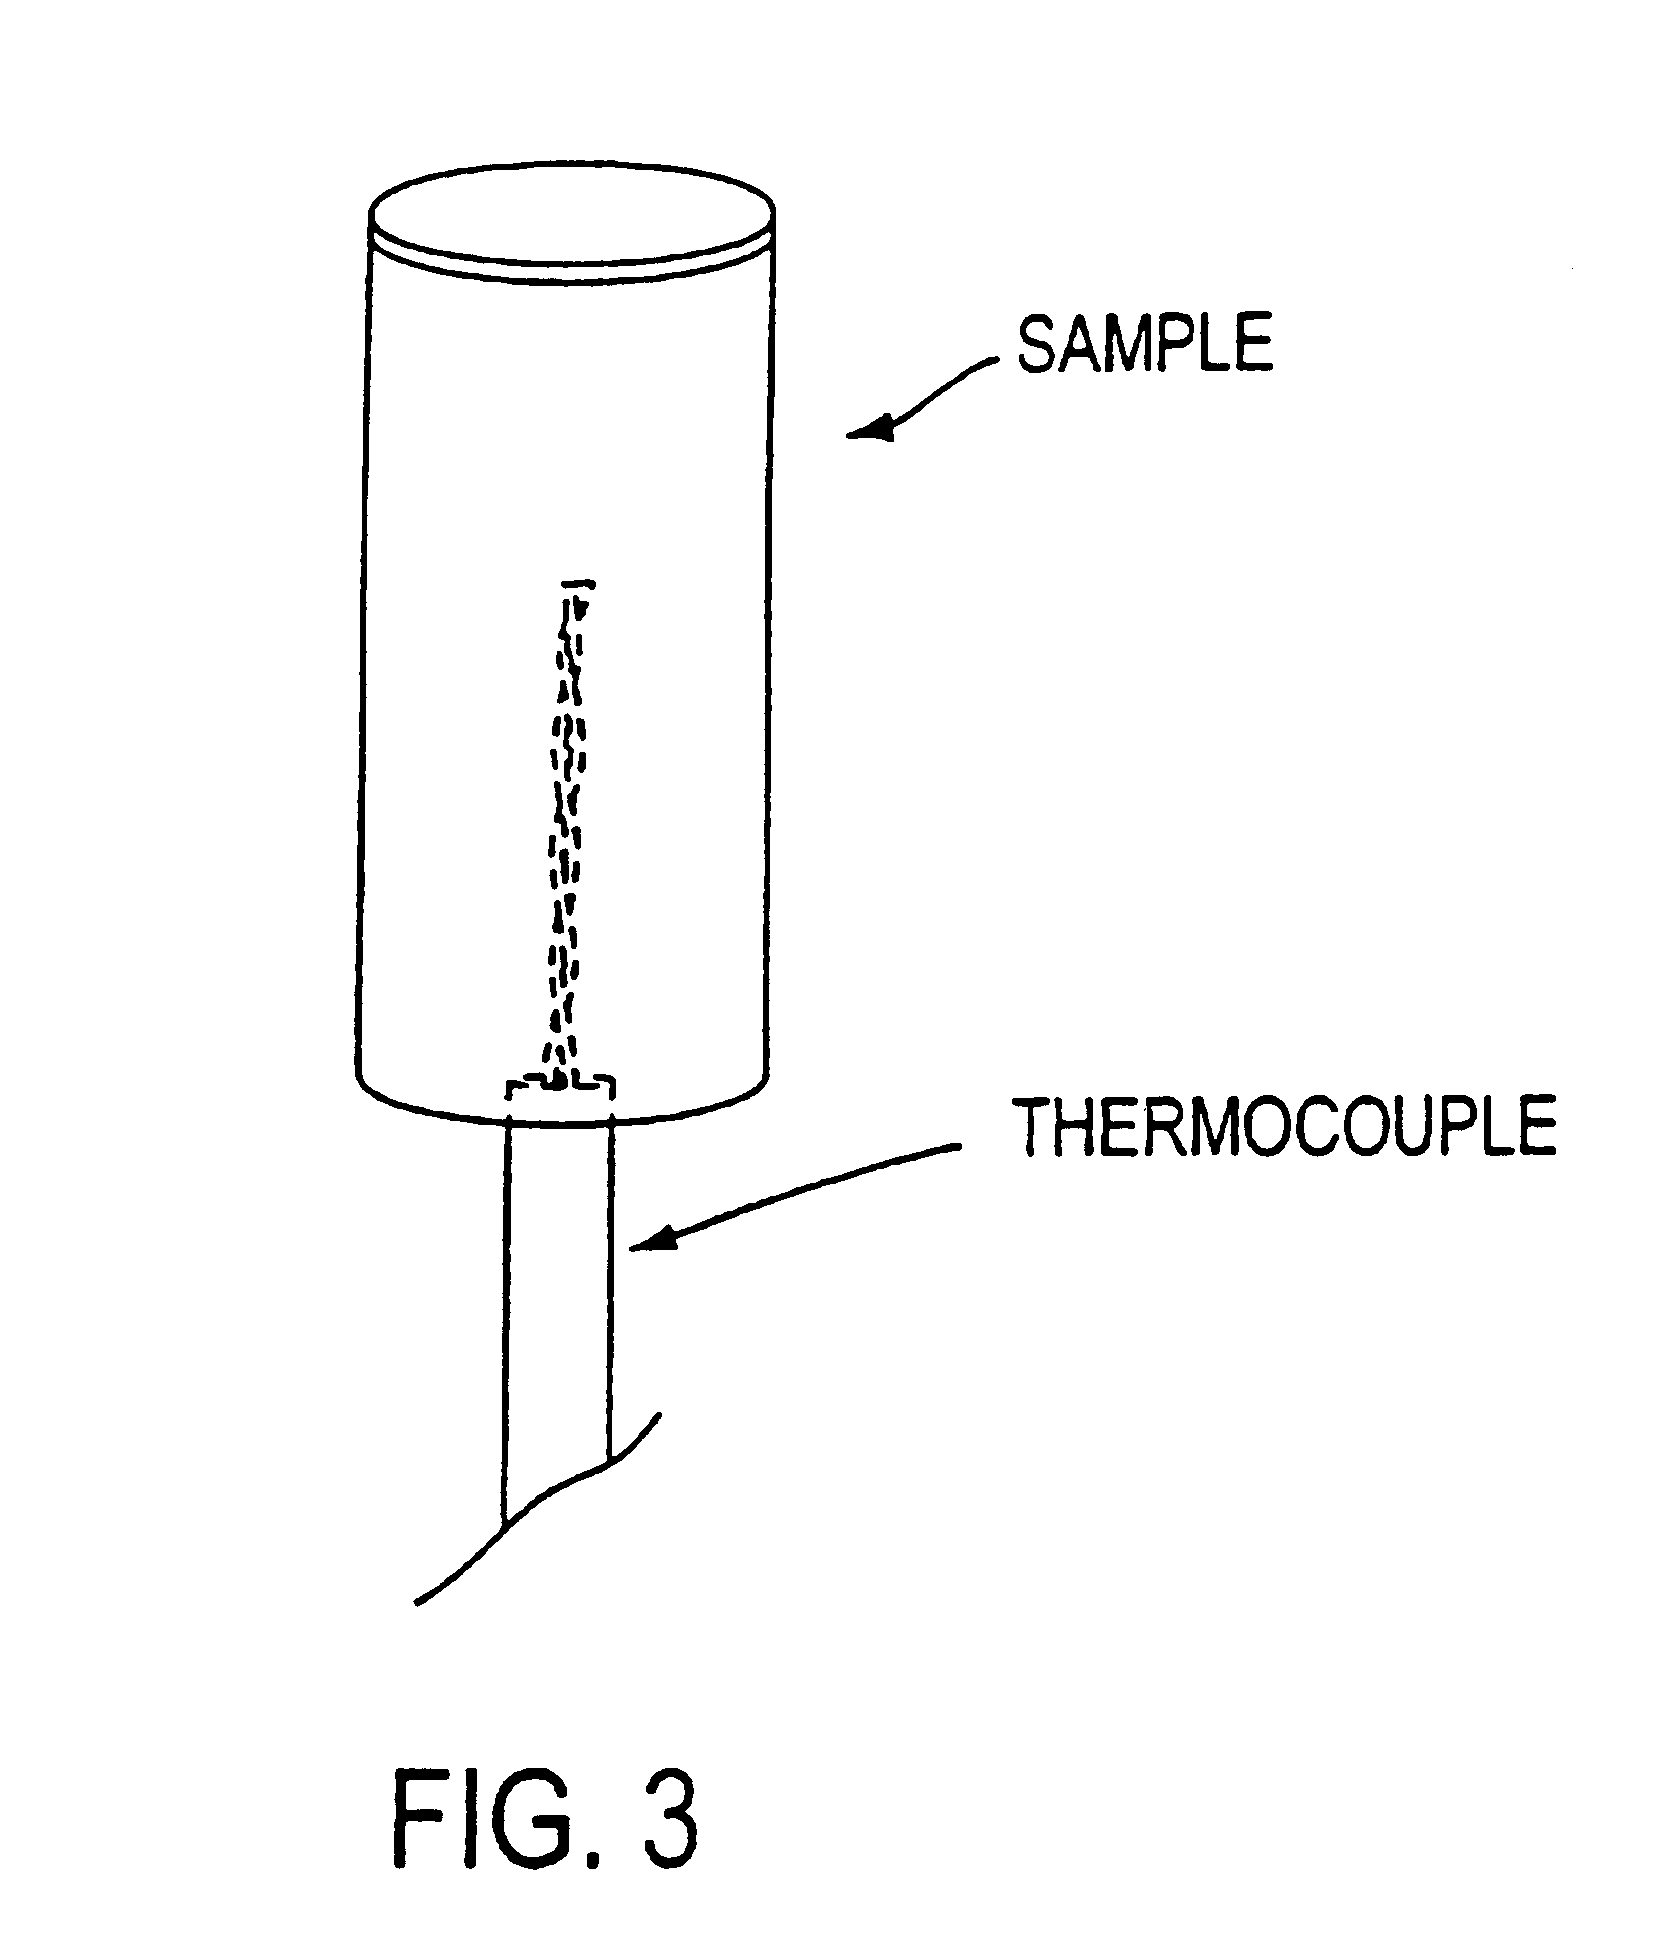
A 0.5 gram cylindrical tissue section is removed from the biological material. Type J thermocouples are inserted longitudinally into the center of the tissue section as shown in FIG. 3. The tissue sections are then placed inside Corning cryovials (3 Ml). The samples are then placed into an ultra-low temperature bath set at -30.degree. C., and the freezing exotherm is recorded. The thermocouples are connected to an eight-channel National Instruments Virtual Instrument (VI) configured for thermography. Initial signal processing and linearization are accomplished by an analog device's isolated linearized type J thermocouple input on a National Instruments back-plane. Three samples are run simultaneously from each biological material. After the samples equilibrate to -30.degree. C., the temperature in the bath is raised at 1.degree. C. per minute to 10.degree. C. The onset of melting temperature may be determined from the plot of temperature ...
example 2
Melting point depression determination by differential scanning calorimetry (DSC)
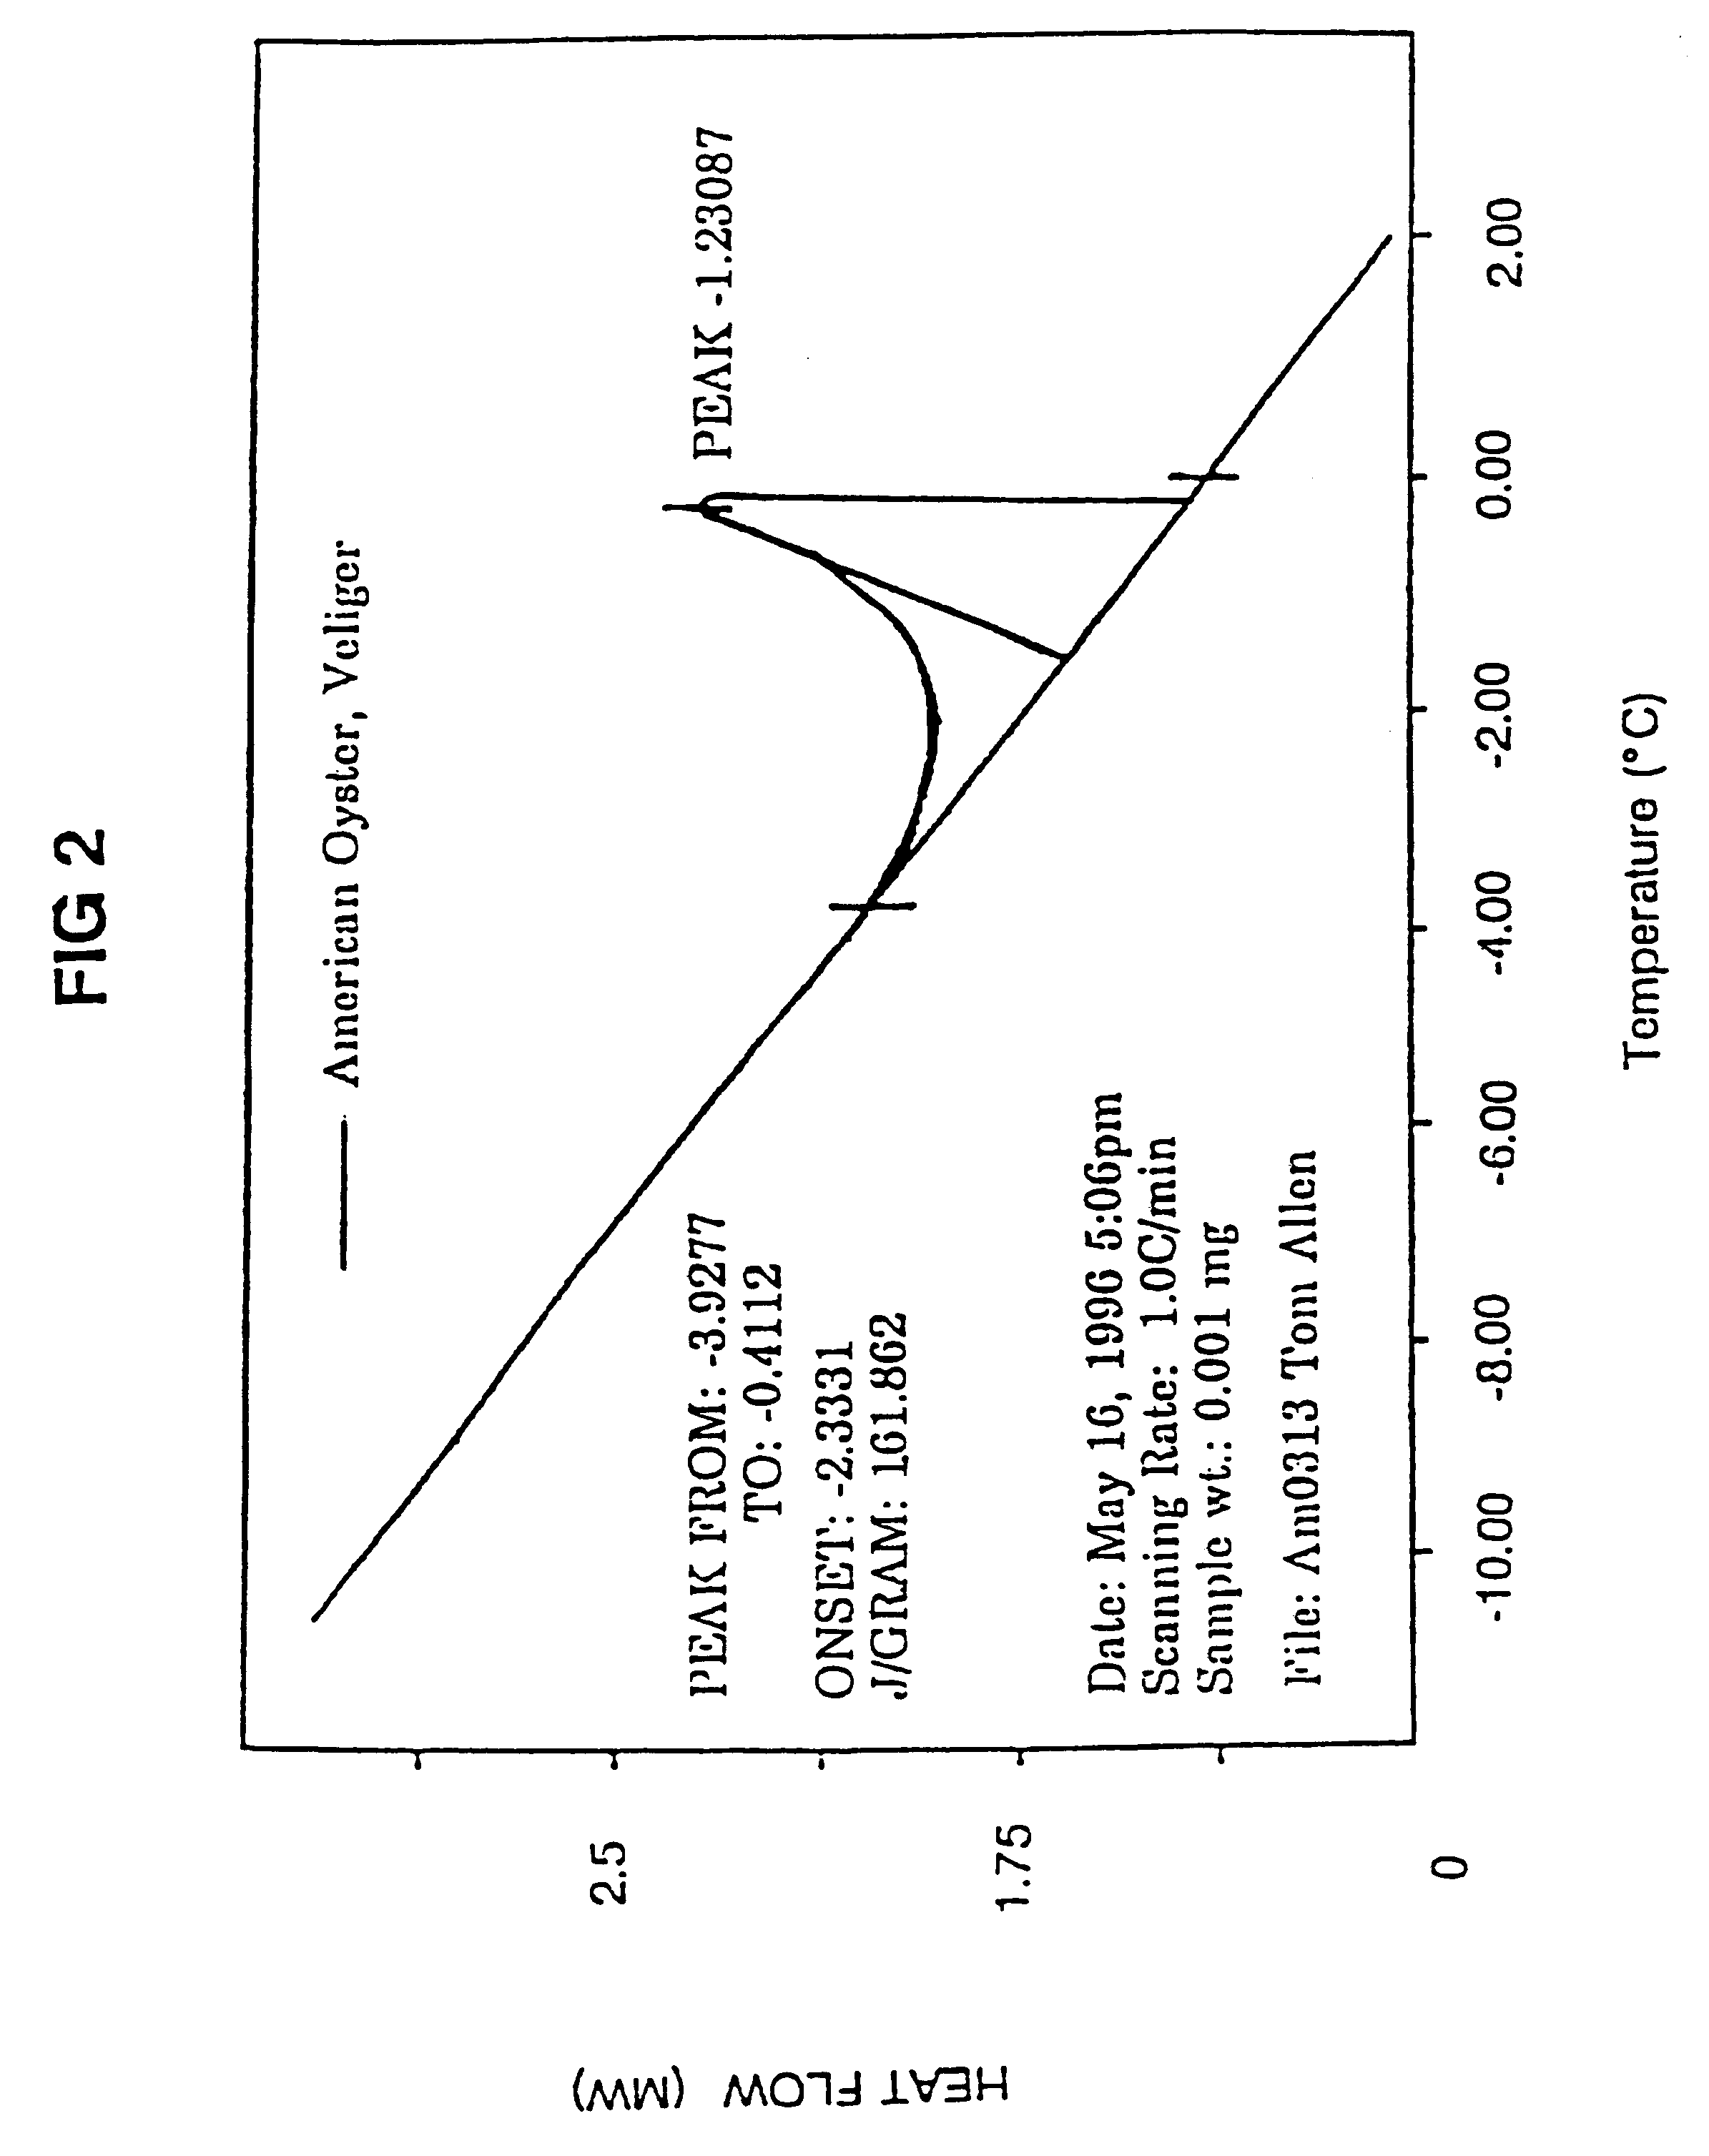
One individual is weighed and placed into a sample container, and the container is sealed. The specimen is placed in the sample side of the differential scanning calorimeter. The sample is cooled at 20.degree. C. per minute to -30.degree. C., and then is warmed at 1.degree. C. per minute to 10.degree. C. The heat flow into the sample as a function of the temperature of the sample is measured. As the sample approaches the melting point, there is an increase in the heat flow required to raise the temperature a given amount. This increase is a result of the fact that energy is required to change the state of the material from the solid state (frozen) to the liquid state (melted). A representative thermogram is presented in FIG. 2. With currently available technology, this technique permits the determination of the melting point depression to within a few ten thousandths of a degree C.
example 3
Melting point depression confirmation by isothermal cryomicroscopy
A 0.2 mm thick (frozen) thin section of tissue is taken from the sample to be analyzed. The section is placed inside a quartz crucible and covered with a cover slip. The crucible is placed inside a Linkam BCS 196 Cryostage on an Olympus BH2 microscope. The state of the microscope is controlled by a Linkam TMS 92 controller, LNP2 pump and interfaced to a p5 90 MHz computer using Linkam link 2 software running under windows 3.1. The sample is examined visually for shifts in the crystal lattice for 80 minutes at and below the onset temperature determined by thermography. The magnification of the microscope is set to 200X. The samples is cooled to -30.degree. C. at a rate of 20.degree. C. per minute. If necessary, the microscope stage may be opened and freezing may be nucleated. The sample is held at -30.degree. C. for 5 minutes, and then is warmed at 10.degree. C. per minute to a temperature approximately 2.degree. C. be...
PUM
 Abstract
Description
Claims
Application Information