General type visual chart
An eye chart, a universal technology, applied in medical science, eye testing equipment, diagnosis, etc., can solve the problems of inconvenient conversion, inconvenient use, and less than 5 meters, so as to achieve easy recording and statistical analysis, Strong fairness and high accuracy
- Summary
- Abstract
- Description
- Claims
- Application Information
AI Technical Summary
Problems solved by technology
Method used
Image
Examples
Embodiment 1
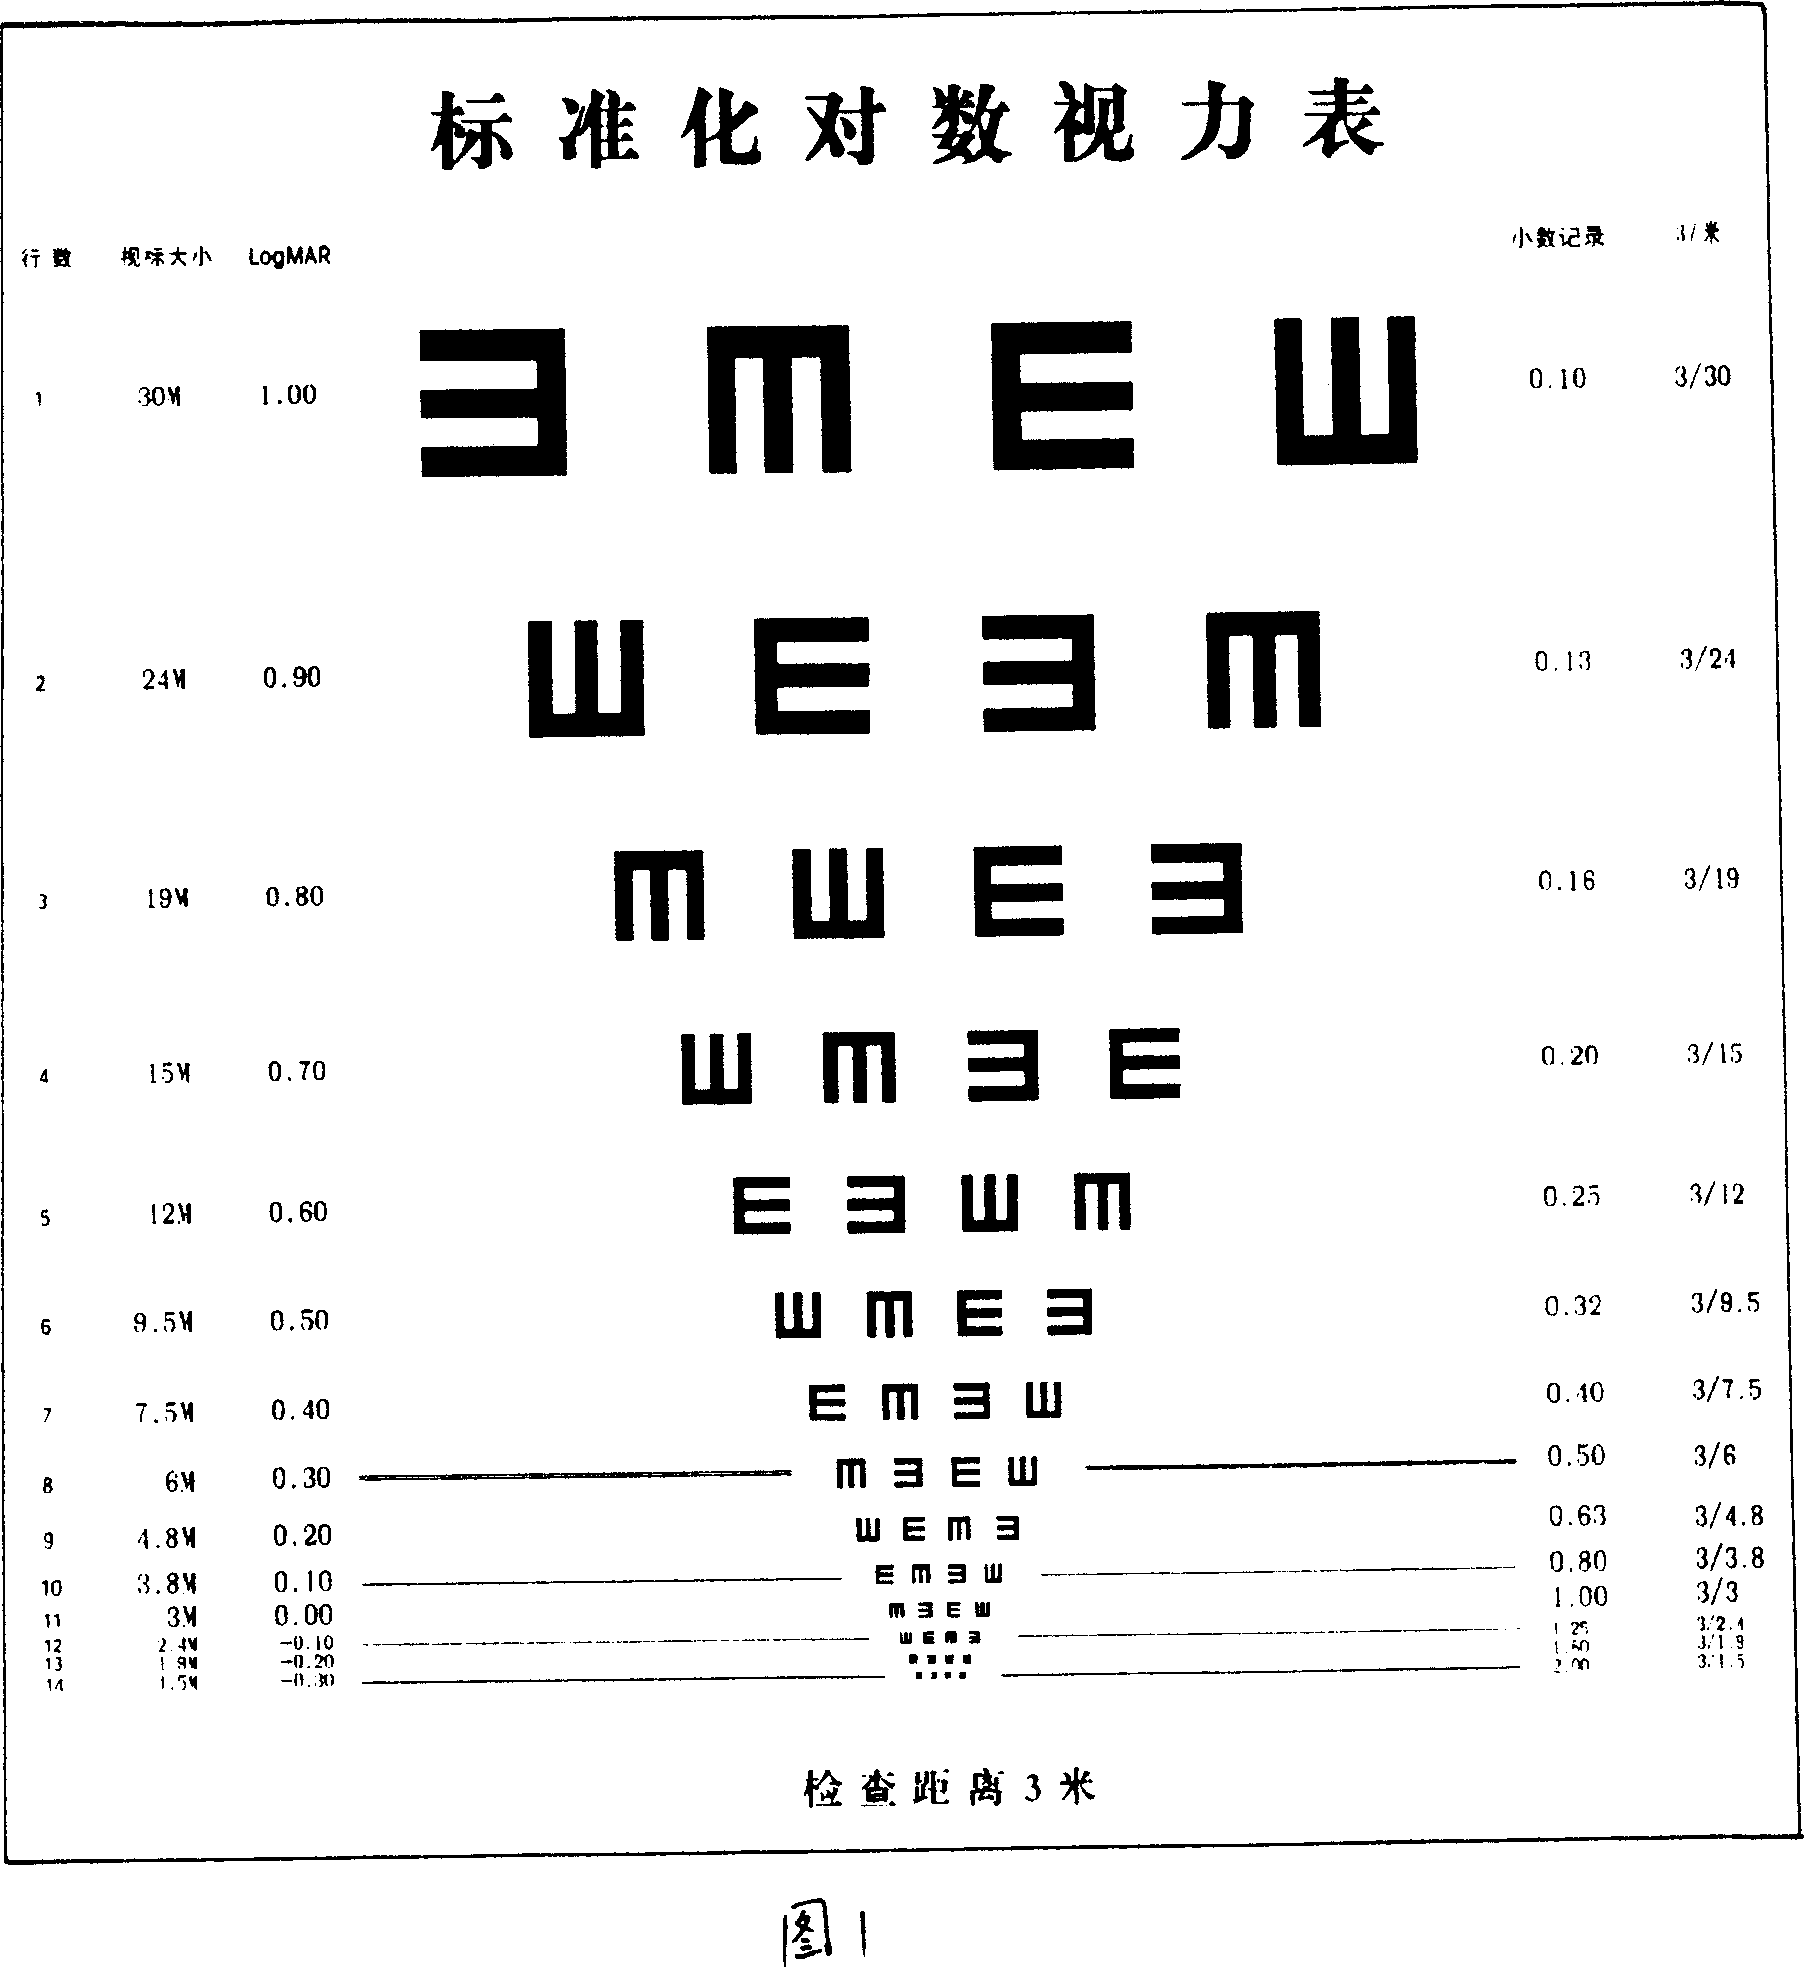
[0016] Embodiment 1, as shown in Figure 1, the 14 rows of E-shaped optotypes of the universal vision chart of the present invention are arranged from large to small from top to bottom along the vertical axis, and each optotype in each row is the same in size and equal in spacing. The size of the visual mark in adjacent rows is arranged according to the 10th root increase rate of 10. Each row is composed of 4 optotypes, which are up, down, left, and right, and their arrangement order in each row is irregular. The distance between each visual mark line and the next visual mark line is equal to the height of the visual mark in this line. The specified test distance is 3 meters. The corresponding decimal notation, logMAR notation and fractional notation values are marked on both sides of each row of optotypes. The visual acuity chart is also equipped with a conversion table for logMAR visual acuity and fractional visual acuity.
Embodiment 2
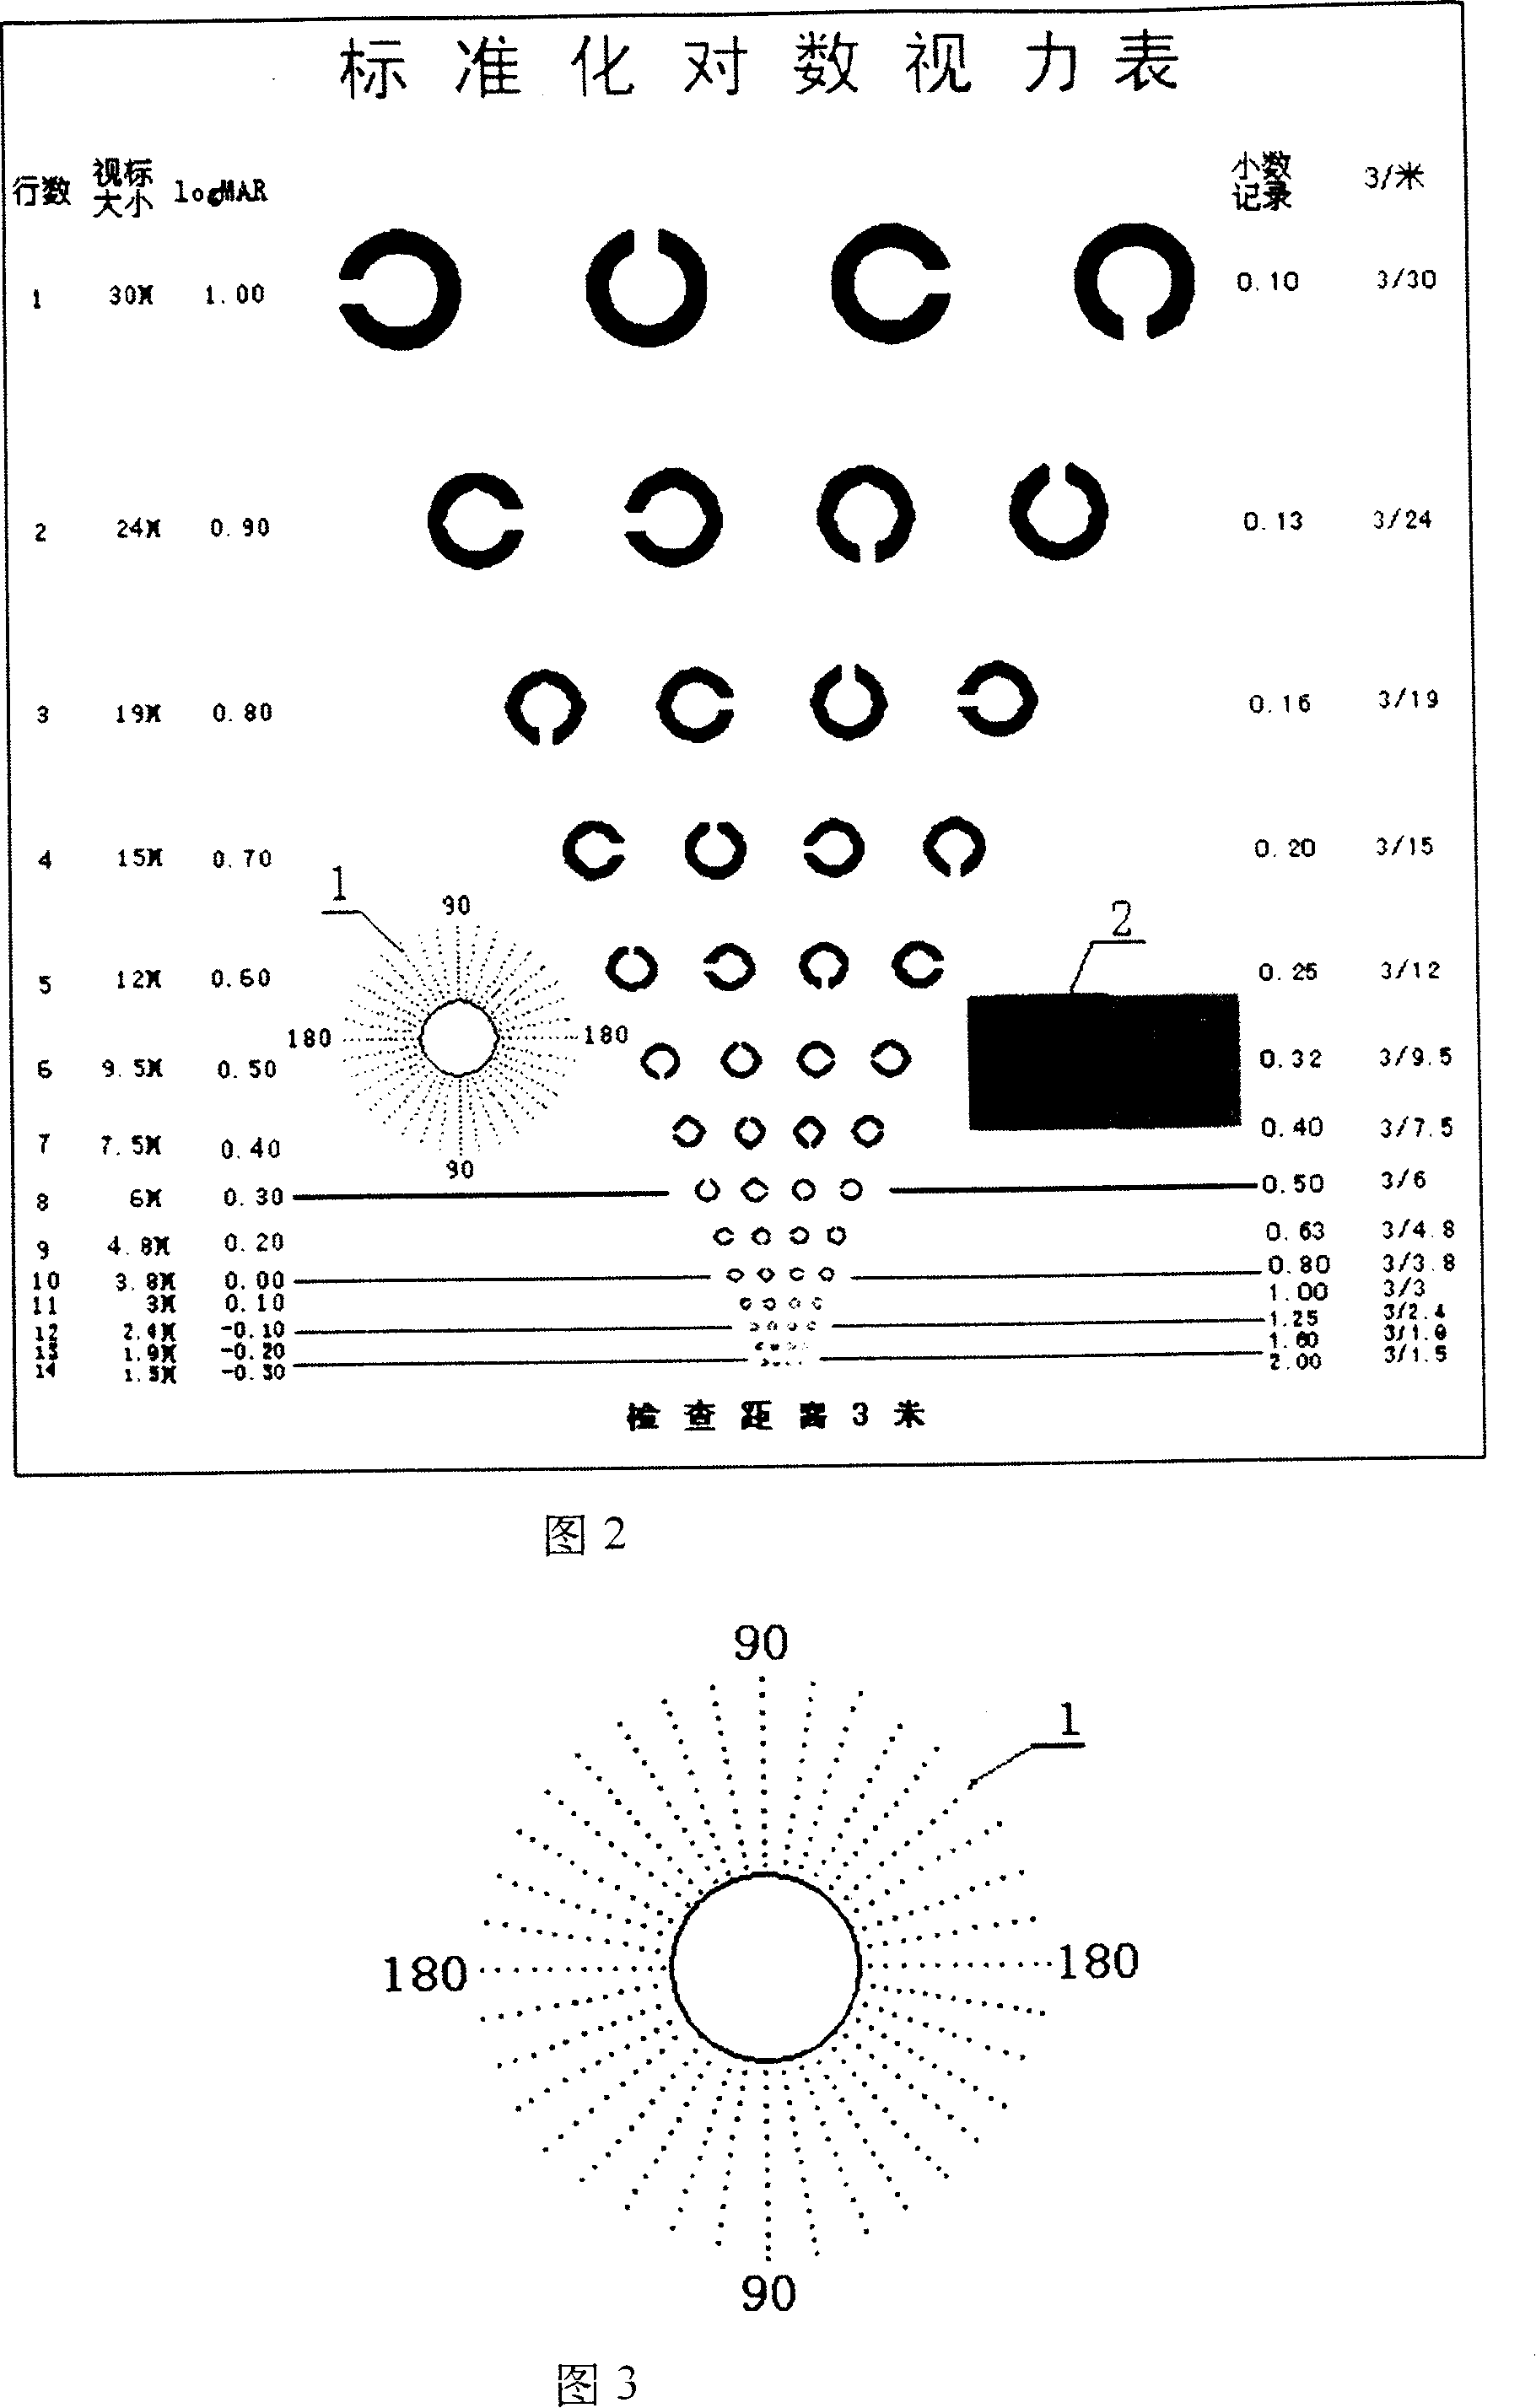
[0017] Embodiment 2, as shown in Figures 2 and 3, the 14 rows of C-shaped visual targets of the universal vision chart of the present invention are arranged from large to small from top to bottom along the vertical axis, and each visual target has the same size and spacing in each row. Equal, the size of the visual mark in adjacent rows is arranged according to the 10th root increase rate of 10. Each row is composed of 4 optotypes, which are up, down, left, and right, and their arrangement order in each row is irregular. The distance between each visual mark line and the next visual mark line is equal to the height of the visual mark in this line. The specified test distance is 3 meters. The corresponding decimal notation, logMAR notation and fractional notation values are marked on both sides of each row of optotypes. The visual acuity chart is also equipped with a conversion table for logMAR visual acuity and fractional visual acuity. An astigmatism detection meter (1) ...
PUM
 Abstract
Description
Claims
Application Information
 - R&D
- Intellectual Property
- Life Sciences
- Materials
- Tech Scout
- Unparalleled Data Quality
- Higher Quality Content
- 60% Fewer Hallucinations
Browse by: Latest US Patents, China's latest patents, Technical Efficacy Thesaurus, Application Domain, Technology Topic, Popular Technical Reports.
© 2025 PatSnap. All rights reserved.Legal|Privacy policy|Modern Slavery Act Transparency Statement|Sitemap|About US| Contact US: help@patsnap.com


