
Data diagram generating method and generating system

A technology of data charts and data reports, applied in the field of data charts, can solve the problems of reduced work efficiency, energy and time consumption of staff, and achieve the effect of improving work efficiency and saving time and energy

Inactive Publication Date: 2007-11-07
TENCENT TECH (SHENZHEN) CO LTD
View PDF0 Cites 8 Cited by
  • Summary
  • Abstract
  • Description
  • Claims
  • Application Information

AI Technical Summary

Problems solved by technology

[0007] However, companies with a certain scale generate a large number of data reports every day, generate a large number of data charts based on the data reports, and compare and analyze the mutation points of the data curves in each data chart one by one, which requires a lot of energy and time for the relevant staff. , leading to a reduction in work efficiency

Method used


Image

  • Data diagram generating method and generating system
  • Data diagram generating method and generating system
  • Data diagram generating method and generating system

Examples


Embodiment Construction

[0039] In order to make the above objects, features and advantages of the present invention more comprehensible, the present invention will be further described in detail below in conjunction with the accompanying drawings and specific embodiments.

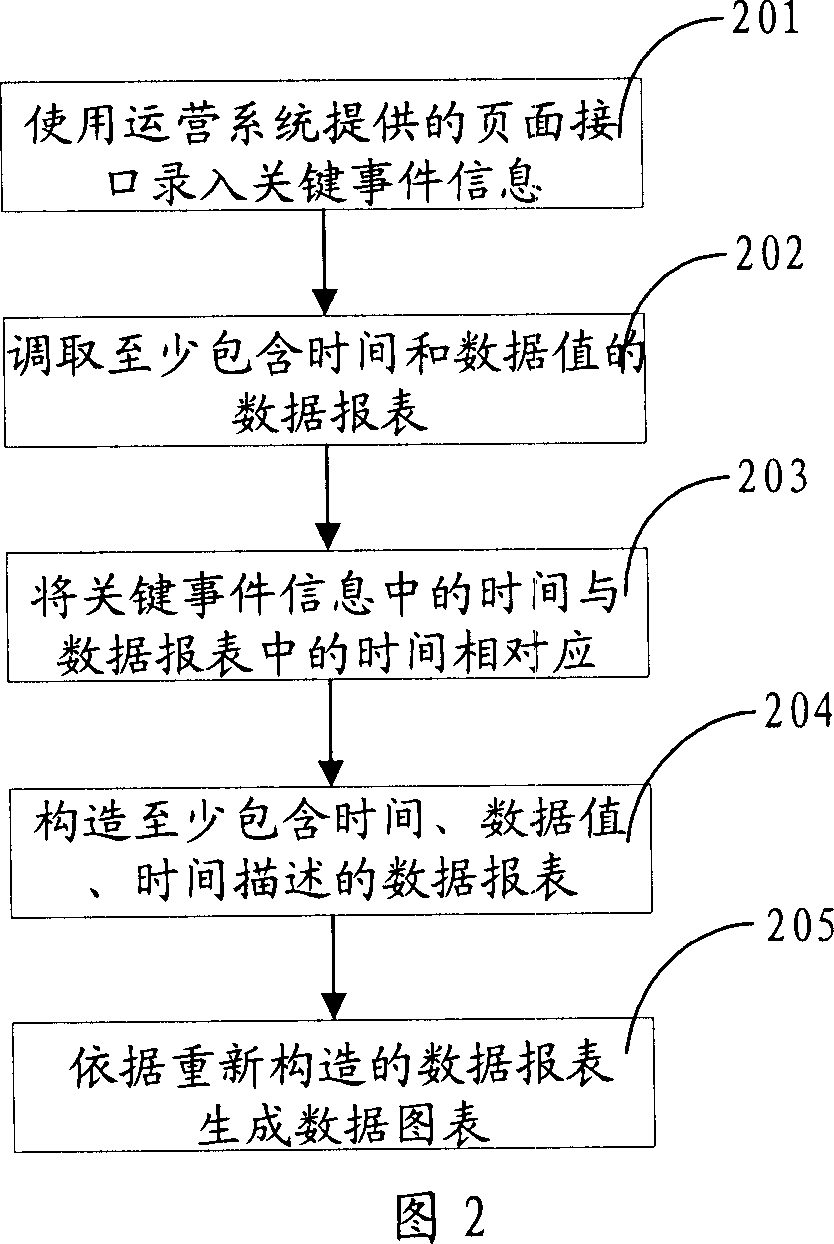
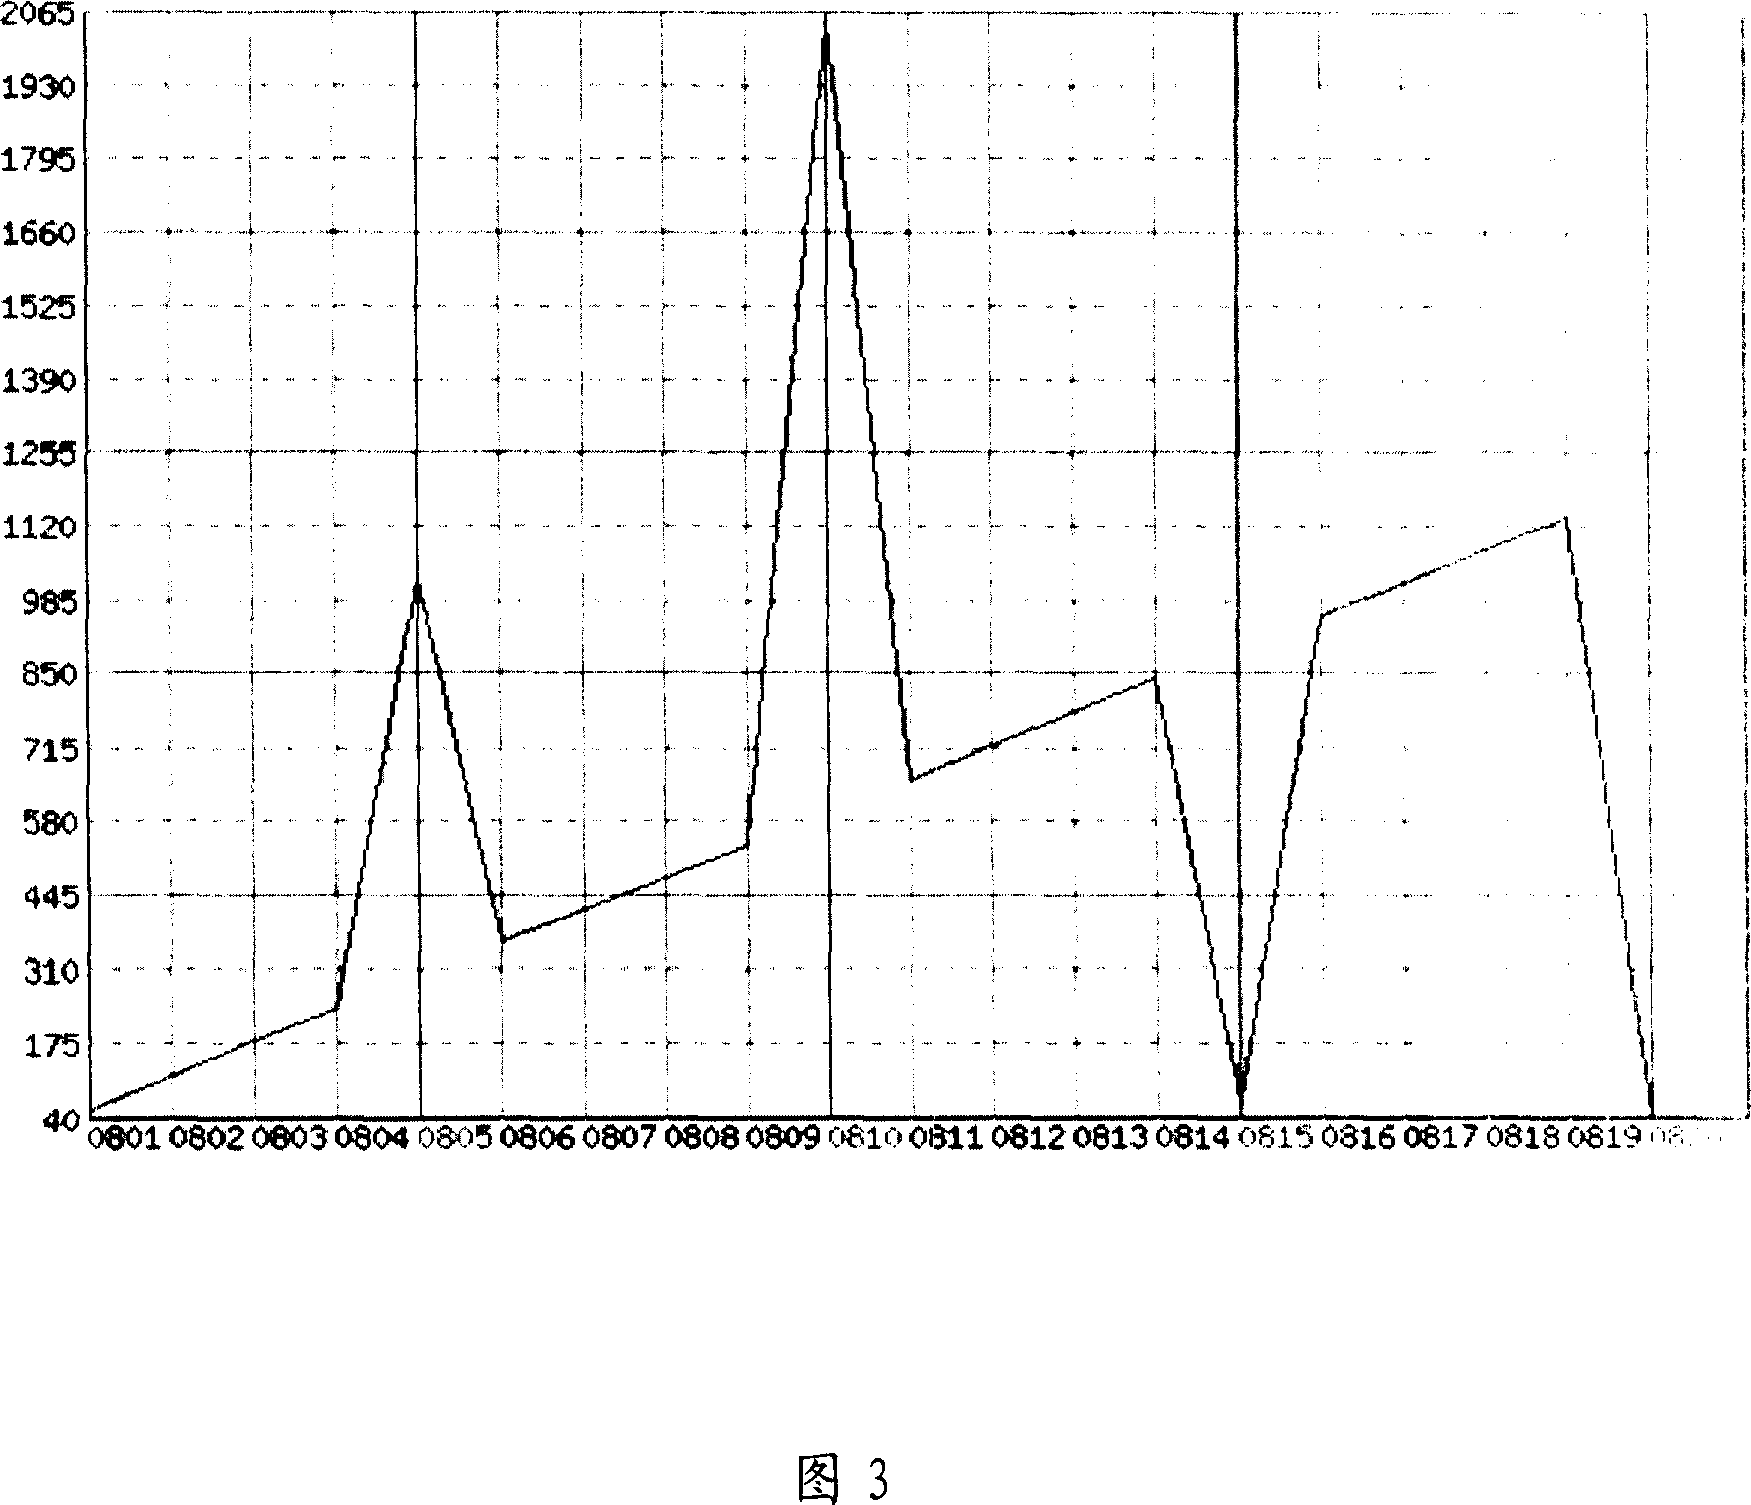
[0040] The core idea of ​​the present invention is to create a data chart including at least three-dimensional information of time, event description, and data value by establishing key event information including time and event description, and taking time as a reference. The event description in the key event information is directly displayed in the generated data chart. When the data graph in the data chart changes suddenly, the reason for the sudden change can be understood according to the corresponding event description. It can also be used to understand the impact of the key event on the data according to the change of the data graph when the key event occurs.

[0041] The key event information referred to in the present in...


PUM


Abstract

This invention discloses a generation method for data diagrams including: setting up key event information containing time and event description and data information containing at least time and data values, generating a data diagram containing at least time, event description and data values taking time as the primary standard. This invention also discloses a generating system of data diagrams, which displays the cause of sudden change of data directly.

Description

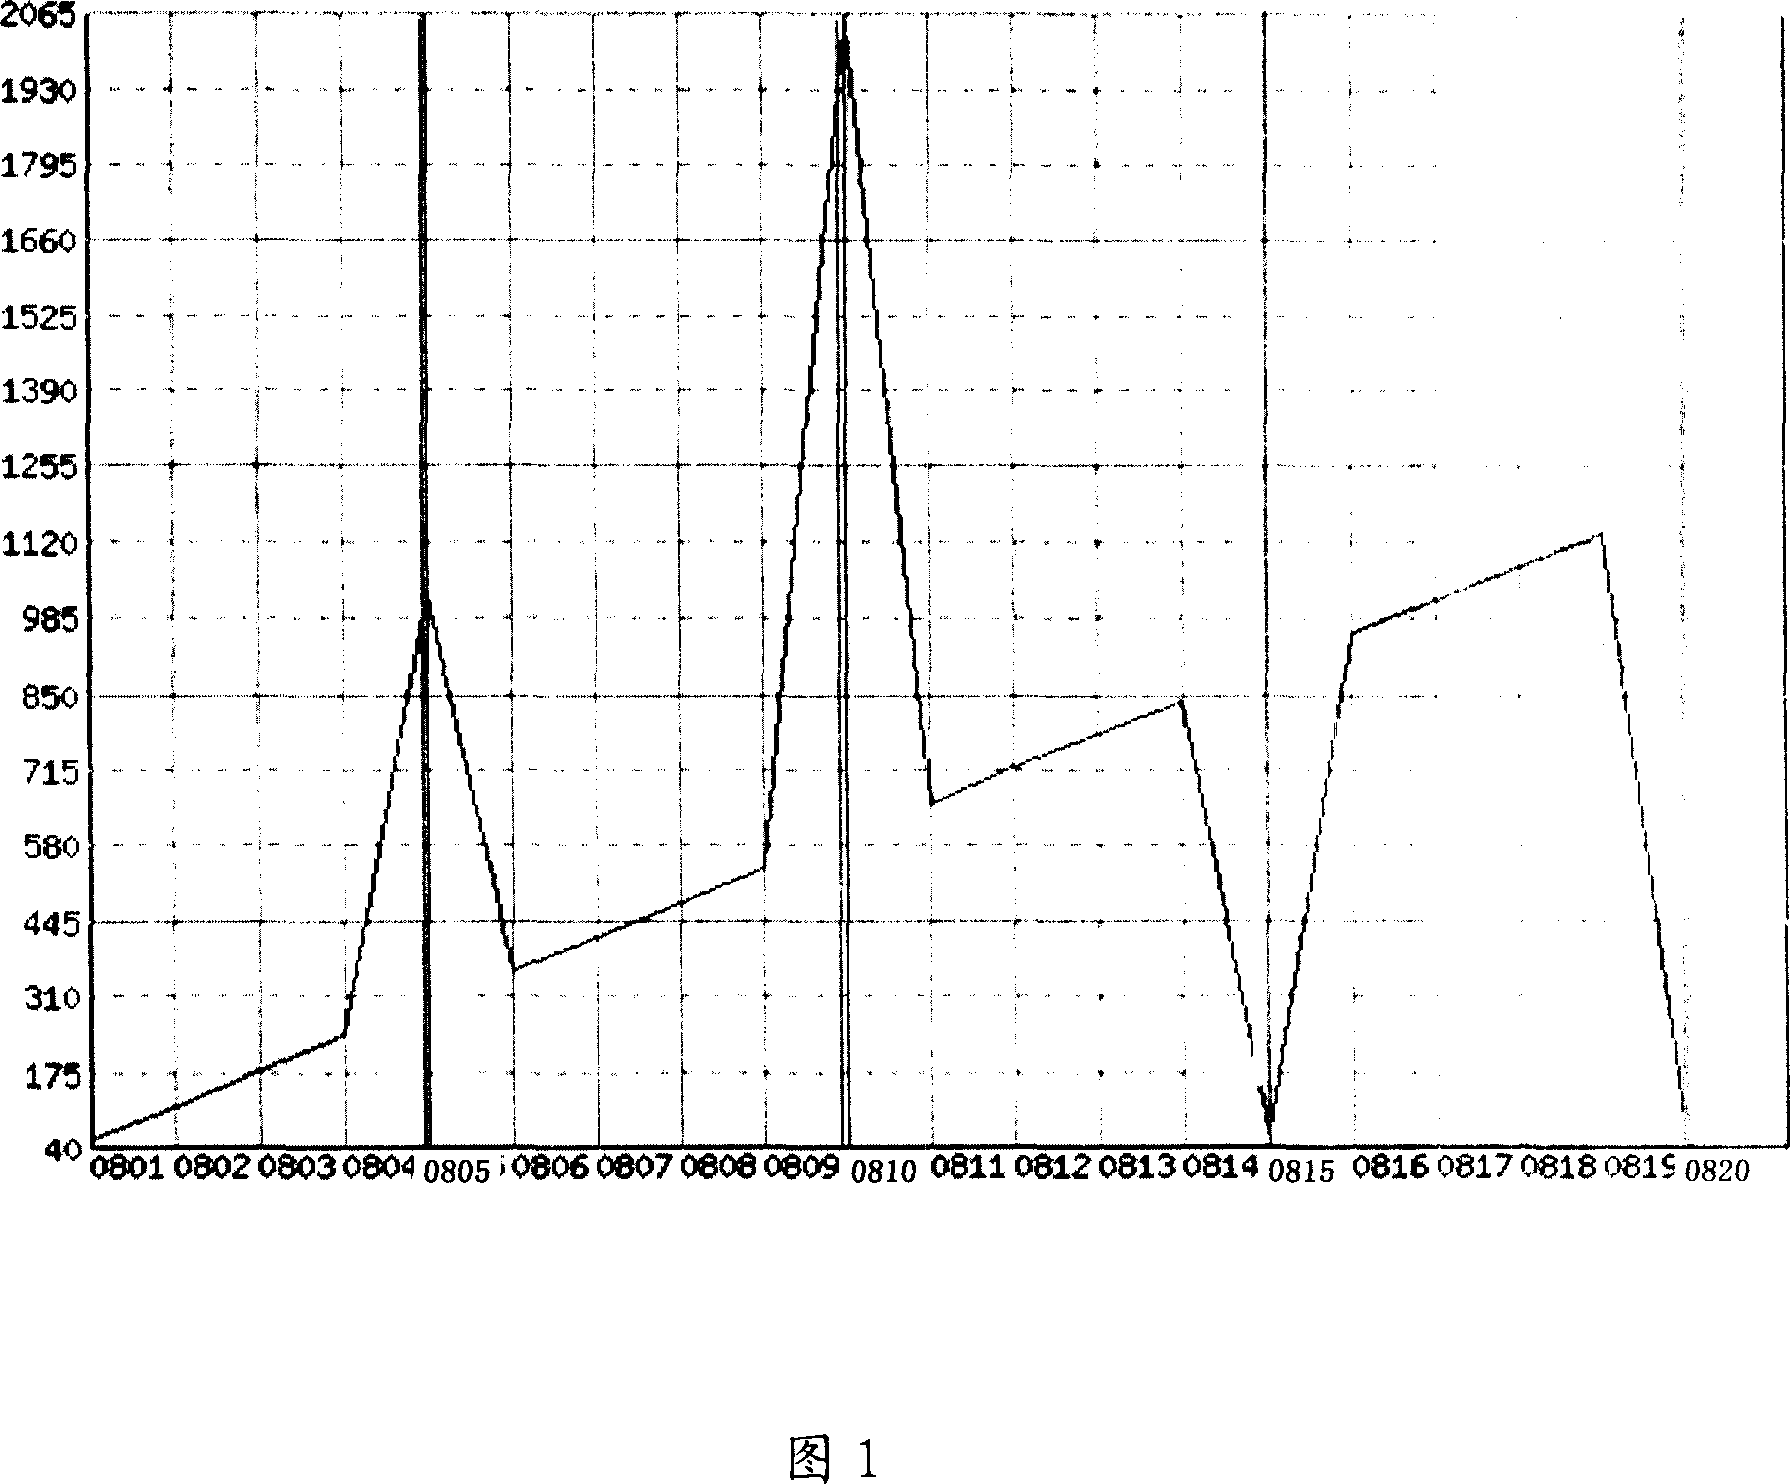
technical field [0001] The invention relates to the field of data charts, in particular to a method and system for generating data charts. Background technique [0002] Statistical related data is one of the most effective means for people to analyze things. A large amount of related data is summarized and classified to form a data report. According to the data in the report, the status and changes of things can be understood, but it is not vivid enough to intuitively understand the changing trend of affairs. Graphicalize the data in the report, and according to the high and low trend of the data curve in the graph, you can intuitively understand the development trend of the transaction. [0003] 08、01 08、02 08、03 08、04 08、05 08、06 08、07 08、08 08、09 08、10 40 100 175 275 985 375 410 500 550 2050 08、11 08、12 08、13 08、14 ...

Claims


Application Information

Patent Timeline
IPC IPC(8): G06Q10/00G06F17/30G06Q10/06
Inventor 周礼平周鑫汪琼
Owner TENCENT TECH (SHENZHEN) CO LTD
Learn More