Linear characteristic extracting method used for k nearest neighbour classification
A linear feature and k-nearest neighbor technology, which is applied in the direction of instruments, character and pattern recognition, computer components, etc., can solve the problem of not being able to determine the optimal classification dimension of the potential manifold, the disaster of dimensionality, and the high cost of computing and storage.
- Summary
- Abstract
- Description
- Claims
- Application Information
AI Technical Summary
Problems solved by technology
Method used
Image
Examples
Embodiment 1
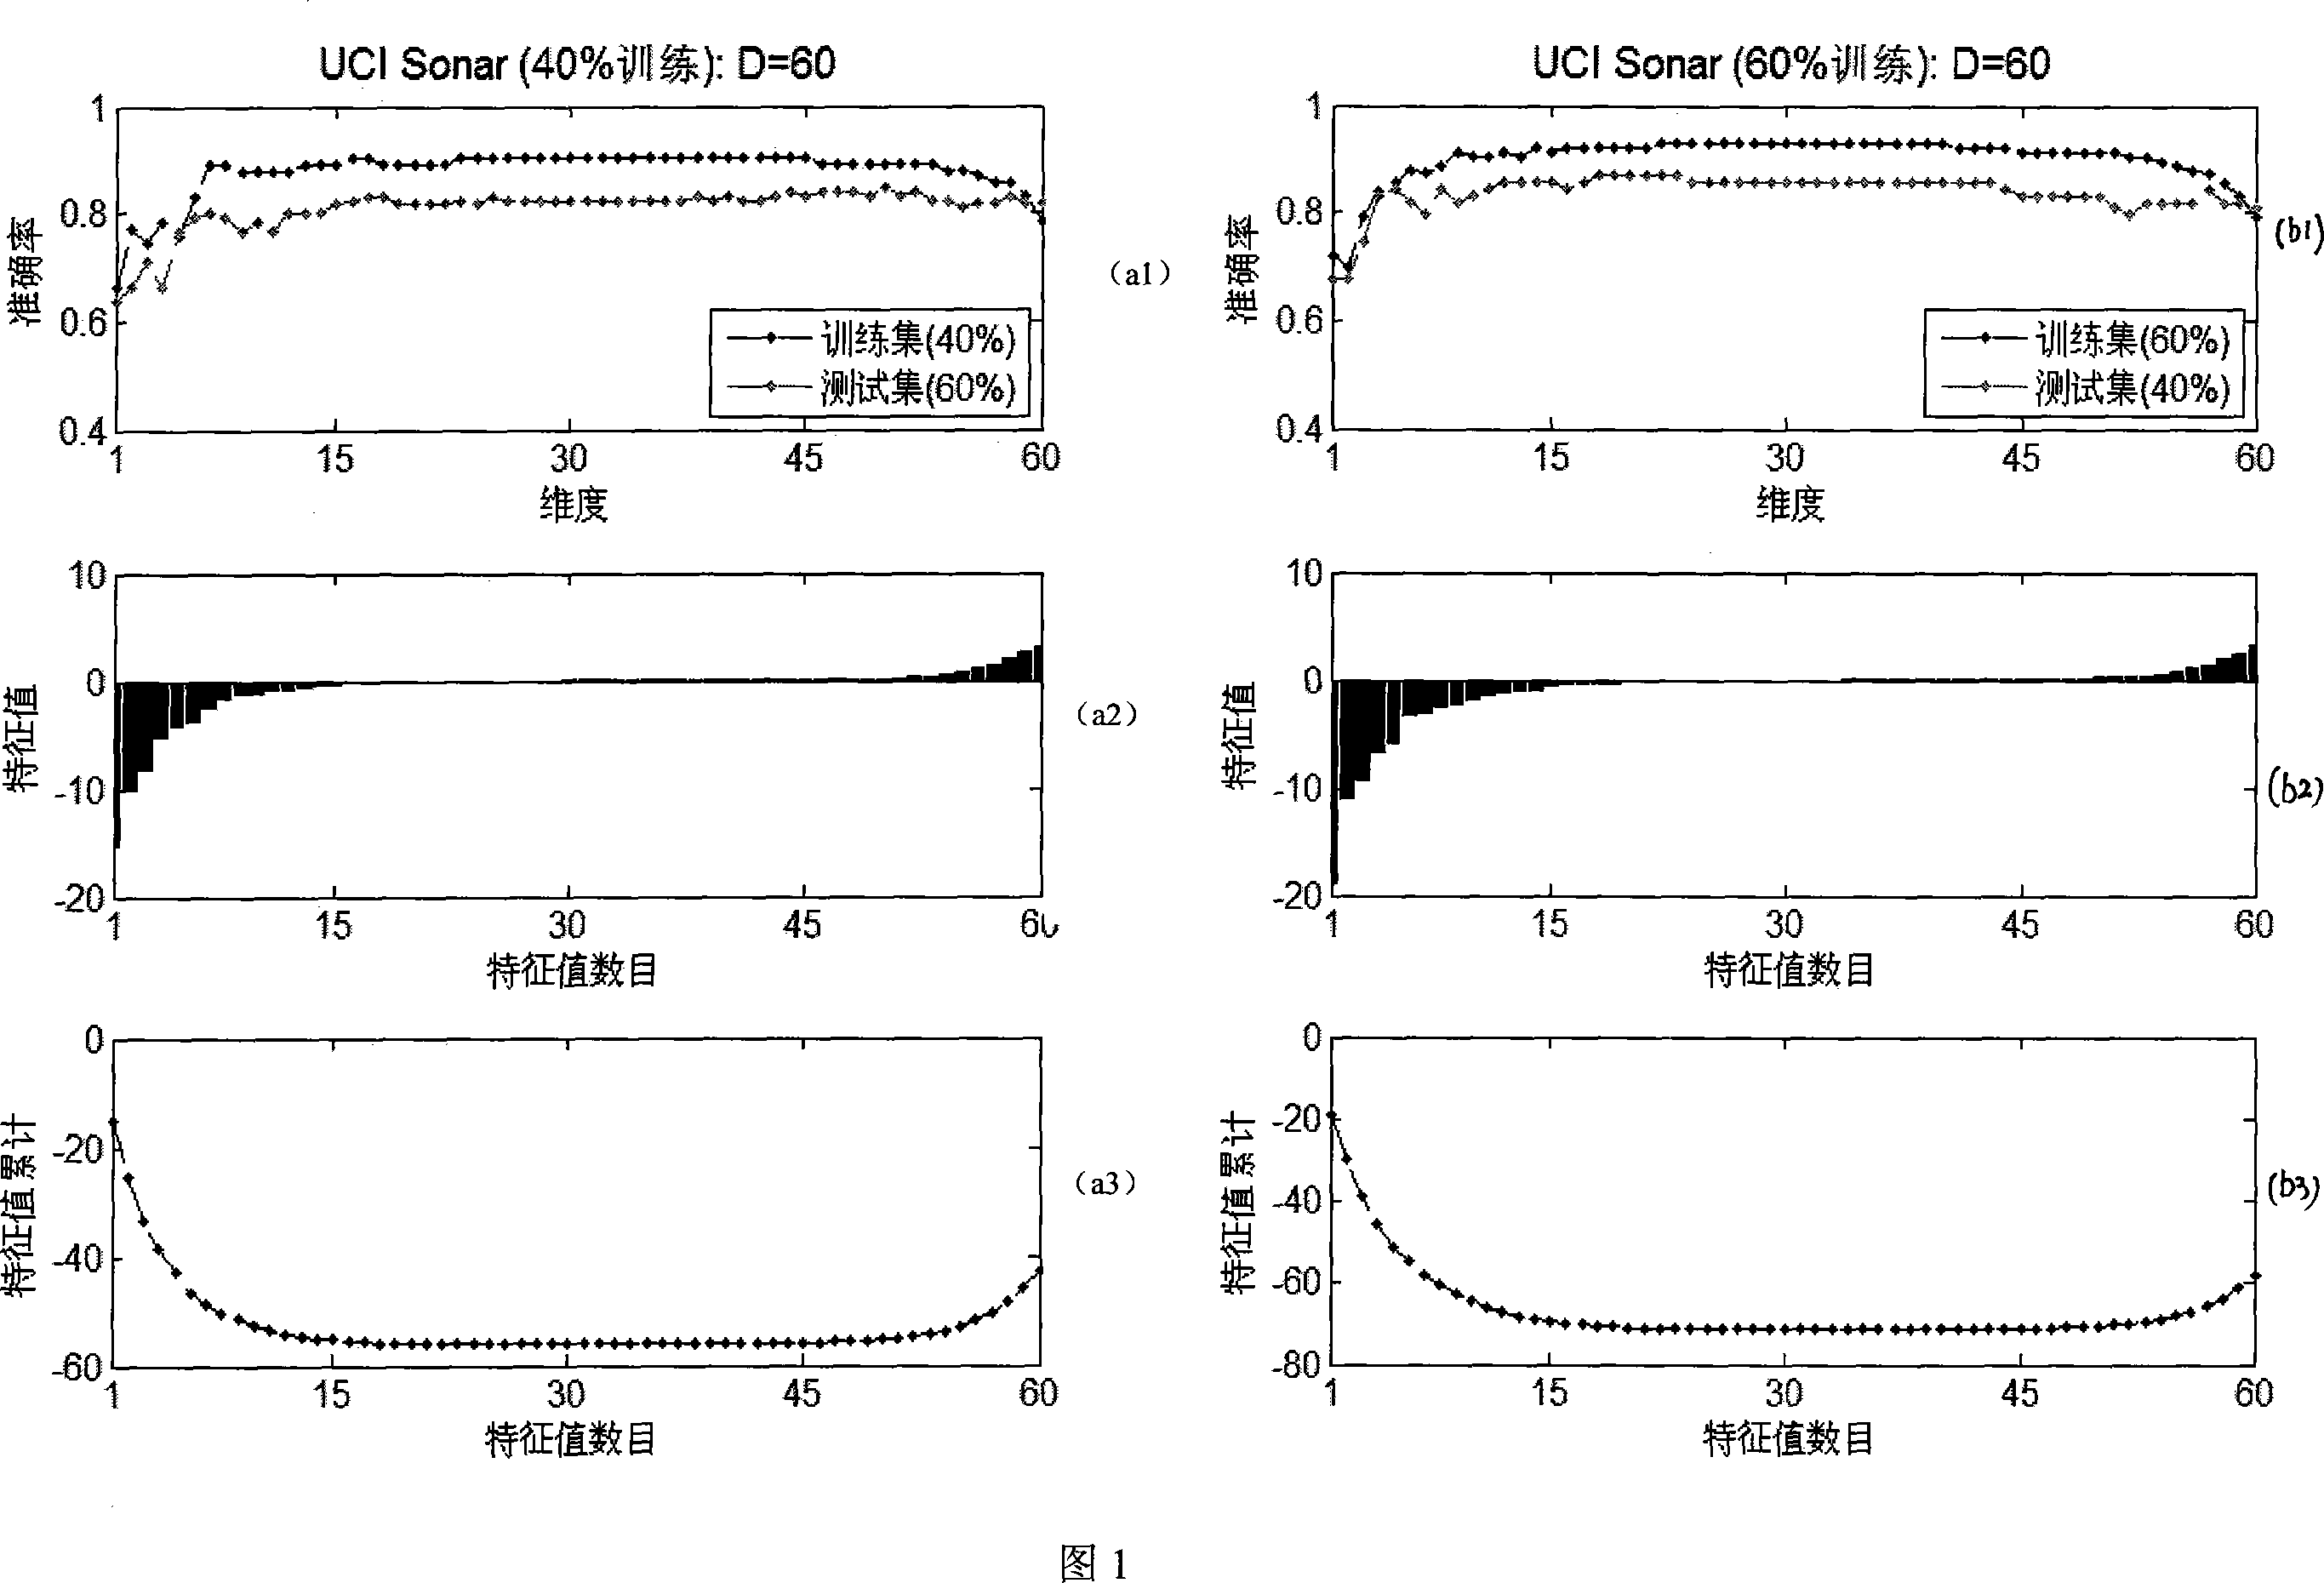
[0061] Embodiment 1: The application of the present invention on the UCI data set Sonar uses k-nearest neighbor classification as a classifier. For each data set, it is randomly divided into two subsets 40% and 60%, first 40% for training and 60% for testing; then 60% for training and 40% for testing. The training method is the calculation steps outlined above. During the test, the test space is transformed by using the linear mapping obtained on the training set, and the accuracy rate is calculated by the k-nearest neighbor classifier. The upper row shows a trend plot of classification accuracy as the number of dimensions increases. The middle and lower rows show the eigenvalues and their cumulative curves corresponding to this dimension. Figure 1 contains both the performance on the training set and the test set. The classification performance on the training set is obtained by leaving one out (Leave OneOut). From the figure, we can see that when the eigenvalue is less ...
Embodiment 2
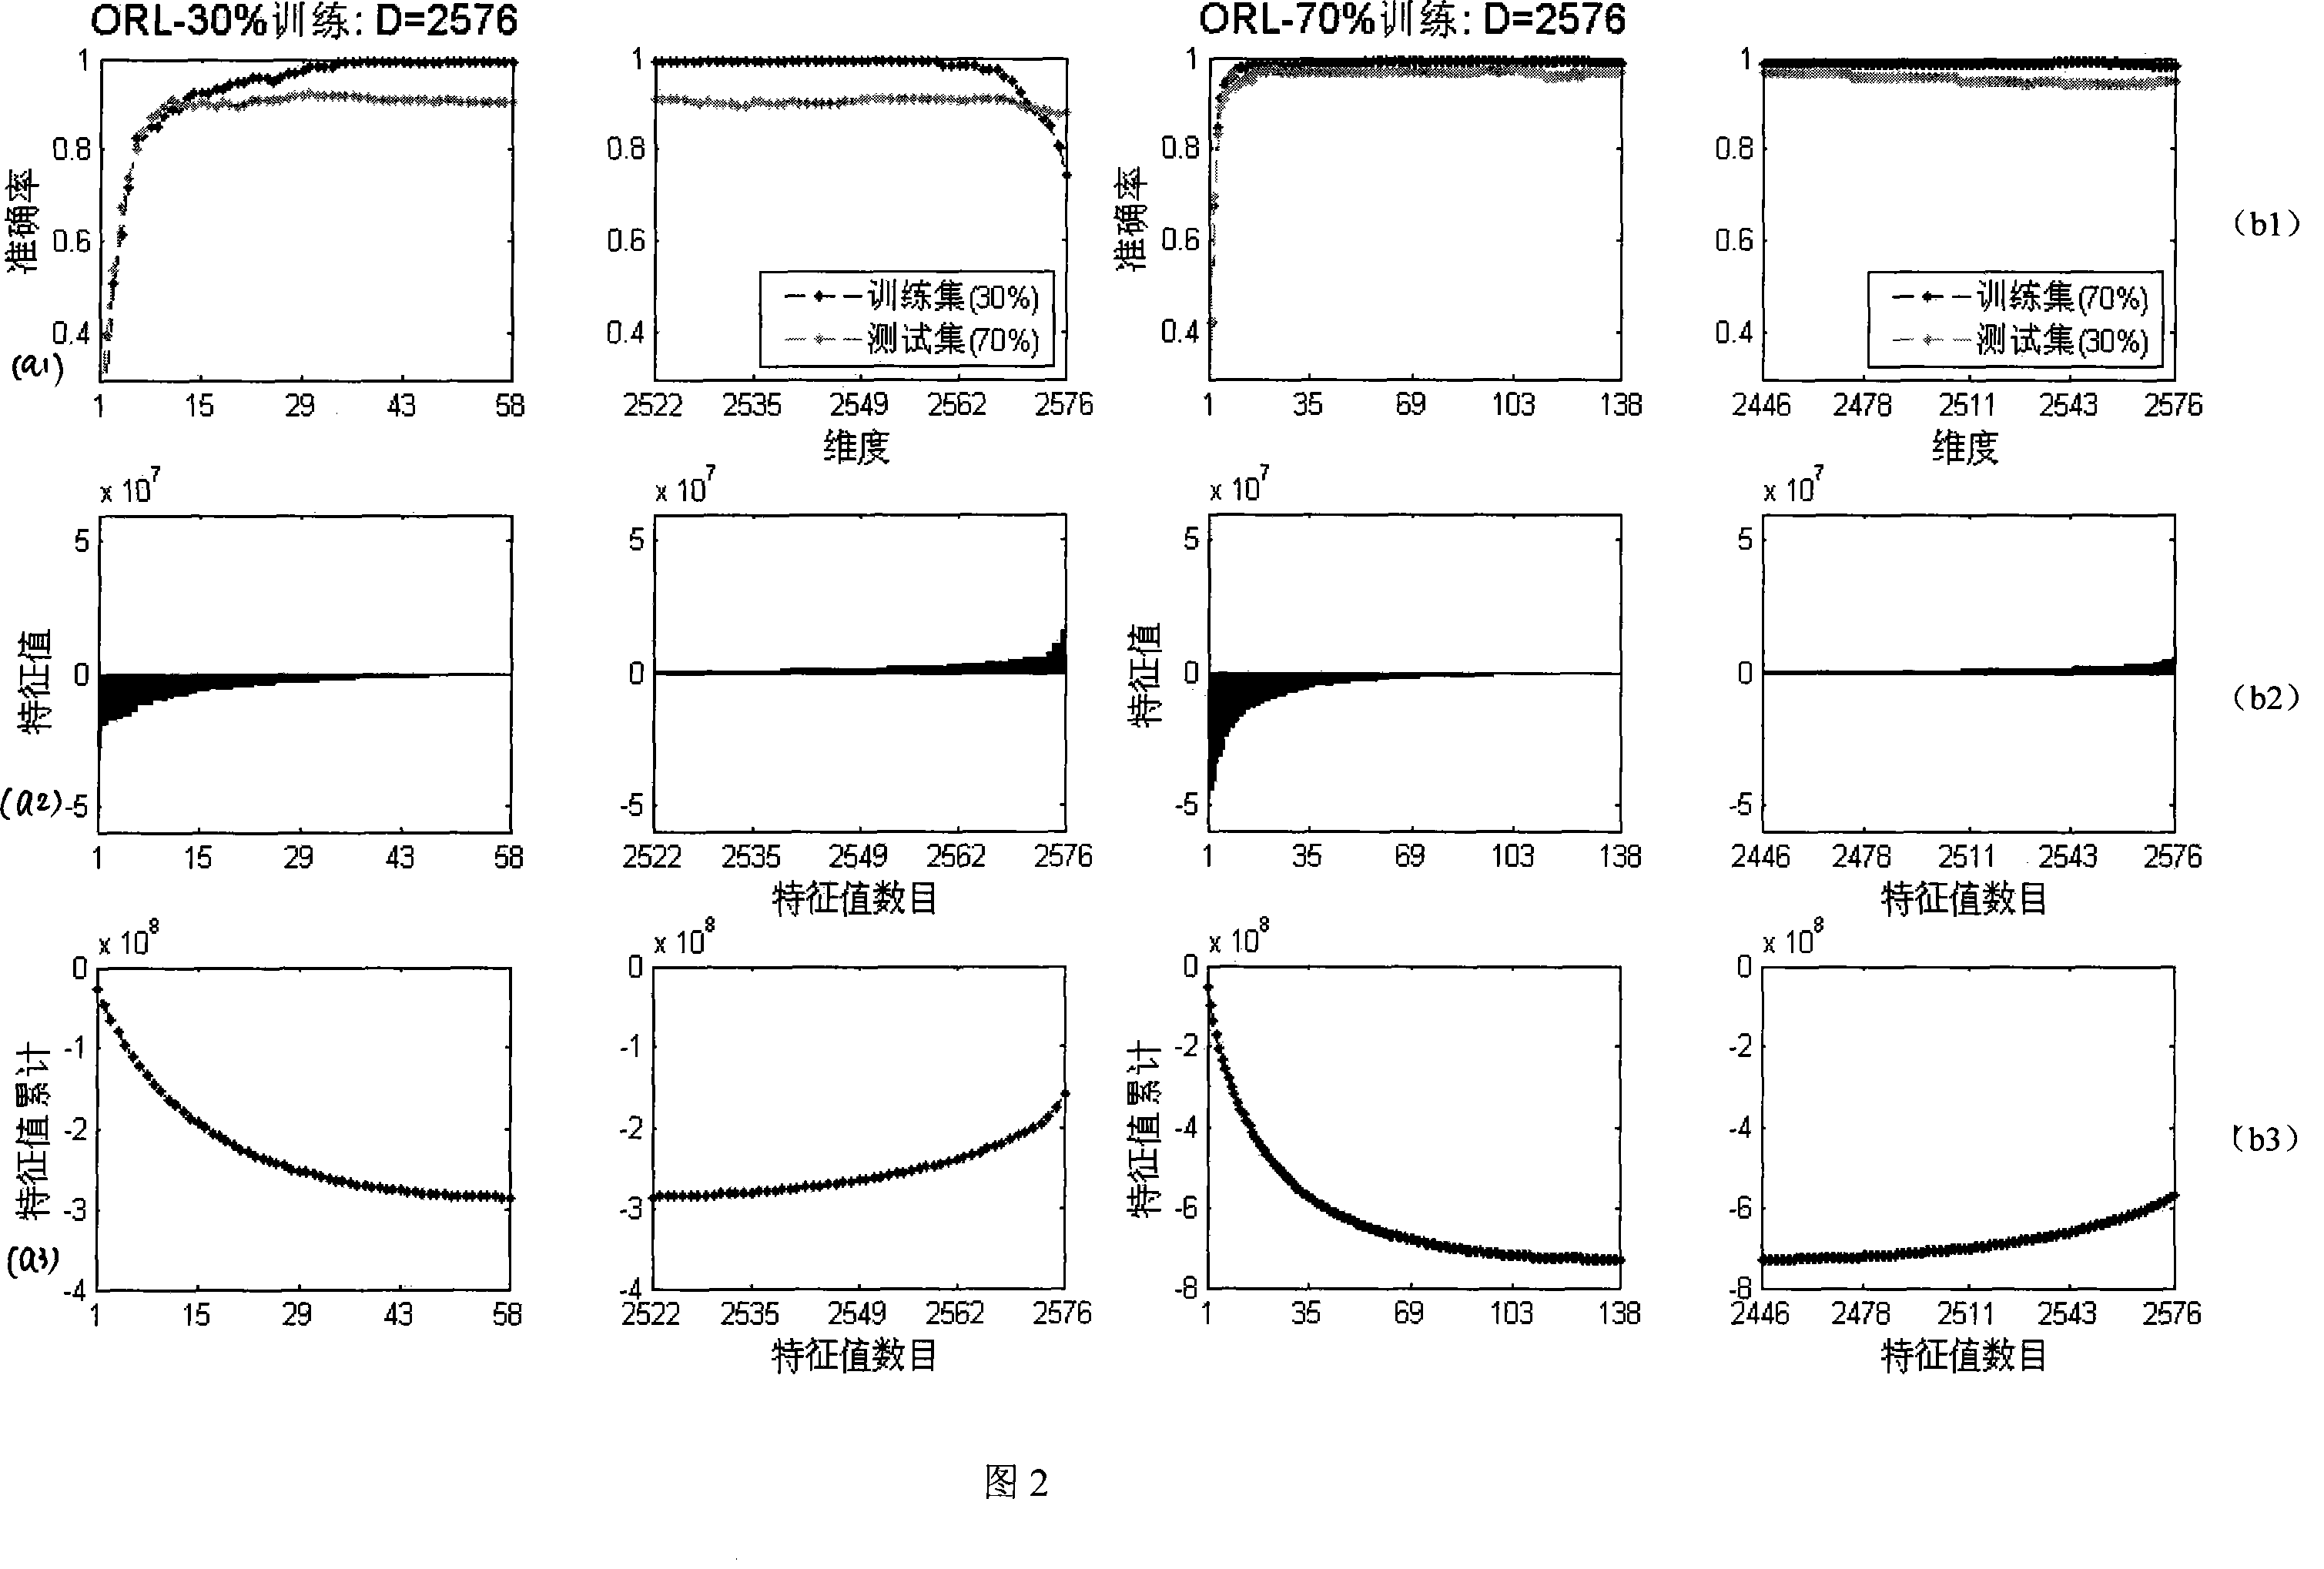
[0062] Embodiment 2: The application of the present invention on the ORL face data set uses k-nearest neighbor classification as a classifier. The UMIST face dataset contains 40 people, that is, 40 categories. For each class, we randomly select p samples for training, totaling 40p. Since the input image size is 56*46, the original space dimension is 2576, and the number of zero feature values exceeds 2000. Because when the eigenvalue is zero, the classification accuracy has tended to be stable. For clarity, we display the negative eigenvalue and positive eigenvalue parts in a pair of graphs, and the part corresponding to the zero eigenvalue is not shown in the graph. Also from Figure 2 we can see that when the eigenvalue is less than 0, as the dimension increases, the classification accuracy rate increases; when the eigenvalue is close to 0, the classification accuracy rate tends to be stable; when the eigenvalue is greater than 0 When , increasing the dimension not only d...
PUM
 Abstract
Description
Claims
Application Information
 - R&D
- Intellectual Property
- Life Sciences
- Materials
- Tech Scout
- Unparalleled Data Quality
- Higher Quality Content
- 60% Fewer Hallucinations
Browse by: Latest US Patents, China's latest patents, Technical Efficacy Thesaurus, Application Domain, Technology Topic, Popular Technical Reports.
© 2025 PatSnap. All rights reserved.Legal|Privacy policy|Modern Slavery Act Transparency Statement|Sitemap|About US| Contact US: help@patsnap.com


