Method for visualizing multi-dimensional time sequence information

A multi-dimensional and time-series technology, applied in special data processing applications, instruments, electrical digital data processing, etc., can solve the problems of cumbersome and complex operations, inability to reflect the multi-dimensional distribution characteristics of data records, and high time complexity of algorithms, so as to achieve high execution efficiency , easy to understand, and reduce the effect of time complexity

Inactive Publication Date: 2010-06-02
NAT UNIV OF DEFENSE TECH
View PDF0 Cites 30 Cited by
  • Summary
  • Abstract
  • Description
  • Claims
  • Application Information

AI Technical Summary

Problems solved by technology

The use of these methods requires a professional background in a specific application field, and the visual view cannot reflect the multi-dimensional distribution characteristics of data records, and the algorithm has high time complexity and cumbersome and complicated operations

Method used


Image

  • Method for visualizing multi-dimensional time sequence information
  • Method for visualizing multi-dimensional time sequence information
  • Method for visualizing multi-dimensional time sequence information

Examples


Embodiment Construction

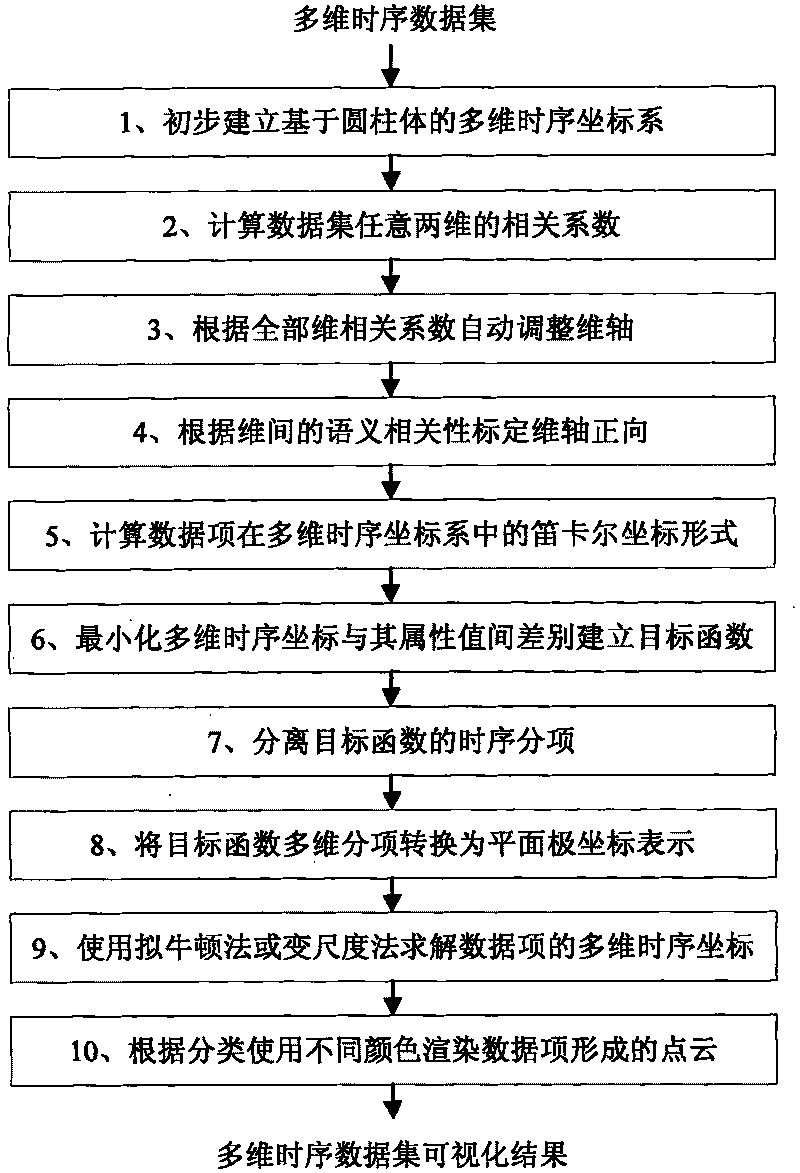
[0037] figure 1 It is an overall flow chart of the present invention. Specific steps include:

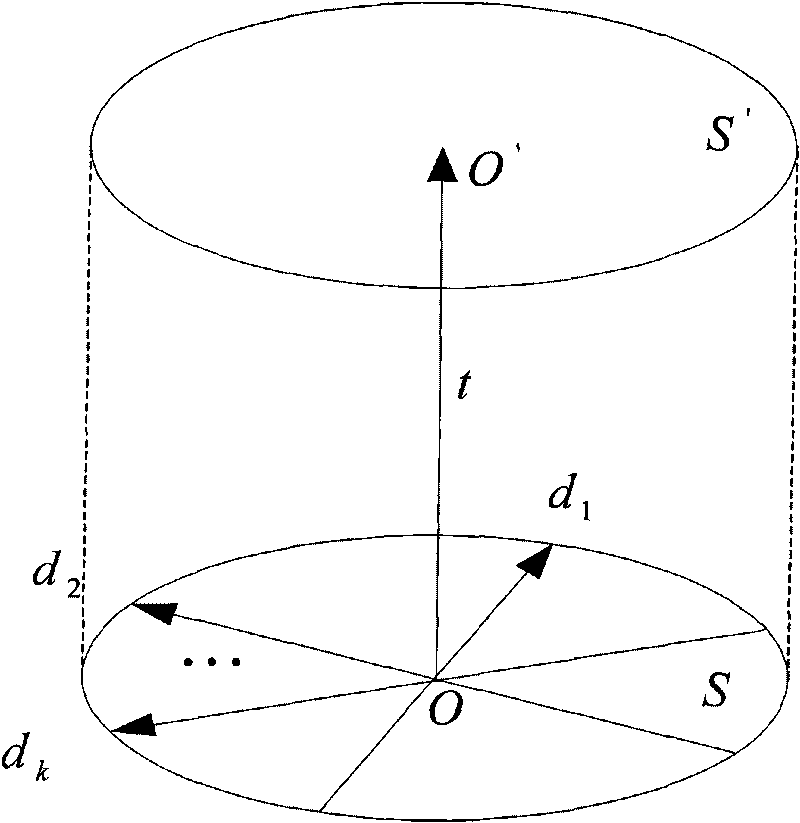
[0038] 1. If figure 2 , define a cylinder in three-dimensional space, the center of the lower bottom surface S of the cylinder is O, the center of the upper bottom surface S′ is O′, and k vectors d along the diameter direction in S 1 , d 2 ,...,d k Represent k dimensional axes of the multi-dimensional time-series data set, represent the time-series axis of the multi-dimensional time-series data set with the vector t represented by OO', and preliminarily establish a multi-dimensional time-series coordinate system based on a cylinder;

[0039] 2. Scan the data set from top to bottom, and calculate the correlation coefficient r(d) of any two-dimensional in the multi-dimensional time series data set i , d j ), in, 1≤l≤m, 1≤i≤k, 1≤j≤k, f i l Record the i-th dimension attribute value of l for a multidimensional time series dataset, Max i 、Min i are the maximum and minimum v...


PUM


Abstract

The invention discloses a method for visualizing multi-dimensional time sequence information, which aims to solve the problem that the same view cannot disclose the multi-dimensional distribution and the time-evolution characteristics of a data set. The technical scheme comprises the following steps: firstly, establishing a multi-dimensional time sequence coordinate system; secondly, calculating a related coefficient of any two dimensions in a multi-dimensional time sequence data set; thirdly, regulating the dimensional axis of the multi-dimensional time sequence coordinate system according to the related coefficient, and demarcating the positive direction of the dimensional axis of the multi-dimensional time sequence coordinate system; fourthly, calculating the Descartes coordinate representation, of the multi-dimensional time sequence data set, recorded in the multi-dimensional time sequence coordinate system; fifthly, establishing an objective function, solving an optimum value of the objective function, positioning all record entries of the multi-dimensional time sequence data set; and finally, rendering a point cloud formed by the multi-dimensional time sequence record to obtain a visualization result of the multi-dimensional time sequence data set. By adopting the method for visualizing the multi-dimensional time sequence information, the multi-dimensional distribution character and the time-evolution characteristics of the multi-dimensional time sequence data set can be visualized in the same view at the same time, so that the complex degree and the randomicity of dimensional axis configuration are lightened effectively and the time complex degree of dimensional operation is reduced.

Description

technical field [0001] The invention relates to a visualization method in the technical field of information visualization, in particular to a multidimensional time series information visualization method that takes into account the multidimensional distribution and time series evolution characteristics of data sets. Background technique [0002] The rapid development of information technology and the explosive growth of information in the fields of science, engineering, and business have posed new technical challenges to how to analyze and understand a large amount of abstract data. Faced with such a huge amount of information resources, due to the inherent limitations of human cognitive ability, it is difficult for people to understand and compare them if they only rely on the form of data tables or text to express them, and information cognitive activities are facing unprecedented complexity. . Information visualization is an emerging technology that uses computer graphi...

Claims


Application Information

Patent Timeline
Patent Type & Authority Applications(China)
IPC IPC(8): G06F17/30
Inventor 肖卫东孙扬汤大权唐九阳葛斌张翀
Owner NAT UNIV OF DEFENSE TECH
Why Eureka
Try Eureka