Method for network visualization
A network and network data technology, applied in the network field, can solve problems such as indistinguishability and no clear definition of physical meaning, and achieve the effect of avoiding accumulation, clear physical meaning, and avoiding the intersection of edges.
- Summary
- Abstract
- Description
- Claims
- Application Information
AI Technical Summary
Problems solved by technology
Method used
Image

Examples
Embodiment
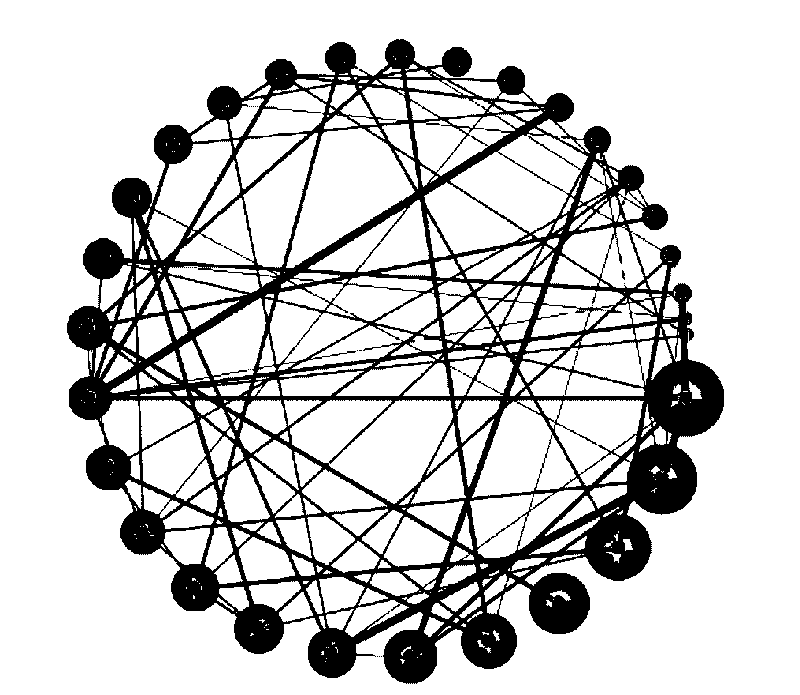
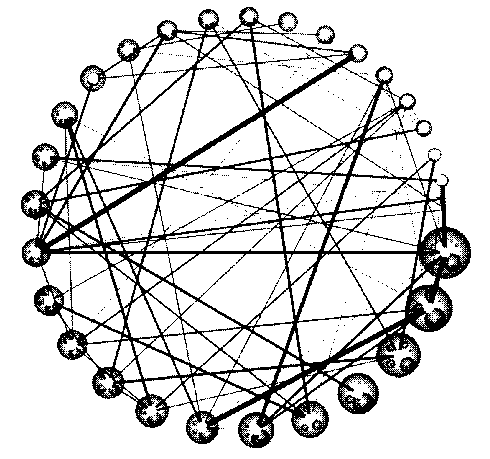
[0024] In this embodiment, a power transmission network with 3040 original nodes is visualized, including the following steps:
[0025] The first step is to read in the network data in the .net format of the power transmission network with 3040 original nodes,
[0026] The data includes the radius information of the original node and its adjacency information, and a network node and edge model is constructed based on this information;
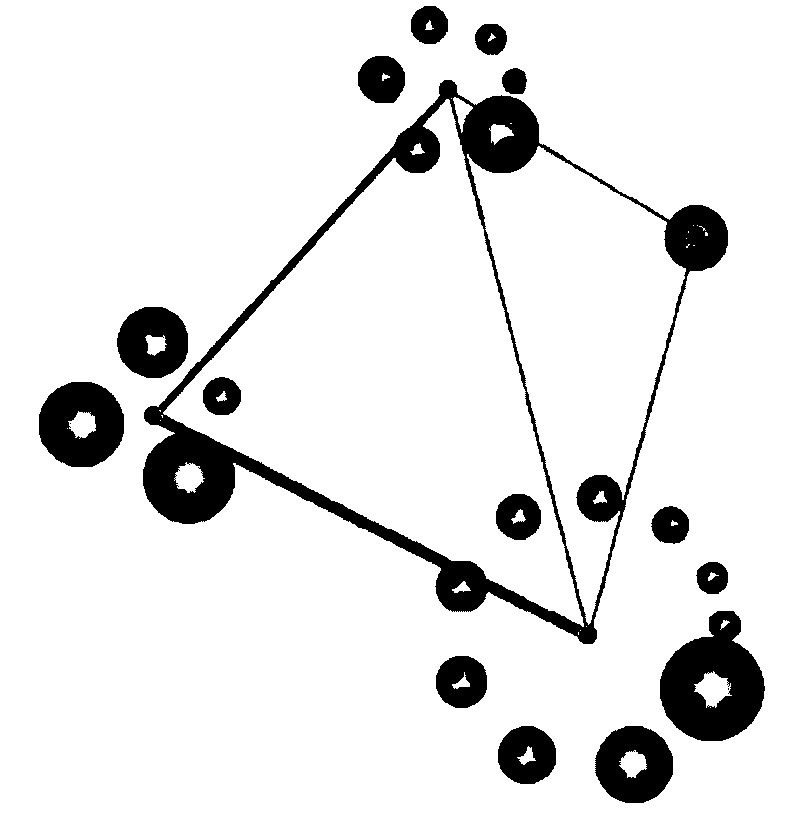
[0027] In the second step, the community division method is used to divide the network into hierarchical communities, and a maximum-level community is obtained. The maximum-level community includes several N-level communities, and each N-level community includes several (N-1)-level communities. Community, and so on, until each first-level community is an original node.
[0028] The specific methods of group division are as follows:
[0029] 1) The 3040 original nodes read in are regarded as 3040 first-level communities, and according to the m...
PUM
 Abstract
Description
Claims
Application Information