Time domain parameter blind evaluation method of OFDM (Orthogonal Frequency Division Multiplexing) signals

A time-domain parameter and blind estimation technology, applied in baseband system components, multi-frequency code systems, etc., can solve problems such as unsuitable for wireless channel applications and poor estimation performance, and achieve the effect of reducing computational complexity and improving estimation performance

Inactive Publication Date: 2011-02-16
XIDIAN UNIV
2 Cites 23 Cited by

AI-Extracted Technical Summary

Problems solved by technology

This method is based on the detection of the distance between peaks, and the estimation performance is poor under low signal-to-n...

Abstract

The invention discloses a time domain parameter blind evaluation method of OFDM (Orthogonal Frequency Division Multiplexing) signals, which mainly solves the problems of poor evaluation performance and high calculation load of the traditional evaluation method under the conditions of low signal to noise ratio and multipath channels. The evaluation method comprise the steps of: designing a power spectrum of an approaching signal of an optimum cosine roll-off filter, and evaluating an oversampling rate; a calculating correlation coefficient function sequence of an OFDM baseband sampling signal,and evaluating an effective data length; calculating a cycle autocorrelation function of a signal moving autocorrelation function sequence, searching a cycle frequency corresponding to a peak value position of the cycle autocorrelation function, and evaluating a total symbol length; and evaluating a cycle prefix length by utilizing the evaluated total symbol length and the evaluated effective data length. The invention can ensure that the evaluation error of the oversampling rate and the total symbol length is small, the accuracy rate of the evaluation of the effective data length is high, and the performance of the evaluation of the total symbol length is free of the influence of frequency shift and phase shift, and the method can be used for the time domain parameter blind evaluation ofthe OFDM baseband sampling signals in the communication technical field.

Application Domain

Baseband system detailsMulti-frequency code systems

Technology Topic

Signal-to-noise ratio (imaging)Phase shifted +12

Image

  • Time domain parameter blind evaluation method of OFDM (Orthogonal Frequency Division Multiplexing) signals
  • Time domain parameter blind evaluation method of OFDM (Orthogonal Frequency Division Multiplexing) signals
  • Time domain parameter blind evaluation method of OFDM (Orthogonal Frequency Division Multiplexing) signals

Examples

  • Experimental program(1)

Example Embodiment

[0030] The OFDM signal used in the present invention is a DVB-T OFDM signal 2K FFT mode, and the multipath channel is a GSM TU 6-path channel model.
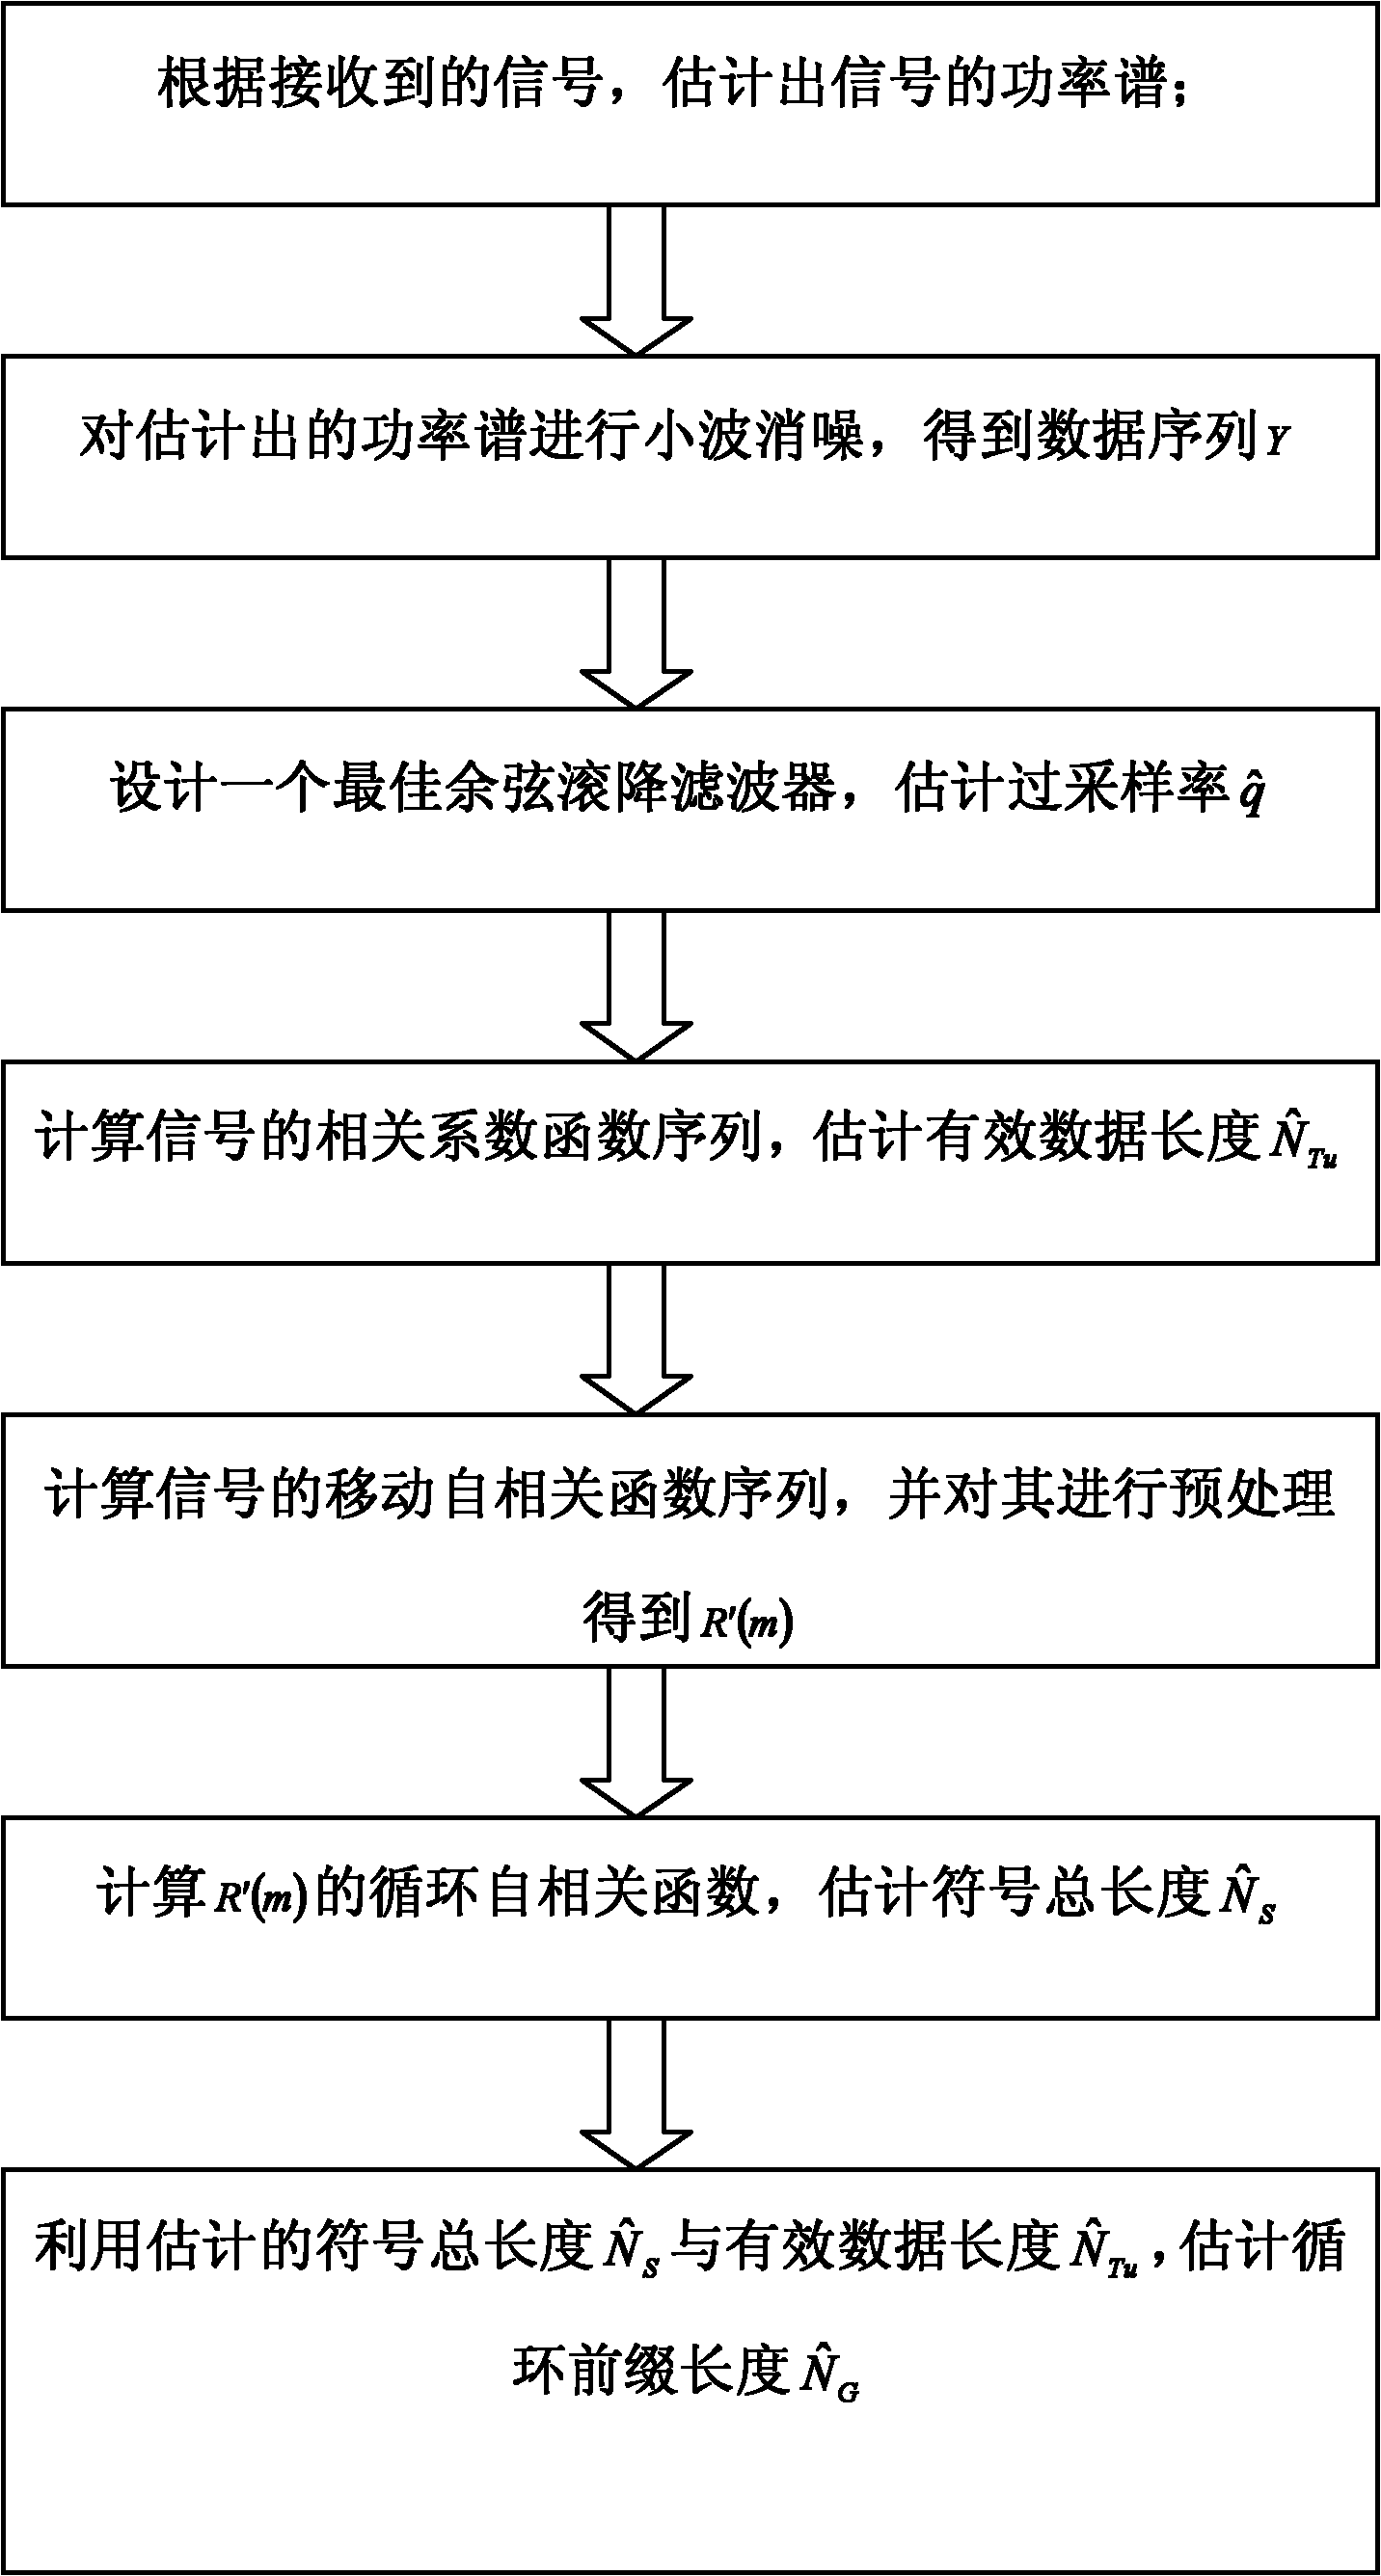
[0031] Reference figure 1 The specific implementation steps of the present invention are as follows:
[0032] Step 1. Use the Welch method to estimate the power spectrum of the OFDM baseband oversampling signal r(i), where i=1, 2, Λ, N, and N is the intercepted data length:
[0033] 1.1) Divide the intercepted OFDM baseband oversampling signal r(i) into L segments, each with a data length of M L , The OFDM baseband oversampled signal data of the first segment can be expressed as:
[0034] r l (k′)=r(k′+(l-1)·M L ), k′=1, 2, ΛM L , L = 1, 2, Λ, L 1)
[0035] among them l means data segment variable, k′ means data symbol variable;
[0036] 1.2) Add the window function w(k′) to each segment of data to find the correction periodogram of each segment. The correction periodogram of the first segment is expressed as:
[0037] I l ( ω ) = 1 U | X k ′ = 1 M L r l ( k ′ ) w ( k ′ ) e - jω k ′ | 2 - - - 2 )
[0038] Where ω is the frequency domain variable, j is the imaginary part vector of the complex number, and U is the normalization factor, and its expression is:
[0039] U = 1 M L X k ′ = 1 M L w 2 ( k ′ ) ; - - - 3 )
[0040] 1.3) The revised period diagram of each segment I l (ω) are approximately regarded as uncorrelated, the power spectrum estimated by the Welch method Expressed as:
[0041] P ^ ( e jω ) = 1 L X l = 1 L I l ( ω ) - - - 4 )
[0042] In the present invention, the data length of the intercepted OFDM signal is N=2048*9, this data is divided into L=9 segments, and the data length of each segment is M L =2048, the window function w(k') is selected as the Hamming window.
[0043] Step 2: Perform wavelet denoising processing on the power spectrum to obtain a new power spectrum Y.
[0044] Since there are many high-frequency details in the power spectrum of the OFDM signal estimated by the Welch method, the high-frequency details in the signal can be extracted through wavelet denoising, so that the outline of the signal spectrum is clearer, so as to facilitate the subsequent design of the best ideal low-pass filter.
[0045] The wavelet denoising process is directly realized by the built-in function wden() in Matlab. The function wden() includes optional parameters such as wavelet type, wavelet decomposition level and threshold processing method. The wavelet type used in the present invention is a Daubechies wavelet with a wavelet order of 3, the number of wavelet decomposition levels is determined to be 4 by simulation, and the threshold processing method is soft threshold processing. After using Daubechies wavelet to perform wavelet denoising on the power spectrum, a new power spectrum Y is obtained.
[0046] Step 3. Design a best ideal low-pass filter according to the new power spectrum Y, and select the best roll-off coefficient α opt =0.2, and then design an optimal cosine roll-off filter based on the best ideal low-pass filter, and set the cut-off frequency ω of the best cosine roll-off filter s As the cutoff frequency of the signal power spectrum Y, the oversampling rate of the OFDM baseband oversampling signal is estimated
[0047] 3.1) Since the baseband OFDM signal is a low-pass signal, according to formula 5) design an optimal ideal low-pass filter H target :
[0048] H t arg et = Y i opt t arg et - - - 5 )
[0049] Y i ′ ′ t arg et = [ A 2 i ′ ′ ones ( i ′ ′ ) , zeros ( N - 2 i ′ ′ ) , A 2 i ones ( i ′ ′ ) ] T i opt = arg min i ′ ′ ( Y - Y i ′ ′ t arg et ) 2 ;
[0050] among them[·] T Represents the transpose operation, For the ideal low-pass filter designed, A=sum(Y) is the total energy of the signal power spectrum Y, N FFT The number of Fourier transform points when estimating the power spectrum, ones(i") is the continuous generation of i" 1 values, zeros(N FFT -2i″) is continuous production (N FFT -2i″) 0 values, i″ is the cut-off length of the passband of an ideal low-pass filter, and the search range for i″ is 1~N FFT /2, i opt Is the cut-off length of the passband of the best ideal low-pass filter;
[0051] 3.2) Under the condition of a multipath channel with a sampling frequency of 36MHz and a signal-to-noise ratio of 0dB, the best cosine roll-off coefficient α is selected through simulation opt Is 0.2;
[0052] 3.3) Use the selected best cosine roll-off coefficient α opt , According to formula 6) design the best approximation cosine roll-off filter H(ω′):
[0053] H ( ω ′ ) = A 2 i opt , 0 ≤ ω ′ ( 1 - α opt ) i opt A 4 i opt ( 1 + sin ( π i opt - ω ′ 2 α opt i opt ) ) , ( 1 - α opt ) i opt ≤ ω ′ ( 1 + α opt ) i opt 0 , ω ′ ≥ ( 1 + α opt ) i opt - - - 6 )
[0054] Where ω′ is the frequency domain variable of the cosine roll-off filter;
[0055] 3.4) The cutoff frequency ω of the best cosine roll-off filter s As the cutoff frequency of the signal power spectrum Y:
[0056] ω s = ( 1 + α opt ) i opt N FFT · 2 π - - - ( 7 )
[0057] According to Equation 8) Estimate the oversampling rate of the OFDM baseband oversampling signal for:
[0058] q ^ = 2 π 2 ω s = N FFT 2 ( 1 + α opt ) i opt . - - - 8 )
[0059] Step 4. Calculate the correlation coefficient function sequence ρ(k) of the OFDM baseband sampling signal r′(i′), and detect the peak position of ρ(k) Choose with The power of 2 d with the smallest Euclidean distance opt , Estimate the effective data length of the OFDM baseband sampling signal
[0060] 4.1) OFDM baseband sampling signal r′(i′) is expressed as:
[0061] r′(i′)=s(i′)+n(i′), i′=1, 2, Λ, N′ 9)
[0062] Among them, s(i') represents the useful signal sent, n(i') represents the additive white Gaussian noise with a mean value of 0 and a variance of 1, i'represents the data variable, and N'is the intercepted data length.
[0063] The autocorrelation function of the OFDM baseband sampled signal is expressed as:
[0064]
[0065] Where E[] represents the autocorrelation operation, r′*(·) represents the conjugate of r′(·), and k represents the variable correlation delay length, with Respectively represent the energy of the useful signal and the additive white Gaussian noise, ε represents the frequency offset caused by the channel, N D Is the true effective data length of the OFDM signal;
[0066] 4.2) The correlation coefficient function sequence ρ(k) is used to express the degree of correlation between the data of the OFDM baseband sampled signal r′(i′). The correlation coefficient function sequence ρ(k) has the same characteristics as the autocorrelation function in Equation 10). Calculate the correlation coefficient function sequence ρ(k):
[0067] ρ ( k ) = | X i ′ = 1 N ′ - k ( r ′ ( i ′ ) · r ′ * ( k + i ′ ) ) | X i ′ = 1 N ′ ( r ′ ( i ′ ) · r ′ * ( i ′ ) ) - - - 11 )
[0068] Where N′ is the length of the intercepted data, k is the variable correlation delay length, with a value range of 1~8000, r′(i′) is the i′th data, i′=1, 2, Λ, N′;
[0069] It can be seen from equation 10 that when the variable delay correlation length of the autocorrelation function is equal to the effective data length of the OFDM signal, the autocorrelation function has a peak, so the OFDM signal autocorrelation function sequence ρ(k) will also appear in the corresponding position Peak
[0070] 4.3) Search for the peak position of the correlation coefficient function sequence ρ(k)
[0071] N ^ D = arg max k ( ρ ( k ) ) ; - - - 12 )
[0072] 4.4) According to the value of the effective data length of the OFDM signal equal to the number of IFFT transform points of the OFDM signal, and the number of IFFT transform points of the OFDM signal is a power of 2, select The power of 2 with the smallest Euclidean distance is used as the estimated effective data length
[0073] d opt = arg min ( | N ^ D - 2 d | ) , d = 1,2 , Λ , 13 N ^ Tu = 2 d opt , - - - 13 )
[0074] In the present invention, considering the problem of inter-subcarrier interference, the number of IFFT transformation points will not be very large, and the maximum number of IFFT transformation points for a DVB-TOFDM signal is 2 13 , So the value range of the power of 2 d is 1-13.
[0075] Step 5. Set the estimated effective data length As the correlation delay length, calculate the moving autocorrelation function sequence R(m) of r'(i'), calculate the absolute value of R(m), and then perform median filtering and smoothing and de-averaging processing. After de-averaging, it will be less than 0 The function value becomes 0, and the preprocessed moving autocorrelation function R'(m) is obtained.
[0076] 5.1) Set the relevant delay length as Calculate the mobile autocorrelation function sequence R(m) of the OFDM baseband sampled signal:
[0077] R ( m ) = | X j ′ = 1 L ′ ( r ′ ( j ′ + m ) · r ′ * ( j ′ + m + N ^ Tu ) ) | , m = 1,2 , Λ , N ′ - N ^ Tu - L ′ - - - 14 )
[0078] Where N′ is the length of the intercepted data, m is the position of the moving window, L′ is the length of the moving window, r′(j′) is the j′th data, j′=1, 2, Λ, L′;
[0079] From equation 14), it can be concluded that the moving autocorrelation function sequence R(m) of the OFDM signal is a periodic sequence, the size of which is equal to the total length of the OFDM signal symbol;
[0080] 5.2) Perform median smoothing filtering on the moving autocorrelation function sequence R(m) to obtain the intermediate sequence value R″(m);
[0081] 5.3) The intermediate sequence value R″(m) is de-averaged, and the function value less than 0 is changed to 0 to obtain the preprocessed moving autocorrelation function R′(m).
[0082] Step 6. Calculate the cyclic autocorrelation function of the preprocessed moving autocorrelation function R′(m), and search for the cyclic frequency α′ corresponding to the peak position of the cyclic autocorrelation function within the set search range opt , Estimated total symbol length
[0083] 6.1) Calculate the cyclic autocorrelation function of the moving autocorrelation function R′(m) after preprocessing
[0084] C ( α ′ , N ^ Tu ) = | 1 M ′ X m = 1 M ′ R ′ ( m ) e - j 2 π α ′ m | - - - 15 )
[0085] Where M′ is the length of the preprocessed moving autocorrelation function R′(m) sequence, α'is the variable cycle frequency;
[0086] 6.2) Extraction makes C The value corresponding to the maximum value α′ opt :
[0087]
[0088] According to the definition of cyclic frequency, the cyclic frequency α′ corresponding to the peak position of the cyclic autocorrelation function opt Is the reciprocal of the period of the moving autocorrelation function and estimates the symbol length of the OFDM signal
[0089] N ^ S = 1 α opt ′ - - - 17 )
[0090] According to the total length of the OFDM symbol must be greater than the effective data length, and considering the loss of information transmission efficiency caused by the cyclic prefix, the implementation complexity of the system, and the peak ratio of the system, in the actual system, the cyclic prefix length is N G Will not exceed 1/4 of the effective data length of the OFDM symbol, which is N G ≤N D /4, so the search range of the cycle frequency α'is set to This can reduce the computational complexity of the estimation method.
[0091] Step 7. Use the estimated total symbol length And estimated effective data length Estimate the cyclic prefix length of the OFDM signal
[0092] N ^ G = N ^ S - N ^ Tu .
[0093] The effect of the present invention can be further illustrated by the simulation diagram:
[0094] Simulation environment, see Table 1
[0095] Table 1: Simulation environment
[0096]
[0097] Simulation content and results:
[0098] The simulated signal-to-noise ratio is 0dB, and the sampling frequency is f s = Under the condition of 36MHz, the influence of the number of wavelet decomposition layers and the cosine roll-off coefficient on the oversampling rate estimation performance, the simulation result is figure 2. From figure 2 It can be seen that the roll-off coefficient of the cosine roll-off filter has a great influence on the performance of oversampling rate estimation. The performance obtained at 0.1 and 0.2 is better, and when it is greater than 0.2, the performance gradually deteriorates. In addition, it is easy to see that when the number of decomposition layers is 3 to 5, the best roll-off coefficient is 0.2; when the number of decomposition layers is 6 to 8, the best roll-off coefficient is 0.1. In the present invention, the number of wavelet decomposition layers is selected to be 4, and the cosine roll-off coefficient is 0.2.
[0099] When the number of simulation wavelet decomposition layers is 4, the cosine roll-off coefficient is 0.2, and the sampling frequency is 28MHz, for DVB-TOFDM signals, the cosine roll-off filter approximation method proposed by the present invention is compared with the ideal filter approximation method over sampling rate estimation performance comparison Figure, the simulation result is image 3. From image 3 It can be seen that the estimation performance of the ideal filter approximation method becomes worse as the signal-to-noise ratio increases. The reason is that there are empty carriers in the OFDM signal, and the best low-pass filter will only approach the spectrum width occupied by useful sub-carriers. Under the condition of low signal-to-noise ratio, due to the influence of noise, the power spectrum of the signal produces "outward spreading" phenomenon, so the cut-off frequency of the best low-pass filter is closer to the real signal cut-off frequency; With the increase of, the power spectrum of the signal is getting closer and closer to the ideal power spectrum, and the part occupied by the empty carrier is ignored. Therefore, under the condition of high signal-to-noise ratio, the performance of oversampling rate estimation based on the best low-pass filter is getting worse. In the present invention, the optimal cosine roll-off filter is used for further approximation, which overcomes this existing problem. Under the condition of a signal-to-noise ratio of -2dB and a multipath channel, the estimated mean square error does not exceed 0.2.
[0100] The estimated accuracy of the simulated effective data length varies with the signal-to-noise ratio, and the simulation result is Figure 4. From Figure 4 It can be seen that the accuracy of effective data length estimation in the present invention can reach 97% under the condition of SNR=-5dB and multipath channel.
[0101] The estimation error of the total length of the simulation symbol varies with the SNR, the simulation result is Figure 5. From Figure 5 It can be seen that the method proposed by the present invention has an average offset of approximately 0.21% of the total estimated symbol length under the condition of a signal-to-noise ratio of 0dB and a multipath channel, and it is superior to the traditional cyclic prefix-based time-domain autocorrelation method and the traditional Cyclic autocorrelation method.
[0102] The estimation error of the total length of the simulation symbol changes with the phase offset, the simulation result is Image 6. From Image 6 It can be seen that the estimation error of the total length of the symbol fluctuates within a small range with the change of the phase offset, so it can be explained that the method of the present invention is not affected by the phase offset.
[0103] The estimation error of the total length of the simulation symbol changes with the frequency offset, the simulation result is Figure 7. From Figure 7 It can be seen that the estimation error of the total length of the symbol fluctuates within a small range with the change of the frequency offset, so it can be explained that the method of the present invention is not affected by the frequency offset.

PUM

no PUM

Description & Claims & Application Information

We can also present the details of the Description, Claims and Application information to help users get a comprehensive understanding of the technical details of the patent, such as background art, summary of invention, brief description of drawings, description of embodiments, and other original content. On the other hand, users can also determine the specific scope of protection of the technology through the list of claims; as well as understand the changes in the life cycle of the technology with the presentation of the patent timeline. Login to view more.

Similar technology patents

NB-IoT terminal positioning system and method

ActiveCN111669703Aimprove performanceImprove estimation performance
Owner:TONGJI UNIV

Ultrasonic detection method and system

Owner:INST OF ACOUSTICS CHINESE ACAD OF SCI

Detection method based on 3D skeleton modeling

Owner:武汉汇思聚创信息技术有限公司

MIMO radar target positioning method and system based on space-time coding

PendingCN113281732Aeliminate cross-correlationImprove estimation performance
Owner:HUAZHONG UNIV OF SCI & TECH

CNN-Bagging-based fault diagnosis method for UAV bearing

ActiveCN110307983AReduce computational complexityconducive to real-time
Owner:UNIV OF ELECTRONIC SCI & TECH OF CHINA

Classification and recommendation of technical efficacy words

Why Eureka
Try Eureka