Leakage loss detection method combining leakage loss recording instrument with district metering areas (DMA)
A technology of independent metering partitions and detection methods, applied in the direction of gas/liquid distribution and storage, pipeline systems, mechanical equipment, etc., can solve the problems of reducing leakage response speed, long cycle, heavy data collection work of data recorders, etc., to achieve compensation The effect of slow response to leakage, small number, and small workload of data collection and analysis
- Summary
- Abstract
- Description
- Claims
- Application Information
AI Technical Summary
Problems solved by technology
Method used
Image
Examples
Embodiment 1
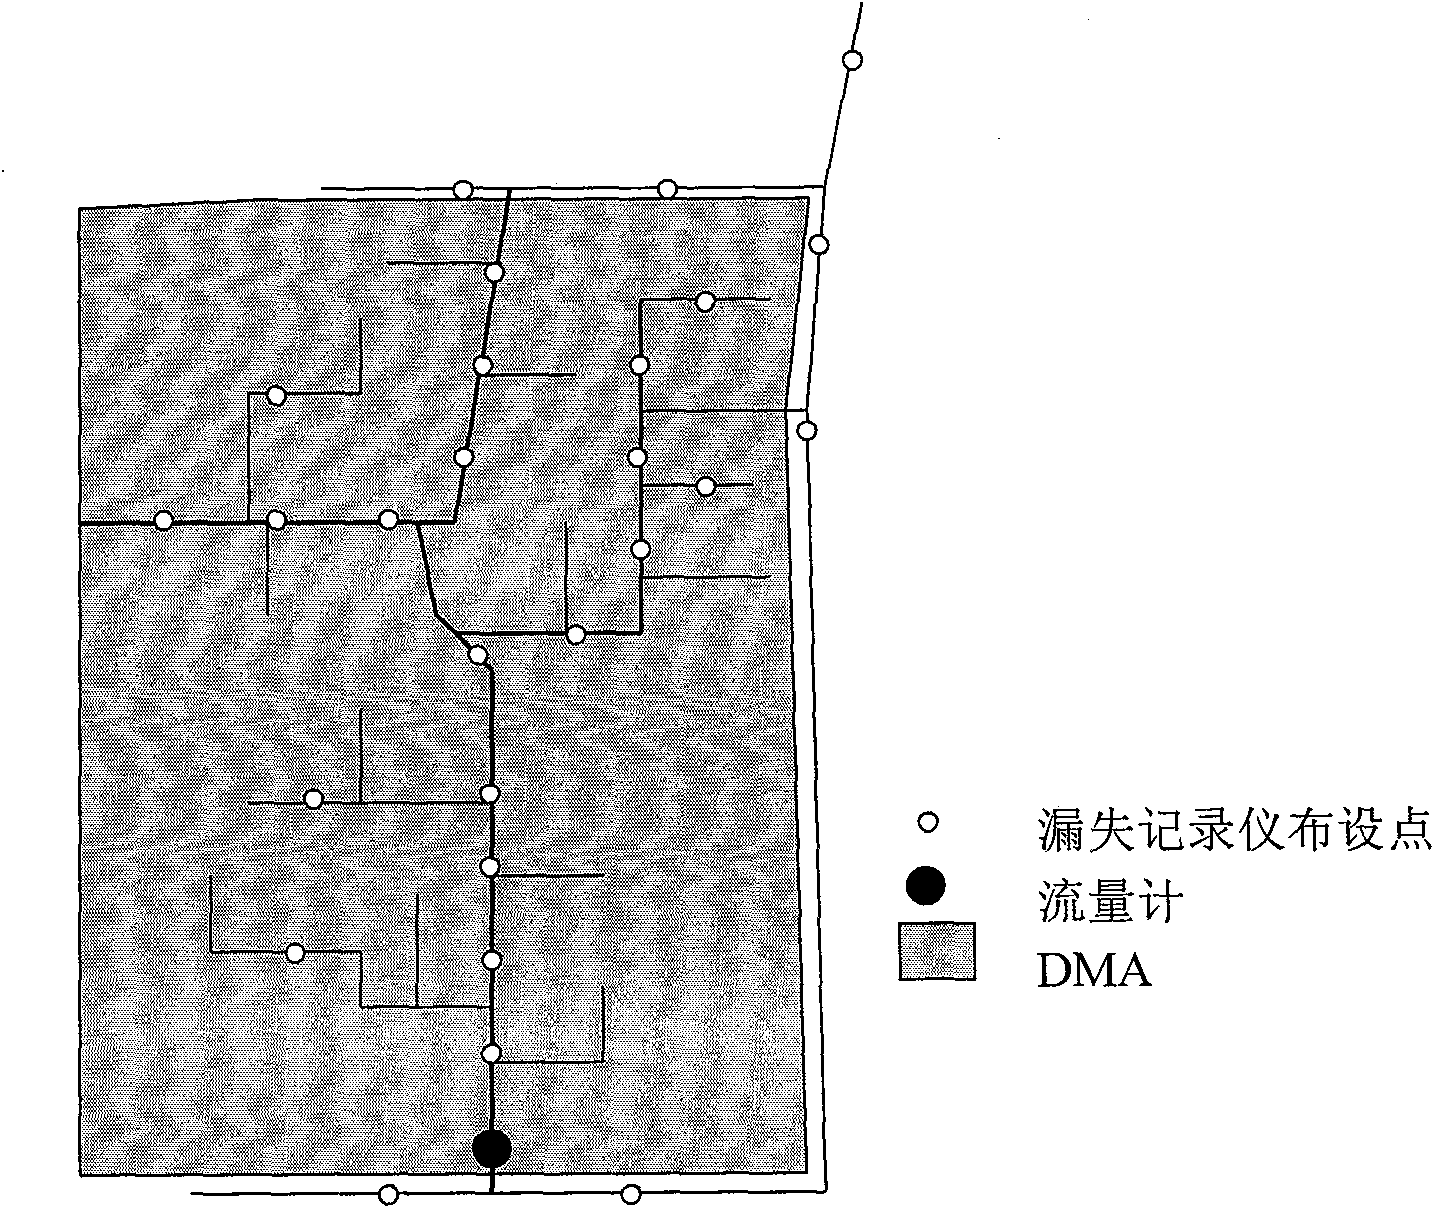
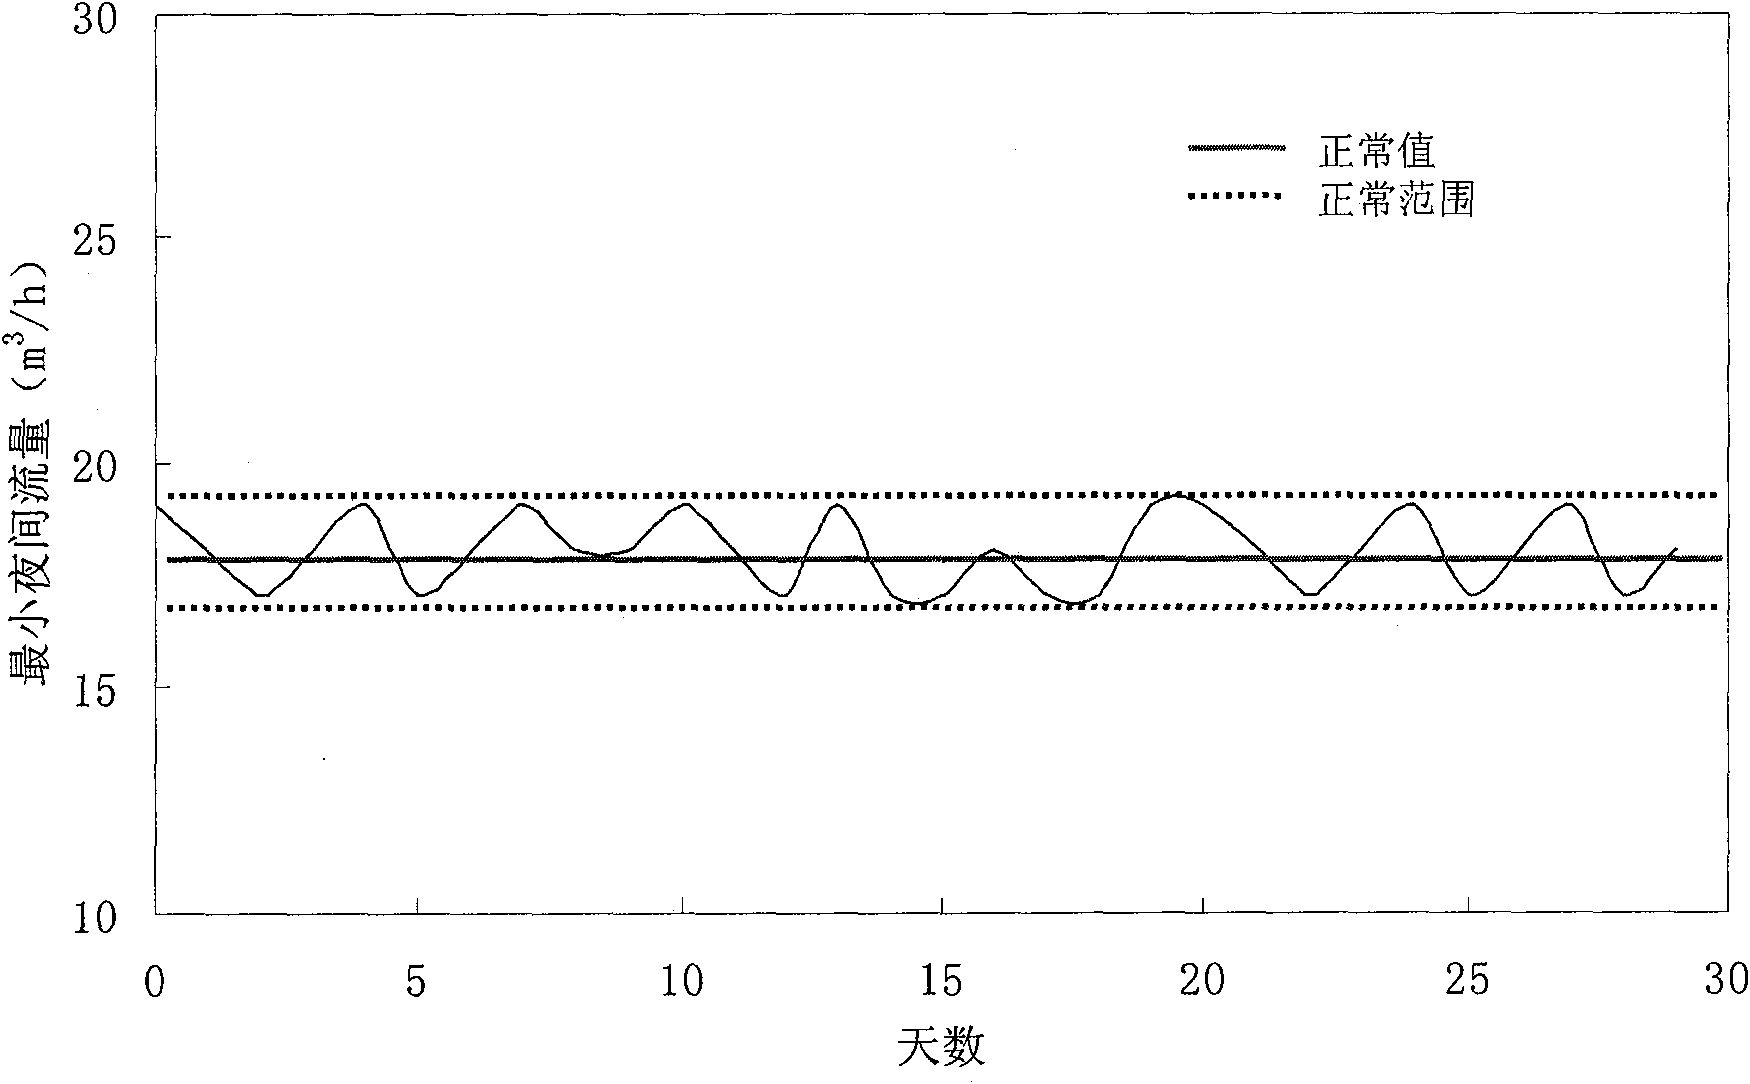
[0034] According to the DMA division method, the entire urban pipe network is divided into several DMAs for management, and one of the DMAs is selected as an example. The length of the DMA pipeline (diameter greater than 75mm) is 3000m, 20 leakage recorders are installed, and 1 flow meter is installed at the water inlet (shown as figure 1 ), manually check for leaks and fix them. Collect flowmeter data regularly for 30 days, find out the minimum night flow of each day (the minimum continuous value of the day is taken as the minimum night flow of the day), and draw the minimum night flow curve with the date as the abscissa and the minimum night flow as the ordinate (shown as image 3 ), find out that the normal value of the minimum nighttime flow in this DMA area is 18m 3 / h, the normal fluctuation range is 17-19m 3 / h (meaning such as image 3 ).
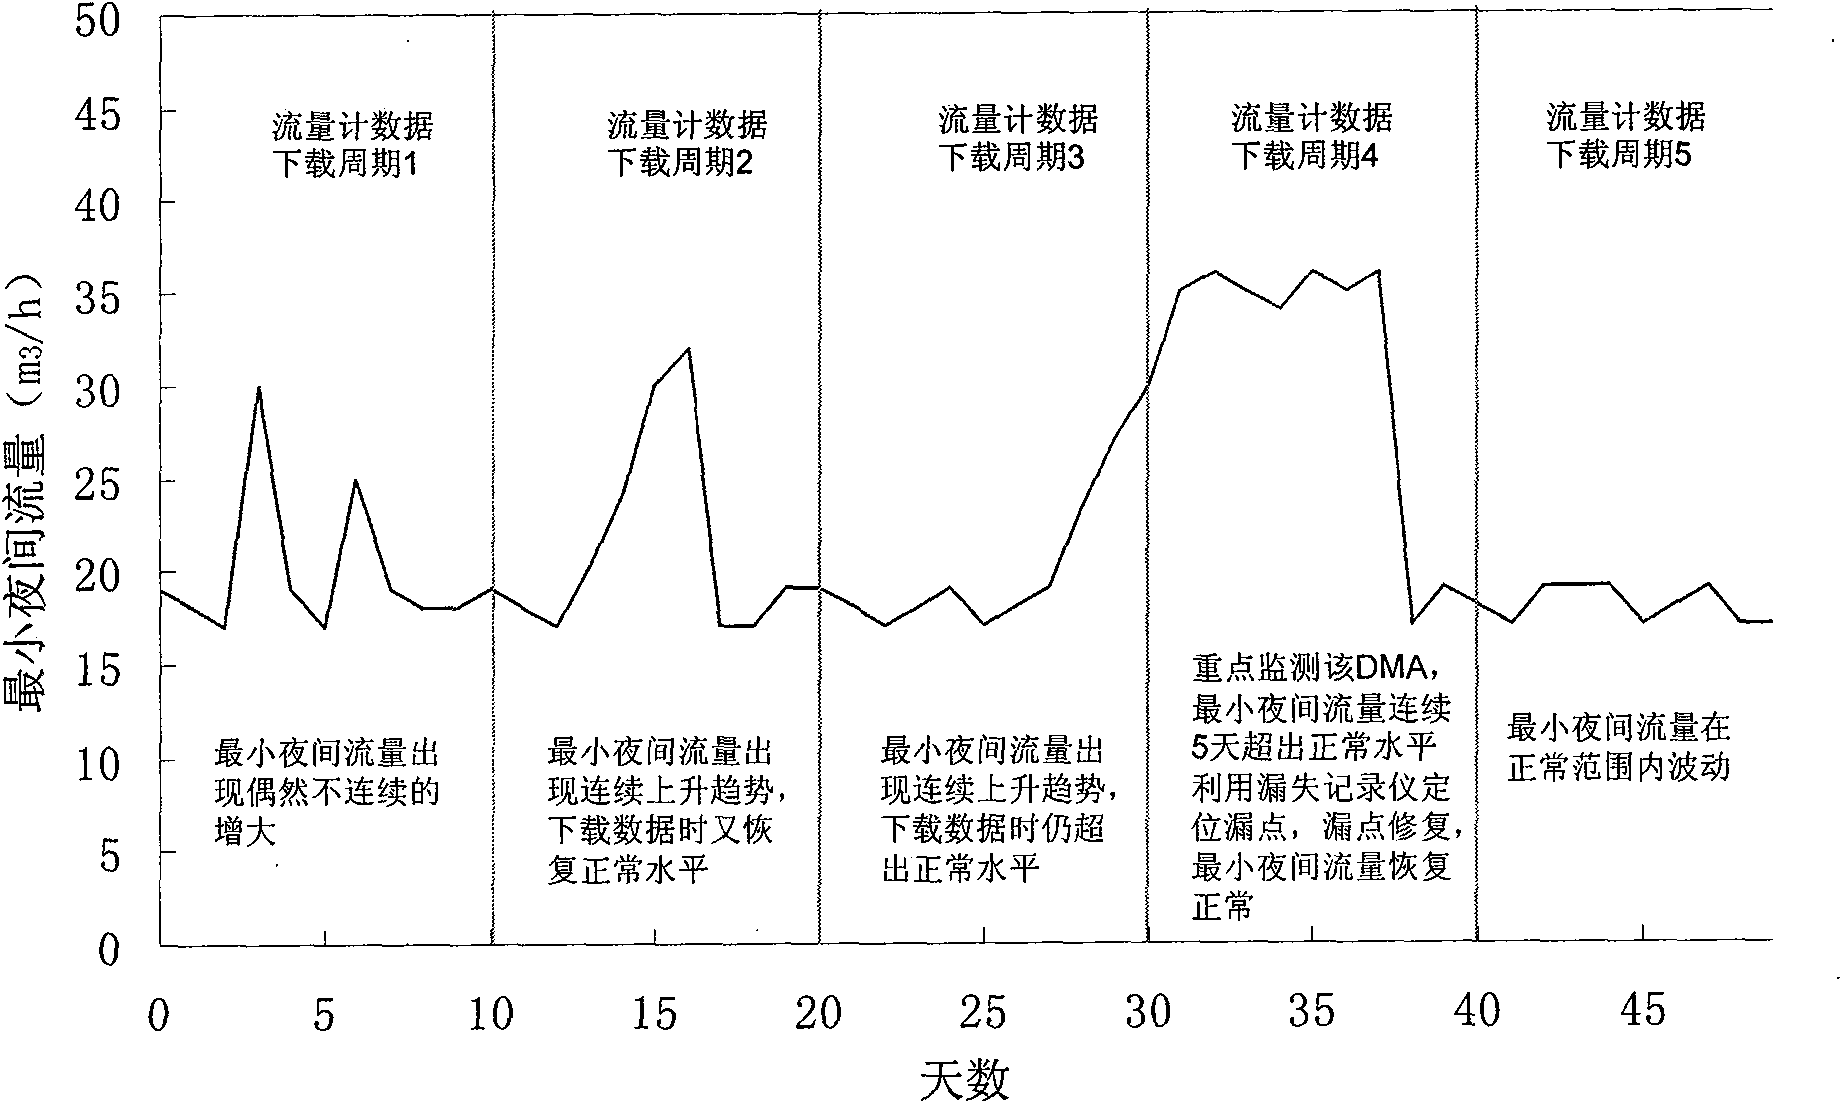
[0035] Collect DMA flow meter data regularly, with a period of 10 days. Analyze the flow data on the day of data download, and...
Embodiment 2
[0042] The key monitoring areas in the urban pipe network are divided into DMA for leakage monitoring. The length of the DMA pipeline (pipe diameter greater than 75mm) is 3000m, 20 leakage recorders are installed, and 1 flowmeter is installed at the water inlet (shown as figure 1 ), manually check for leaks and fix them. Collect flowmeter data regularly for 30 days, find out the minimum night flow of each day (the minimum continuous value of the day is taken as the minimum night flow of the day), and draw the minimum night flow curve with the date as the abscissa and the minimum night flow as the ordinate (shown as image 3 ), find out that the normal value of the minimum nighttime flow in this DMA area is 18m 3 / h, the normal fluctuation range is 17-19m 3 / h (meaning such as image 3 ).
[0043] Collect DMA flow meter data regularly, with a period of 10 days. Analyze the flow data on the day of data download, and draw the minimum night flow curve (shown as Figure 4 ), a...
PUM
| Property | Measurement | Unit |
|---|---|---|
| Length | aaaaa | aaaaa |
Abstract
Description
Claims
Application Information
 - R&D
- Intellectual Property
- Life Sciences
- Materials
- Tech Scout
- Unparalleled Data Quality
- Higher Quality Content
- 60% Fewer Hallucinations
Browse by: Latest US Patents, China's latest patents, Technical Efficacy Thesaurus, Application Domain, Technology Topic, Popular Technical Reports.
© 2025 PatSnap. All rights reserved.Legal|Privacy policy|Modern Slavery Act Transparency Statement|Sitemap|About US| Contact US: help@patsnap.com


