Test system and method of fluid non-linear percolation characteristics in low-permeability porous media
A technique for porous media and characteristic testing, which is applied in the fields of suspension and porous material analysis, measuring devices, permeability/surface area analysis, etc. Long time and other problems, to achieve the effect of ensuring accuracy and stability, saving experimental testing time, and small changes
- Summary
- Abstract
- Description
- Claims
- Application Information
AI Technical Summary
Problems solved by technology
Method used
Image
Examples
Embodiment 1
[0047] Example 1: Discrete Data Measurements at High Displacement Pressures
[0048] Wash the core to be tested, dry it, and saturate the simulated formation water in advance;
[0049] Before the experiment starts, all valves are closed;
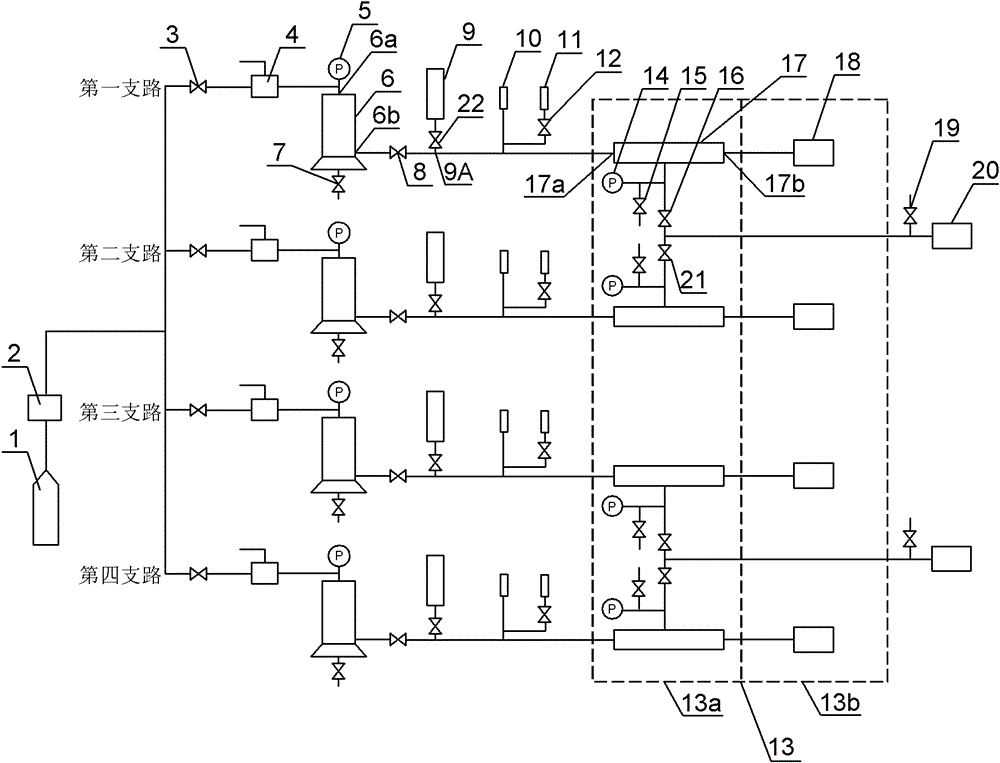
[0050] Fill the intermediate container 6 with simulated formation water, place the prepared core in the core holder 17, open the valves 15, 16, 19, and use the ring pressure pump 20 to load the core in the core holder 17 with ring pressure, Monitor the ring pressure value from the ring pressure gauge 14 until it reaches the standard, and then close the valves 16 and 19;
[0051] According to the experimental needs, a pressure value is initially set for the pressure reducing valve 2, and then an accurate experimental pressure value is set through the high-precision gas pressure-stabilizing valve 4;
[0052] Open the valves 3 and 8 to make the process smooth, and after confirming that there is no leakage, remove the possible air for the core...
Embodiment 2
[0059] Example 2: Discrete Data Measurements at Low Displacement Pressures
[0060] Wash the core to be tested with oil in advance, dry it, and saturate it with simulated formation water;
[0061] Before the experiment started, all valves were closed;
[0062] Place the prepared rock core in the core holder 17, open the valves 15, 16, 19, use the ring pressure pump 20 to load the ring pressure on the rock core in the core holder 17, and monitor the ring pressure value from the ring pressure gauge 14 , until the standard is reached, close the valves 16 and 19;
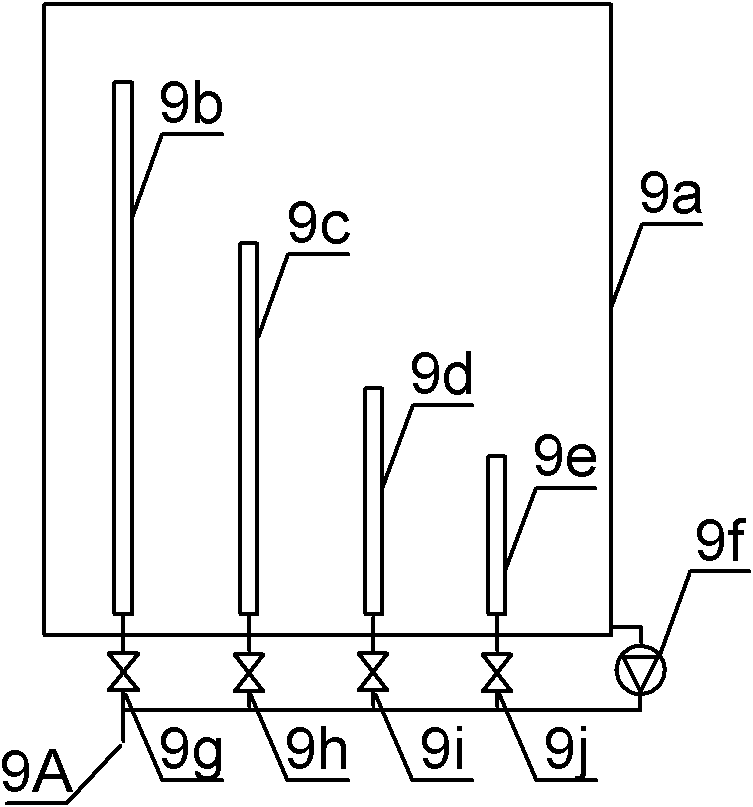
[0063] According to the needs of the experiment, open the required one of the valves 9g, 9h, 9i, 9j, such as the valve 9j, at this time, ensure that the other valves 9g, 9h, 9i are closed, start the peristaltic pump 9f, at this time, the constant pressure pipe 9e constant water overflow;
[0064] Open the valve 12 to make the low-range pressure sensor 11 effective;
[0065] Observe whether the process is unimpeded, ...
Embodiment 3
[0072] Example 3: Non-linear Curve Drawing
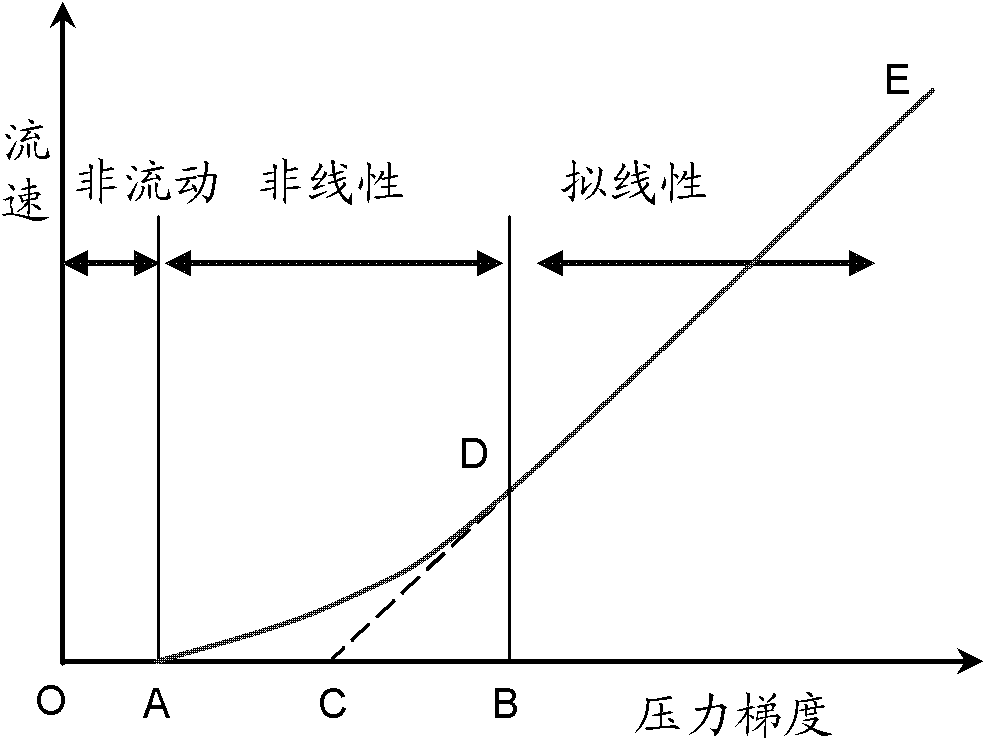
[0073] Using a series of pressure, displacement and time values measured in Example 1 and Example 2, and using data processing tools, the relationship curve of "flow velocity-pressure gradient" can be drawn. Specifically, in the "flow rate-pressure gradient" relationship curve, since the opening pressure of the glass thin tube of the photoelectric micro-flowmeter 18 is atmospheric pressure, the pressure gradient is equal to the ratio of the reading of the high-range pressure sensor 10 or low pressure sensor 11 to the length of the rock core ,which is:
[0074] grad P = P L
[0075] gradP is the pressure gradient (unit: MPa / m); P is the reading of the high-range pressure sensor 10 or the low pressure sensor 11 (unit: MPa); L is the core length (unit: m). The flow velocity is equal to the ratio of the fluid volume in the glass capillary 18a whose length is...
PUM
 Abstract
Description
Claims
Application Information
 - R&D
- Intellectual Property
- Life Sciences
- Materials
- Tech Scout
- Unparalleled Data Quality
- Higher Quality Content
- 60% Fewer Hallucinations
Browse by: Latest US Patents, China's latest patents, Technical Efficacy Thesaurus, Application Domain, Technology Topic, Popular Technical Reports.
© 2025 PatSnap. All rights reserved.Legal|Privacy policy|Modern Slavery Act Transparency Statement|Sitemap|About US| Contact US: help@patsnap.com


