Image analysis method and system

An image analysis, image technology, applied in image analysis, image data processing, instruments, etc., can solve the problem of limited number of images, the dimension cannot be too high, and it is not suitable for the analysis of large-scale regressors with small samples.

Active Publication Date: 2012-06-27
SHENZHEN INST OF ADVANCED TECH CHINESE ACAD OF SCI
View PDF3 Cites 11 Cited by
  • Summary
  • Abstract
  • Description
  • Claims
  • Application Information

AI Technical Summary

Problems solved by technology

[0006] In addition, from a statistical point of view, general statistical testing methods such as t-test and permutation test are not suitable for the analysis of small-scale large-scale regression. That is to say, due to the limited number of images available for research, for a voxel or a Sub-region, the dimensionality

Method used


Image

  • Image analysis method and system
  • Image analysis method and system
  • Image analysis method and system

Examples


Embodiment Construction

[0062] In order to solve the problem of incomplete analysis of traditional image analysis techniques, an image analysis method and system that can make the analysis results more comprehensive is proposed.

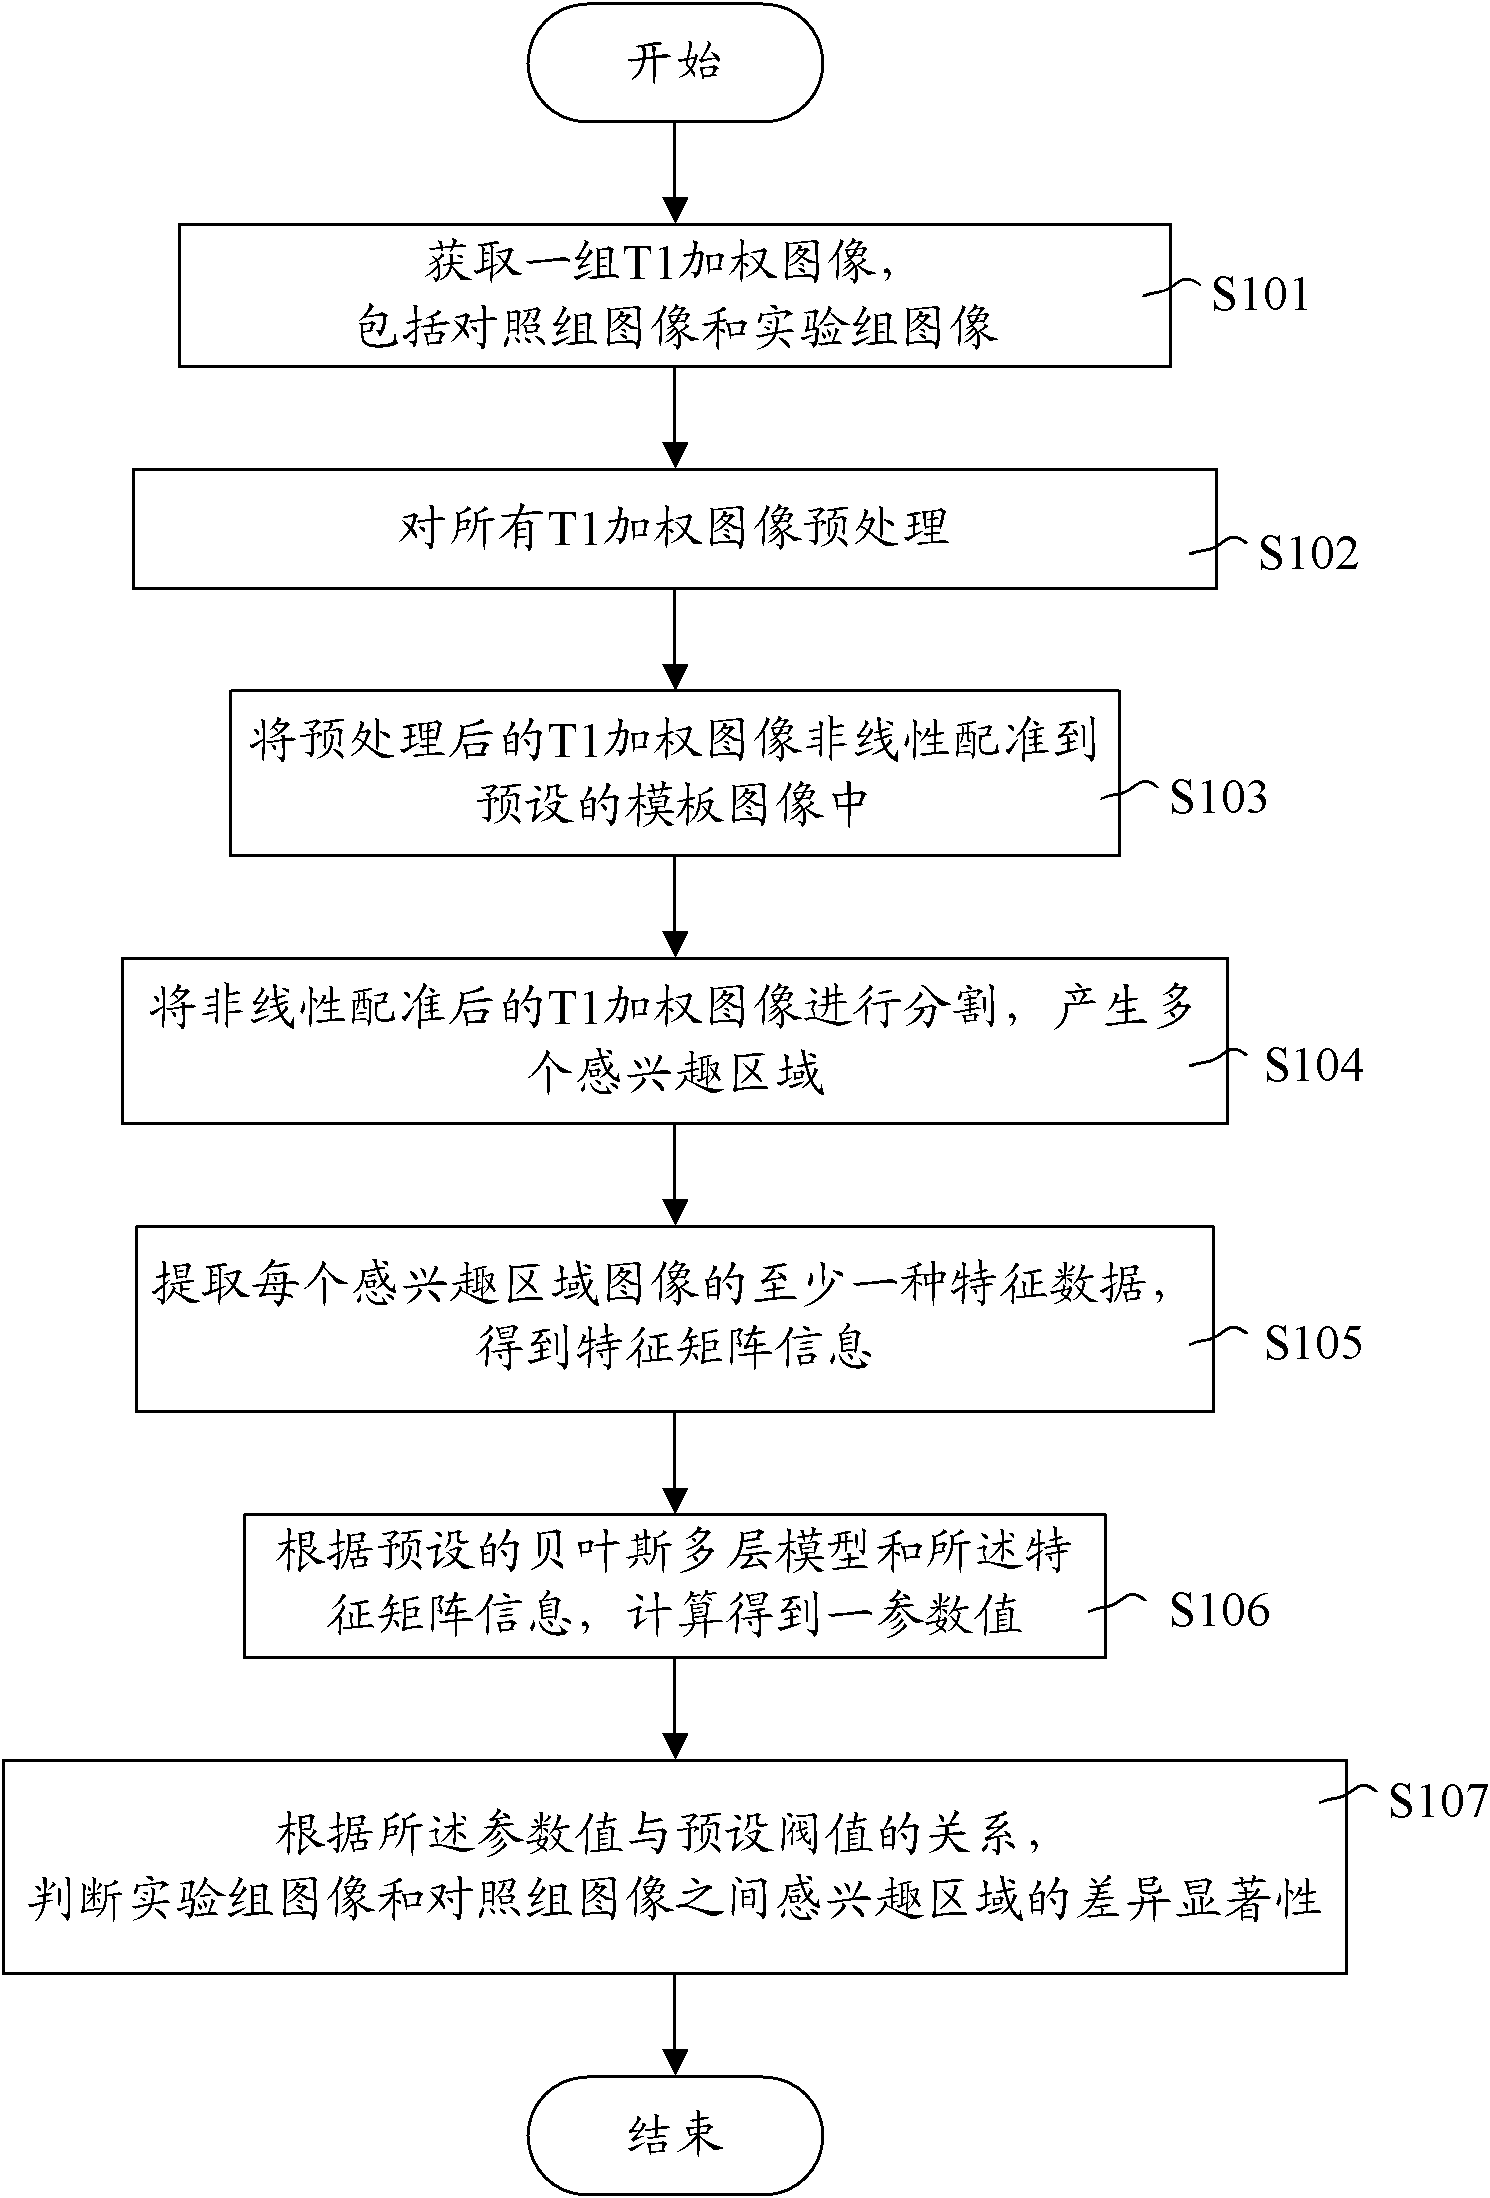
[0063] Such as figure 1 As shown, it is a flow chart of the steps of the image analysis method according to an embodiment of the present invention, including the following steps:

[0064] Step S101, acquiring a group of T1-weighted images, including images of a control group and images of an experimental group.

[0065] For example, the acquired T1-weighted image is: in Denotes the control group image, r ∈ {1, 2, ..., L}, Denotes the images of the experimental group, s ∈ {1, 2, ..., M}, n=L+M.

[0066] Step S102, preprocessing all T1-weighted images. Preprocessing depends on the needs, such as: grayscale correction, deskull, etc.

[0067] Step S103, non-linear registration of the preprocessed T1-weighted image to a preset template image.

[0068] Step S104, segmen...


PUM


Abstract

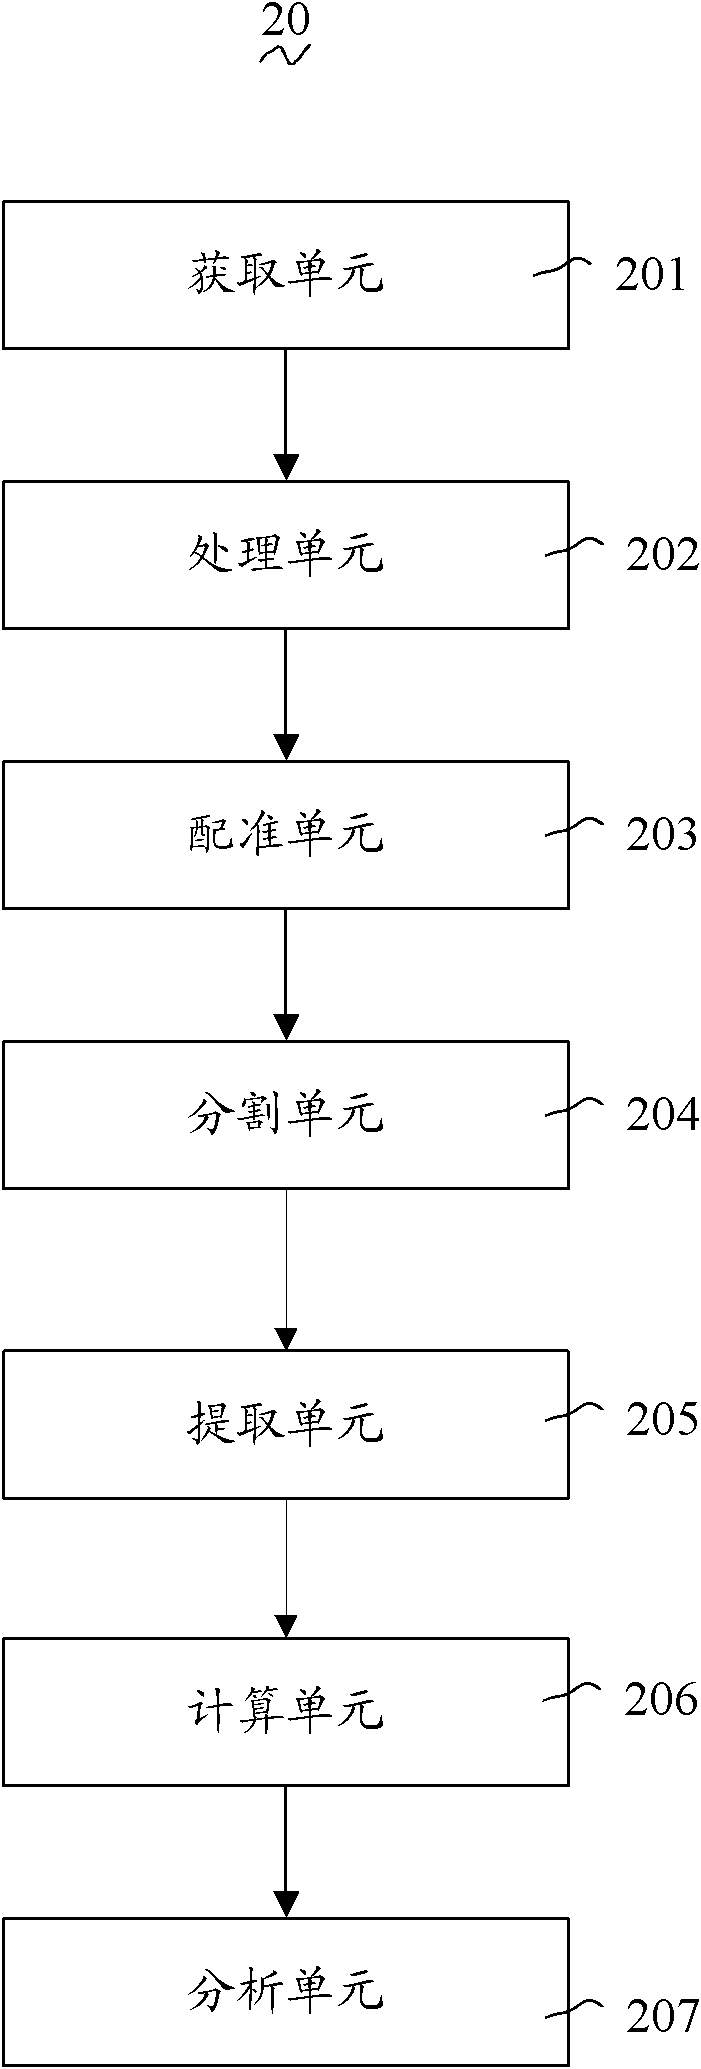
The invention discloses an image analysis method, which comprises the steps of: obtaining a group of T1 weighted images including a control group image and an experimental group image, pre-processing all T1 weighted images, carrying out non-linear registration on preprocessed T1 weighted images into a preset template image, dividing the non-linear registered T1 weighted images to generate a plurality of interest regions, extracting at least one feature data of each interest region to obtain feature matrix information, calculating to obtain a reference value according to a preset Bayesian multi-layer model and the feature matrix information, and judging difference significance of the interest regions between the experimental group image and the control group image according to the relation between the reference value and a preset threshold value. The invention also provides a corresponding image analysis system. The image analysis method and the system can extract more and richer parameters to be analyzed and more diverse information in comparison with the conventional technology, and can simultaneously process multi-region multi-feature significance statistical test so that morphology analysis is more complete.

Description

【Technical field】 [0001] The invention relates to the field of magnetic resonance calculation anatomy, in particular to a method and system for analyzing magnetic resonance images. 【Background technique】 [0002] The development of the human brain is almost a replay of the development and evolution of human brain nervous tissue over tens of millions of years. It also has a physiological development process and biological development law from low to high. The development of the human brain can be divided into three periods: the accelerated growth period of the brain from birth to adulthood; the relatively stable period after the brain matures; and the aging period of the brain after people reach old age. Since the structure of the human brain has formed a certain law in its own development process, the parts, time and performance of the human brain mature or decline are also different. Knowing the law of brain development is of great help to the understanding of human intell...

Claims


Application Information

Patent Timeline
IPC IPC(8): G06T7/00
Inventor 隆晓菁潮毅邱本胜张丽娟刘新郑海荣
Owner SHENZHEN INST OF ADVANCED TECH CHINESE ACAD OF SCI
Why Eureka
Try Eureka