Gantt chart generating method and system

A Gantt chart and relational technology, applied in the database field, can solve problems that affect system performance and cannot realize hierarchical management and control of organizational units, so as to improve performance and efficiency, realize data isolation and effective sharing, and avoid large-scale data interaction Effect

Inactive Publication Date: 2012-07-04
KINGDEE SOFTWARE(CHINA) CO LTD
View PDF3 Cites 17 Cited by
  • Summary
  • Abstract
  • Description
  • Claims
  • Application Information

AI Technical Summary

Problems solved by technology

[0005] In view of this, the present invention provides a method to overcome the problem that all operations for generating the project Gantt chart in the prior art are concentrated in the same ...

Method used


Image

  • Gantt chart generating method and system
  • Gantt chart generating method and system
  • Gantt chart generating method and system

Examples


Embodiment 1

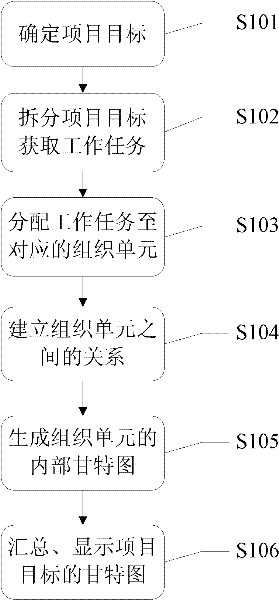
[0060] Please refer to the attached figure 1 , is a flow chart of a method for generating a Gantt chart disclosed in the present invention, mainly comprising the following steps:

[0061] Step S101, determine the current project target to be processed.

[0062] Step S102, splitting the project target, and obtaining different work tasks with construction periods, each of which has an upstream-downstream relationship.

[0063] When performing step S102 to decompose the determined project goal, the project goal is decomposed into "specific level" work tasks according to the requirements of organizational management and control, that is, the different work tasks that make up the project goal are obtained by decomposing, and each work task carries There is an upstream and downstream relationship between the respective stipulated durations and the acquired work tasks, that is, the relationship of successive execution.

[0064] Step S103, assigning each of the work tasks to corresp...

Embodiment 2

[0082] On the basis of the above disclosed embodiments of the present invention, the present invention also discloses a flow chart of a method for generating a Gantt chart, which mainly includes the following steps:

[0083] Step S101, determine the current project target to be processed.

[0084] Step S102, splitting the project target, and obtaining different work tasks with construction periods, each of which has an upstream-downstream relationship.

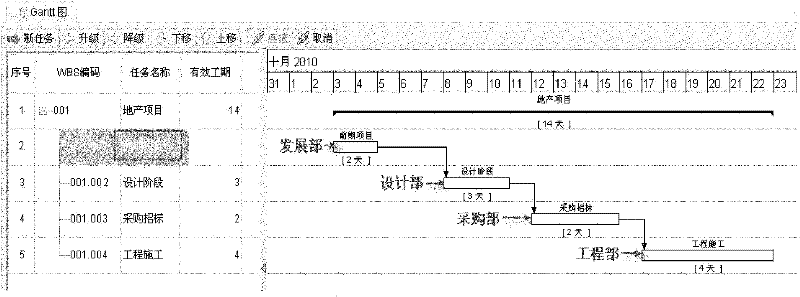
[0085] Step S103, assigning each of the work tasks to corresponding organizational units.

[0086] Step S104, establishing the relationship between each of the organizational units according to the upstream and downstream relationship of the work tasks in each of the organizational units.

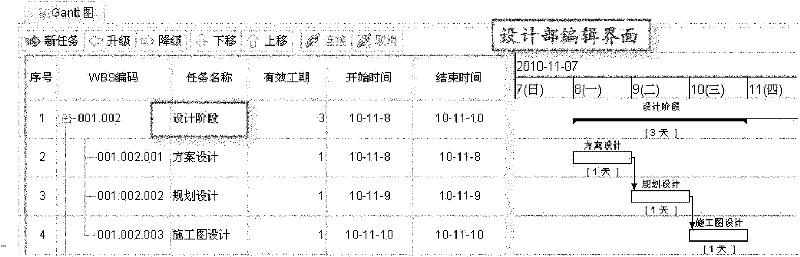
[0087] Step S105, refine the work tasks in each of the organizational units, and generate an internal Gantt chart of each of the organizational units.

[0088] Step S107, approve the internal Gantt chart of each of the organizational unit...

Embodiment 3

[0110] Please refer to the attached Figure 11 , is a schematic structural diagram of a Gantt chart generation system disclosed in an embodiment of the present invention, mainly including: a splitting unit 401 , an allocation unit 402 , a creation unit 403 , a refinement drawing unit 404 and a summary display unit 405 .

[0111] The splitting unit 401 is configured to split the project goal and obtain different work tasks with a construction period.

[0112] The allocation unit 402 is configured to allocate each of the work tasks to corresponding organizational units.

[0113] The creation unit 403 is configured to establish a relationship between each of the organization units according to the upstream and downstream relationships of the work tasks in each of the organization units.

[0114] The detailed drawing unit 404 is configured to refine the work tasks in each of the organizational units, and generate an internal Gantt chart of each of the organizational units.

[01...


PUM


Abstract

The invention discloses a Gantt chart generating method and system. The method comprises the following steps of: splitting project objectives, and acquiring work tasks carrying construction periods, wherein upstream-downstream relations exist among the work tasks; distributing each work task into a corresponding organizational unit; detailing the work task in each organizational unit, generating an internal Gantt chart in each organizational unit; and summarizing organizational units, and automatically displaying internal Gantt charts in the organizational units on the same interface, so as to obtain a whole Gantt chart of the project objectives. By adopting the method and system disclosed by the invention, hierarchical control among the organization units and independent drawing on the internal Gantt charts can be realized, and finally the internal Gantt charts are automatically summarized and the Gantt charts of the whole project are displayed by the system. Data isolation and effective sharing are realized, and large-scale data interaction with a database is avoided, thus performance and efficiency of the system are improved.

Description

technical field [0001] The present invention relates to the field of databases, and more specifically, relates to a method and system for generating a Gantt chart. Background technique [0002] When various industries are currently managing various projects, Gantt charts are used to complete the planning and sequencing of various projects. The Gantt chart, also known as the bar chart, is a graphical representation of a project work plan with a hierarchical relationship. It can be used to express the time schedule of all work tasks in a project and the relationship between work tasks in an intuitive way. Graphically, the sequence and duration of activities for any particular project are visualized through a work task list and a time scale. [0003] In modern enterprise project management, Gantt charts are widely used. It enables managers to make schedule arrangements for various project activities, and then monitor the planned progress and actual progress over time. , so th...

Claims


Application Information

Patent Timeline
IPC IPC(8): G06F17/30
Inventor 李涛邓博杨志桥
Owner KINGDEE SOFTWARE(CHINA) CO LTD
Why Eureka
Try Eureka