
Analyzing and processing method for test data of manual pollution flashover of insulator

A technology of data analysis and processing and flashover test, which is applied in the direction of measuring devices, instruments, measuring electronics, etc., can solve the problems of lack of robustness of regression equation, increase of statistical error, exaggeration of the influence of singular value of test data, etc., to improve regression Accuracy, eliminating the interference of abnormal data, and improving the effect of prediction accuracy

Inactive Publication Date: 2012-07-18
ELECTRIC POWER RES INST OF STATE GRID ZHEJIANG ELECTRIC POWER COMAPNY
View PDF1 Cites 11 Cited by
  • Summary
  • Abstract
  • Description
  • Claims
  • Application Information

AI Technical Summary

Problems solved by technology

However, there are also limitations when using the least squares method to determine the pollution flashover voltage: ① It is only suitable for cases where the test data is highly correlated, not suitable for discrete data and singular values ​​(it does not have the same sample statistical characteristics as other data) Existing situation; ②Since the least squares method solves the regression coefficient by calculating the sum of squared residuals to achieve the minimum, it is easy to exaggerate the influence of singular values ​​in the test data, and the statistical error increases, which makes the regression equation lack of robustness

Method used


Image

  • Analyzing and processing method for test data of manual pollution flashover of insulator
  • Analyzing and processing method for test data of manual pollution flashover of insulator
  • Analyzing and processing method for test data of manual pollution flashover of insulator

Examples


Embodiment Construction

[0028] Utilize method described in the present invention to carry out following concrete application:

[0029] Table 1 shows the test data of pollution flashover voltage of 7 pieces of XP-160 insulator series.

[0030] Table 1 Pollution flashover voltage test data of XP-160 insulator

[0031]

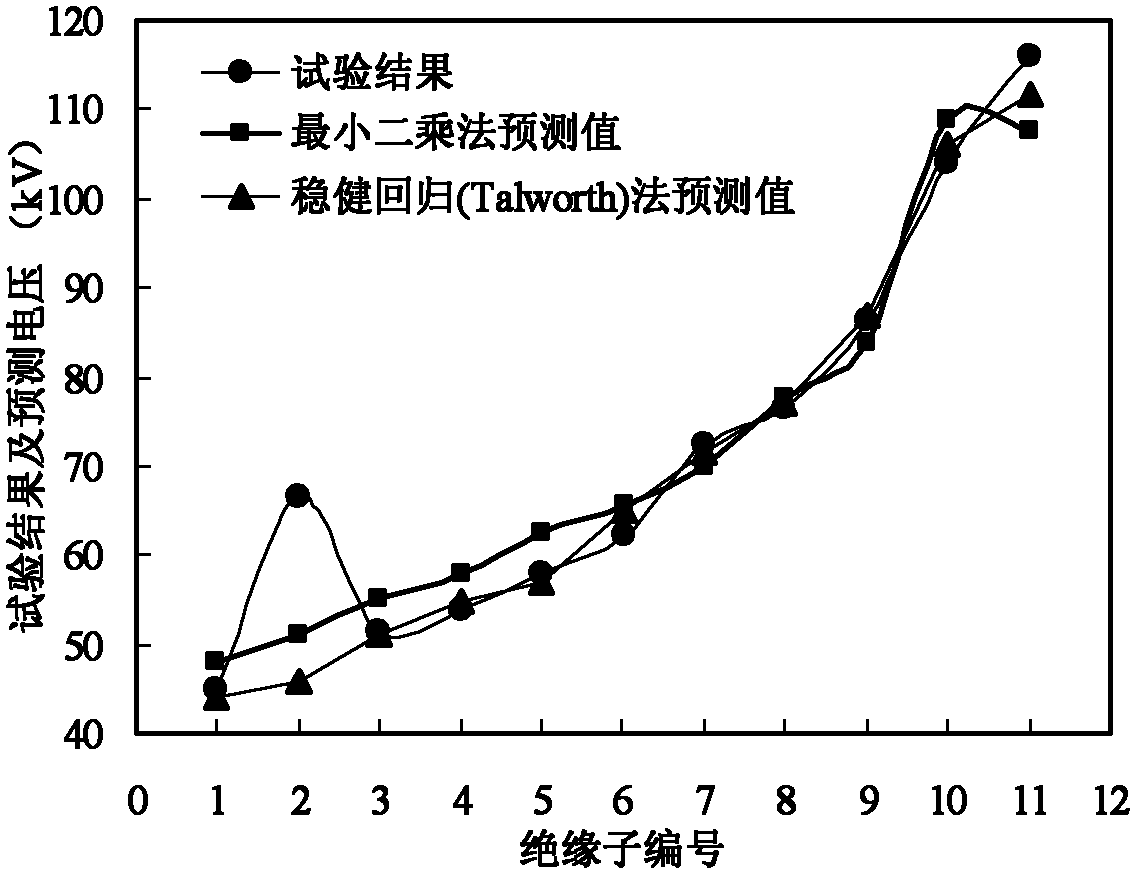
[0032] Observing the data in Table 1, it can be seen that the data of the 11th group may be abnormal data, which may be due to the high voltage value of the pollution flashover test, or the inaccurate measurement results of the salt-ash density.

[0033] In the following, the robust regression method is used to process the test data of insulator pollution flashover voltage.

[0034] Specific steps are as follows:

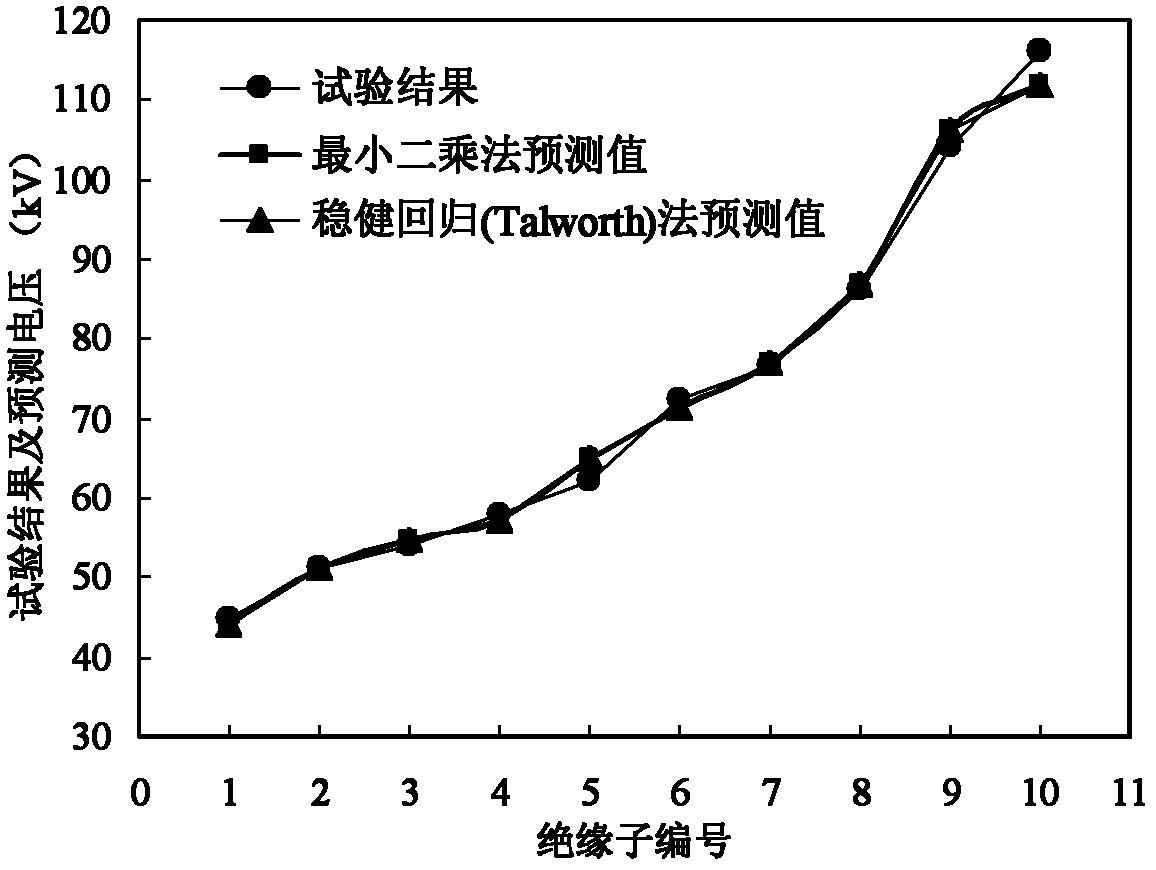
[0035] ① Regardless of the abnormal data, the regression calculation is performed on the insulator pollution flashover voltage test data:

[0036] The results of least squares regression and robust regression are shown in Table 2 and figure 2 shown.

[0037] Table 2 ...


PUM


Abstract

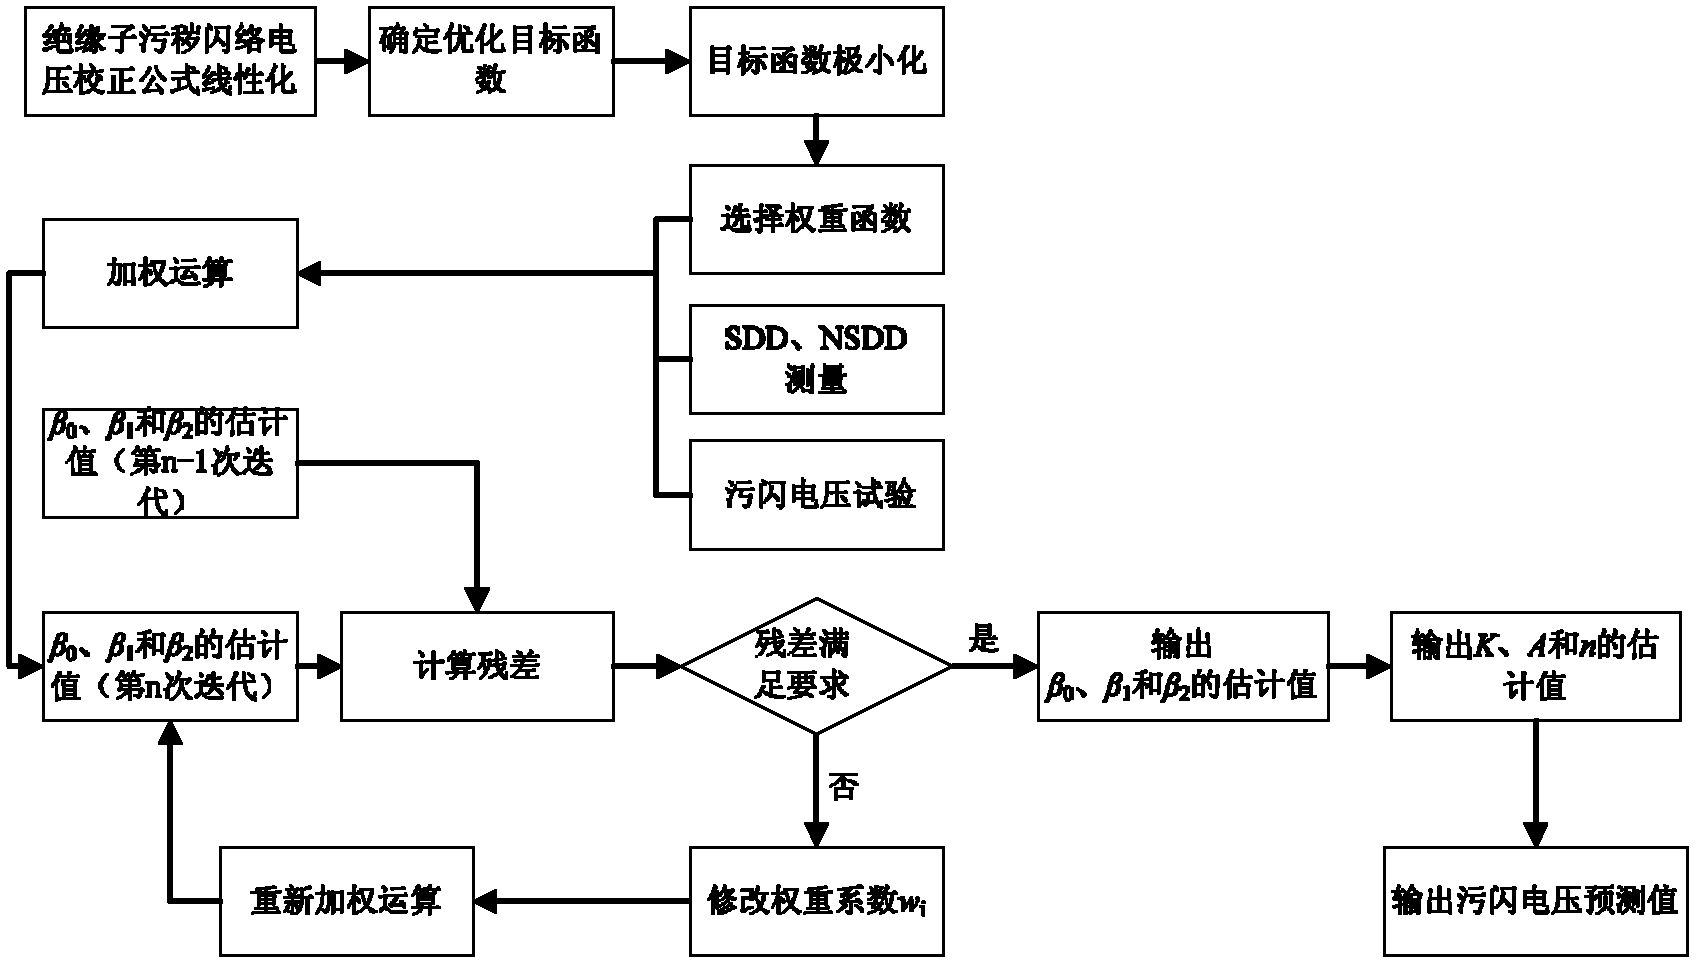
The invention relates to an analyzing and processing method for test data of manual pollution flashover of an insulator based on a steady regression algorithm. At present, the least square method used to determine the flashover voltage is only adaptive to the condition that test data dependency is higher, and easy to exaggerate the influence of a singular value in the test data, thereby increasing the statistic error, so that the regression equation is short of steadiness. The invention provides the analyzing and processing method for test data of manual pollution flashover of the insulator. The method is characterized by comprising the steps of: solving a regression coefficient by a reweighted least square iterative algorithm according to the salt deposit density, and ash density on the surface of the insulator and the voltage test data of the pollution flashover; adopting the weighting function in iterative calculation, wherein the weighting coefficient is the residual function iterated last time so as to reduce the influence of the singular value on the regression coefficient; and mapping a salt density influence characteristic index and an ash density influence characteristic index by the regression coefficient and predicting the pollution flashover voltage of the insulator. The method provided by the invention improves the predicting precision of the pollution flashover voltage and effectively eliminates the interference of abnormal data.

Description

technical field [0001] The invention relates to the processing of insulator pollution flashover voltage test data, in particular to an insulator artificial pollution flashover test data analysis and processing method based on a robust regression algorithm. Background technique [0002] In order to grasp the pollution flashover characteristics of various structural forms of insulators under different environmental conditions, and realize the prediction and prevention of pollution flashover, domestic and foreign scholars have carried out a large number of experimental research work and obtained a large amount of experimental data. However, due to the different sizes, shapes and surface processing conditions of different insulators (such as whether there are burrs and bumps on the surface of metal accessories), as well as the existence of test measurement errors, the repeatability and reproducibility of the pollution flashover voltage test results are poor, which has great poten...

Claims


Application Information

Patent Timeline
Patent Type & Authority Applications(China)
IPC IPC(8): G01R31/00
Inventor 吴锦华王少华梅冰笑刘黎龚坚刚罗盛叶自强
Owner ELECTRIC POWER RES INST OF STATE GRID ZHEJIANG ELECTRIC POWER COMAPNY
Learn More