Method for visualizing data field corresponding to coordinate system
A coordinate system and data field technology, applied in the field of data visualization, can solve problems such as incomprehension and rapid viewing by observers
Inactive Publication Date: 2013-04-17
上海纳普智能科技股份有限公司
View PDF2 Cites 6 Cited by
- Summary
- Abstract
- Description
- Claims
- Application Information
AI Technical Summary
Problems solved by technology
It is impossible to display the data values of all points in a plane to the observer in real time and visually, and it is impossible for the observer to have an overall understanding of the data values in the entire three-dimensional coordinate system, and it is impossible to see the relative relationship between the points at a glance. The data value is high or low, and it is impossible for the observer to quickly see whether there are points with data values exceeding a reasonable range, and the distribution of these points
Method used
View moreImage
Smart ImageViewing Examples
Examples
Embodiment 1
Login to View More PUM
 Abstract
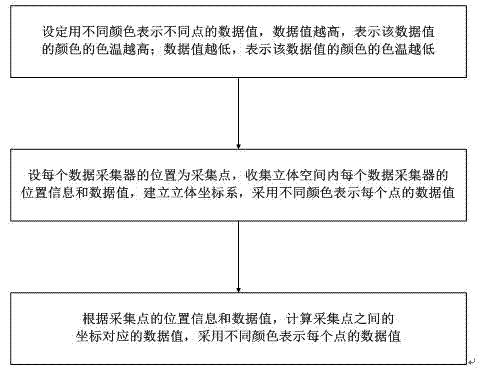
The invention discloses a method for visualizing data field corresponding to the coordinate system and utilizes data acquirers in stereoscopic matrix arrangement. The method includes steps of (1) indicating data values of different points by different color; (2) setting the position of each data acquirer as an acquisition point, collecting position information and data values of each data acquirer in a stereoscopic space to establish a stereoscopic coordinate system, and indicating the data value of each point by different color; and (3), calculating the data values corresponding to the coordinates among the acquisition points according to the position information the data values of the acquisition points and indicating the data value of each point by different color, wherein the higher the data values are, the higher the color temperature of the color of the data values is, and the lower the data values are, the lower the color temperature of the color of the data values is. By the aid of the method for visualizing the data field corresponding to the coordinate system, the data values of the integral stereoscopic coordinate system can be acquired integrally, and by means of vivid color, an observer can quickly observe whether points with data values exceeding reasonable range exist or not and acquires distribution conditions of the acquisition points.
Description
technical field [0001] The invention relates to the field of data visualization, in particular to a data field visualization method corresponding to a coordinate system. Background technique [0002] Visualization is the theory, method and technology of using computer graphics and image processing technology to convert data into graphics or images and display them on the screen for interactive processing. It involves many fields such as computer graphics, image processing, computer vision, and computer-aided design, and has become a comprehensive technology for studying a series of issues such as data representation, data processing, and decision analysis. The virtual reality technology currently being developed by Fit is also based on the visualization technology of graphics and images. Visualization technology was first used in computer science and formed an important branch of visualization technology - Visualization in Scientific Computing. Scientific computing visu...
Claims
Login to View More Application Information
Patent Timeline
 IPC IPC(8): G06F17/40
Inventor 倪成胜唐勇
Owner 上海纳普智能科技股份有限公司
Features
- R&D
- Intellectual Property
- Life Sciences
- Materials
- Tech Scout
- Unparalleled Data Quality
- Higher Quality Content
- 60% Fewer Hallucinations
Learn More Browse by: Latest US Patents, China's latest patents, Technical Efficacy Thesaurus, Application Domain, Technology Topic, Popular Technical Reports.
© 2025 PatSnap. All rights reserved.Legal|Privacy policy|Modern Slavery Act Transparency Statement|Sitemap|About US| Contact US: help@patsnap.com

