Unequal class interval histogram rendering method based on empirical distribution function

An empirical distribution function and histogram technology, which is applied in image data processing, 2D image generation, instruments, etc., can solve the problems of rough estimation, no consideration of data (sample density, large error, etc.), and achieve the effect of accurate description

Inactive Publication Date: 2013-07-24
BEIHANG UNIV
View PDF2 Cites 9 Cited by
  • Summary
  • Abstract
  • Description
  • Claims
  • Application Information

AI Technical Summary

Problems solved by technology

If the group distance is too small, the frequency of each group is small. Due to the influence of randomness, the frequency in adjacent intervals may vary greatly, and the distribution pattern cannot be shown; if the group distance is too large, the distribution form reflected by the histogram is not sensitive.
[0004] Although the traditional equal group distance histogram can also reflect the change law of the data, it does not consider the density of the data (sample), and the same group distance is used in the concentrated and sparse areas of the sample points
In this way, due to the concentrated sample information near the mode, the equigroup distance histogram is estimated to be too flat in this area; while in the area with relatively few data such as the tail, it will lead to a "zero density" interval, which is different from the actual In the case of inconsistency, especially when the sample size is small or the distribution changes rapidly or heavy-tailed data, the error of the equal group distance histogram is large, and the estimation is very rough

Method used


Image

  • Unequal class interval histogram rendering method based on empirical distribution function
  • Unequal class interval histogram rendering method based on empirical distribution function
  • Unequal class interval histogram rendering method based on empirical distribution function

Examples


Embodiment Construction

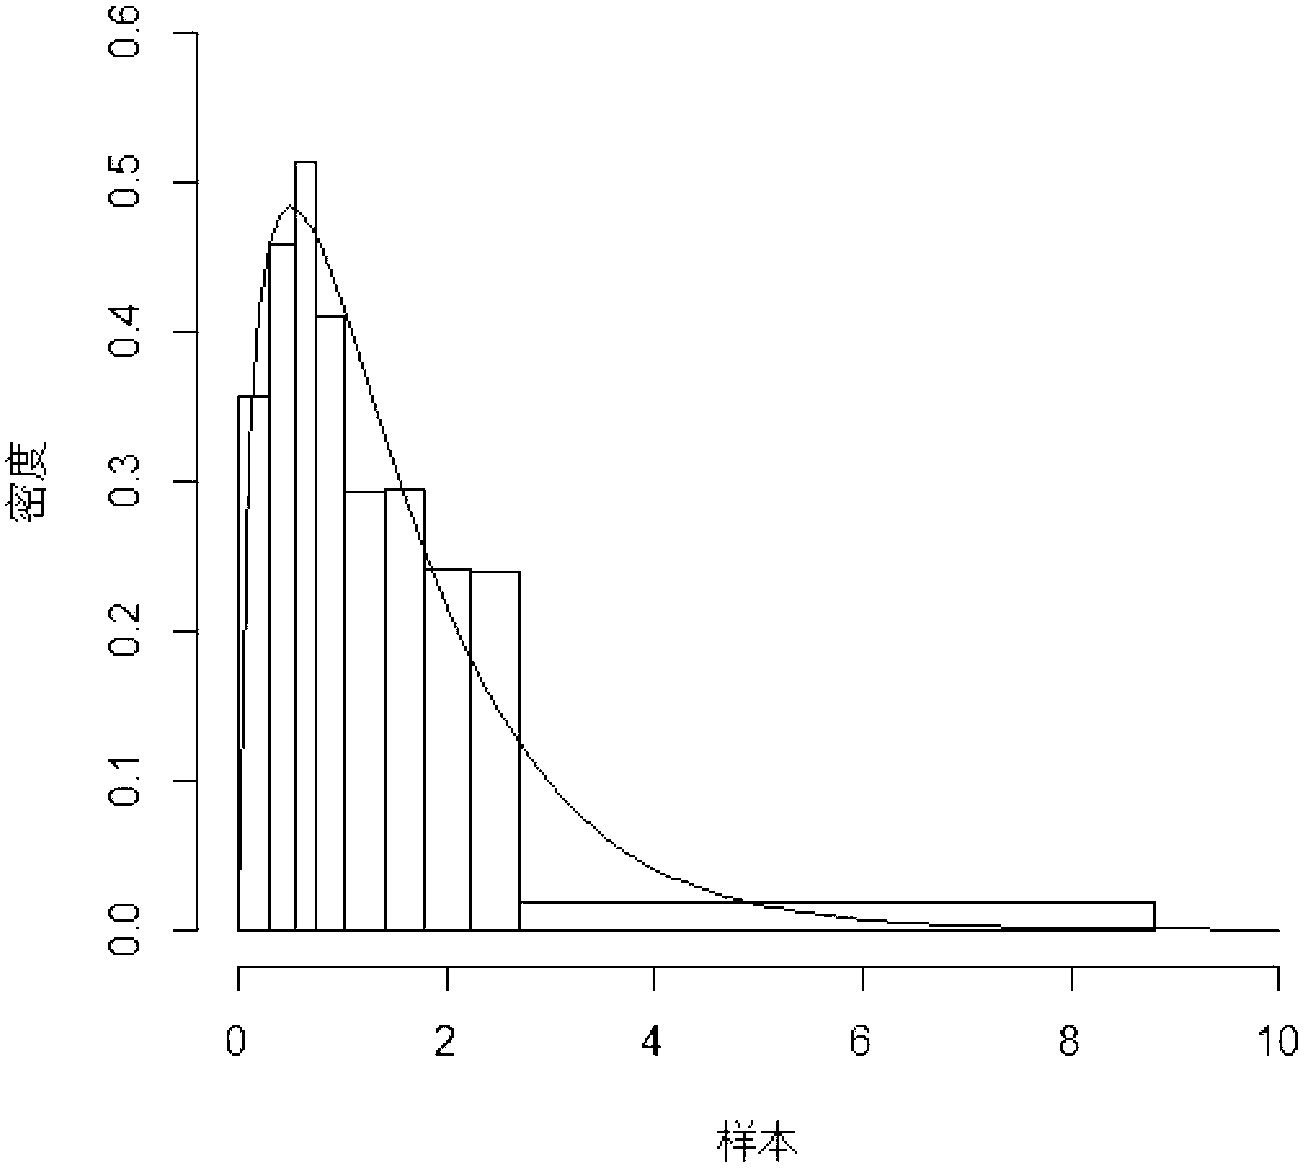
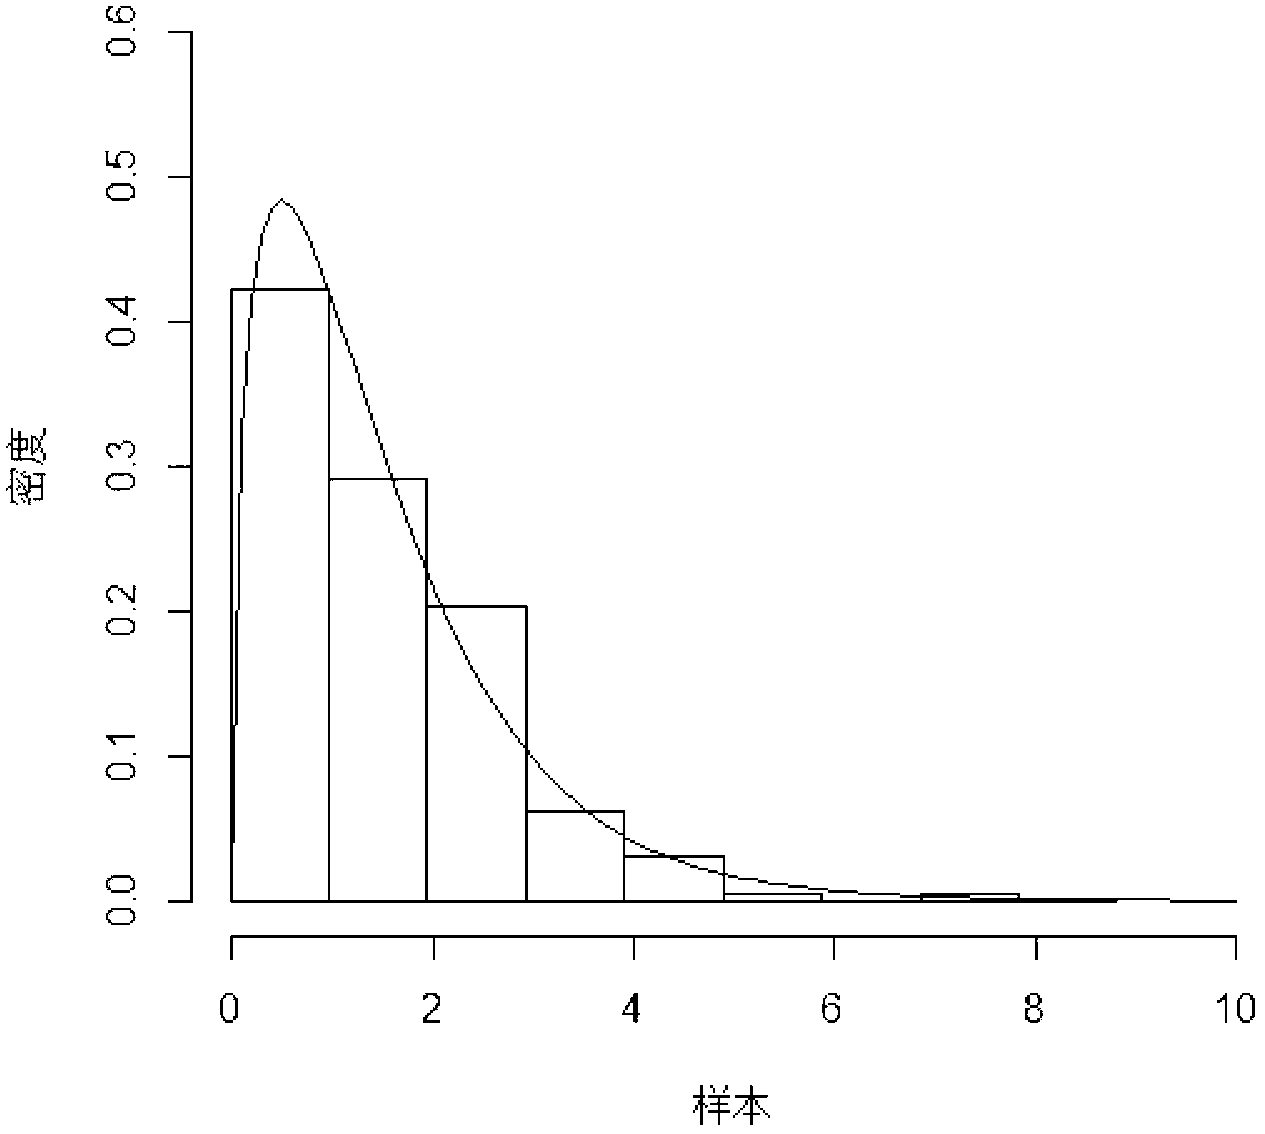
[0043] ⅠThe following takes the gamma distribution with shape parameter 1.5 and scale parameter 1 as an example, and in conjunction with the accompanying drawings, the present invention will be further described in detail. Example data see Table 2

[0044] Table 2 Gamma distribution random numbers with shape parameter 1.5 and scale parameter 1 (sample size n=200)

[0045]

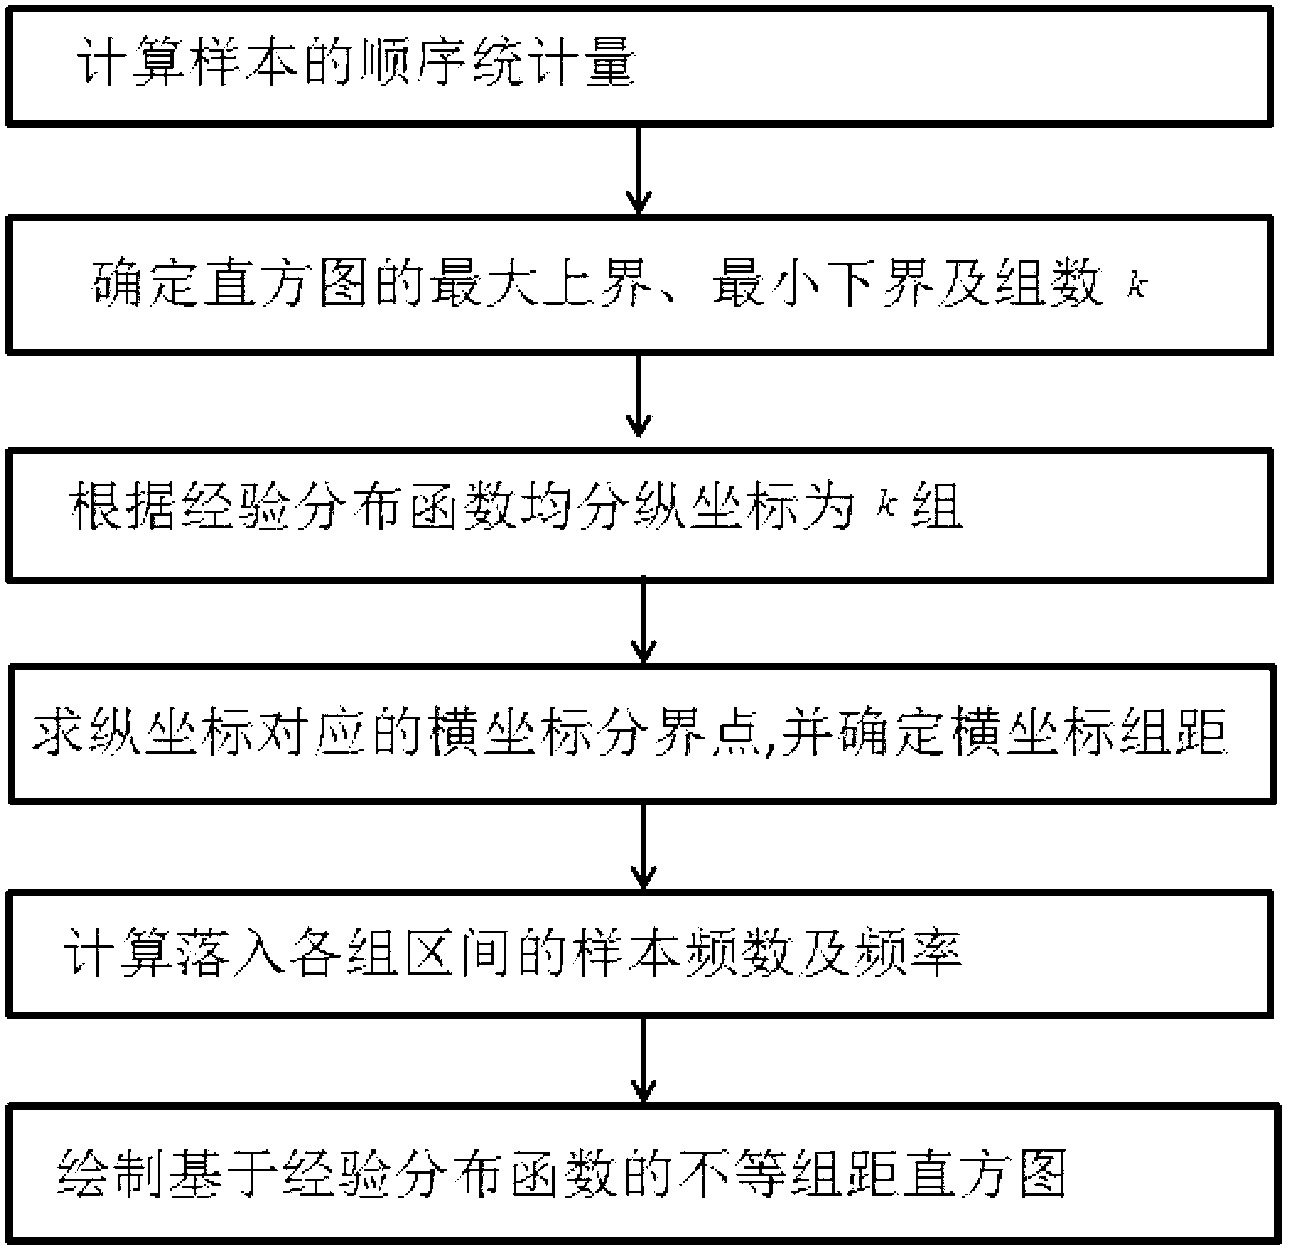
[0046] According to the data in Table 2, see image 3 , using a method for drawing a histogram of unequal intervals based on an empirical distribution function proposed by the present invention, the specific drawing steps are as follows:

[0047] Step 1: Use statistical sampling method to collect n sample data x from the population 1 ,x 2 ,...,x n , rearranging them in ascending order as x (1) ≤x (2) ≤...≤x (n) , thus obtaining the order statistic x of the sample data (1) ,x (2) ,...,x (n) , where x (i) , 1≤i≤n is the i-th order statistic of the sample;

[0048] In this embodiment, n=200, and...


PUM


Abstract

The invention provides an unequal class interval histogram rendering method based on an empirical distribution function. Aiming at the fact that an equal class interval histogram can not reflect distribution characteristics of a sample adequately, the distribution characteristics of the sample reflected by the equal class interval histogram is inconsistent with an actual situation, and the unequal class interval histogram rendering method based on the empirical distribution function is brought out by means of the property that the empirical distribution function is effective fitting of a distribution function. The rendering method includes the specific steps: 1, computing order statistic of the sample; 2, confirming maximum upper bond, minimum lower bond and class count k of a histogram; 3, dividing a vertical coordinate into k classes equally according to the empirical distribution function; 4, calculating demarcation points, corresponding to k classes of vertical coordinates, of a horizontal coordinate, confirming class intervals of k classes of horizontal coordinates; 5, computing frequency number and frequency of the sample dropping in each class interval; and 6, rendering the unequal class interval histogram based on the empirical distribution function. By means of a graphic method and comparative mean integrated square error (MISE), the histogram rendered through the unequal class interval histogram rendering method based on the empirical distribution function is testified to have an accurate fitting effect.

Description

technical field [0001] The invention relates to a method for drawing a histogram with unequal intervals based on an empirical distribution function, which can effectively select parameter distribution and estimate distribution density, and is suitable for quality management, medical statistics, image processing and other related technical fields. Background technique [0002] Histogram is one of the most commonly used methods to organize data and find its regularity. Through the shape of the histogram, the overall distribution of a batch of data (a sample) can be preliminarily judged, and the distribution status of the data can be displayed intuitively. Therefore, histograms are one of the most common density estimation and data analysis tools. [0003] The traditional histogram is made by the method of equal group intervals, with the group interval as the base and the frequency as the height, which can intuitively display the distribution state of the sample, so as to judg...

Claims


Application Information

Patent Timeline
Patent Type & Authority Applications(China)
IPC IPC(8): G06T11/00
Inventor 杨军刘秀亭余欢赵宇
Owner BEIHANG UNIV
Why Eureka
Try Eureka