Voronoi and inverse distance weighting combined density map drawing method

A technology of inverse distance weighting and Thiessen polygons, which is applied in maps/plans/charts, special data processing applications, instruments, etc., can solve problems such as ignoring the scope of influence, and achieve less subjective factors, easy operation, and flexible use.

Inactive Publication Date: 2013-10-02
NANJING UNIV
View PDF3 Cites 20 Cited by
  • Summary
  • Abstract
  • Description
  • Claims
  • Application Information

AI Technical Summary

Problems solved by technology

In addition, the simple point density calculation method counts the number of discrete points in a neighborhood of uniform size, but ignores the difference in point density within the neighborhood; while the kernel density est...

Method used


Image

  • Voronoi and inverse distance weighting combined density map drawing method
  • Voronoi and inverse distance weighting combined density map drawing method
  • Voronoi and inverse distance weighting combined density map drawing method

Examples


Embodiment Construction

[0032] The purpose and effects of the present invention will become more apparent by referring to the accompanying drawings in detail of the present invention.

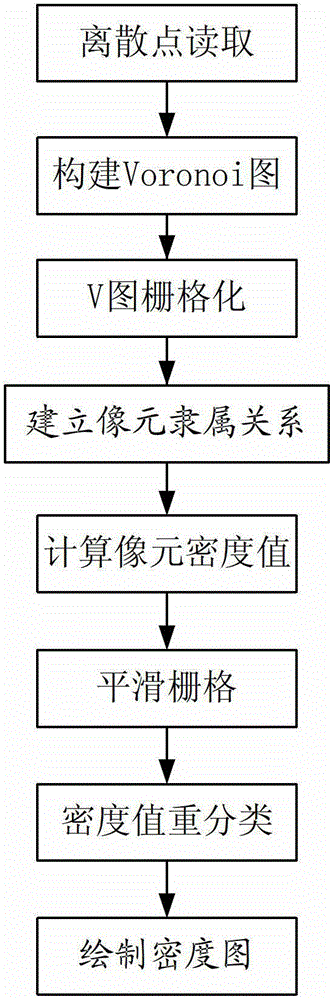
[0033]Such as figure 1 Shown is the flow chart of the present invention's combined Thiessen polygon and inverse distance weighted density map drawing method, comprising the following steps:

[0034] The first step, reading discrete points—reading a set of discrete points as raw data, the discrete points have their own serial numbers and coordinate data.

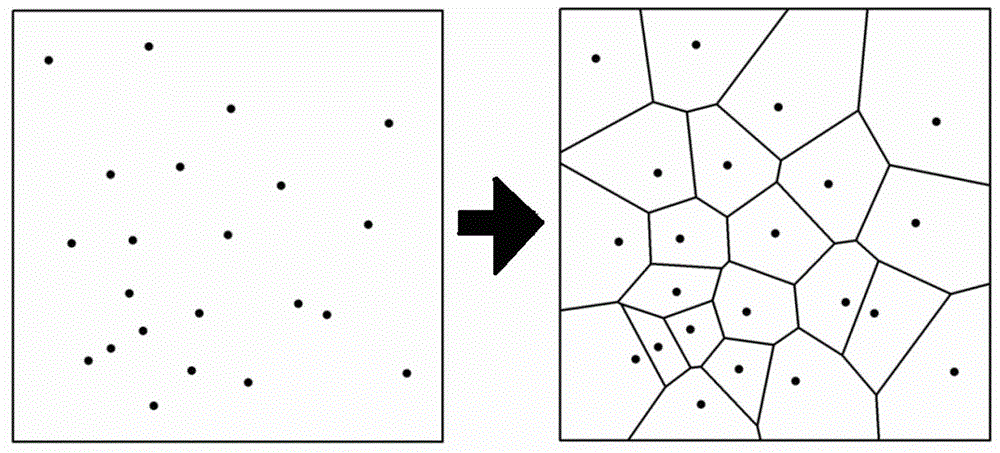
[0035] Read the coordinates of discrete points, and display the position of each point according to the proportional relationship between the screen coordinate range and the discrete point coordinate range ( figure 2 left). In this example, the discrete point number is stored as the attribute data of the discrete point.

[0036] The second step is to construct a Voronoi diagram——construct a Voronoi diagram based on all discrete points in the discrete point set, a...


PUM


Abstract

The invention discloses a Voronoi (V) and inverse distance weighting combined density map drawing method which comprises the steps that discrete point data is read; a V map is constructed by discrete points; a whole V map area is rasterized; a density value of pixels is computed according to a subordination relationship between the pixels and a V polygon and distances between a pixel center point in the V polygon and the discrete points; and all generated grids are rendered finally after subjected to neighborhood mean value smoothing processing, re-classified, and endowed with different gray-scale values in order to make results more reasonable. The V map constructed based on the discrete points is divided into generation influence ranges of the discrete points by a space constrained based on the shortest distance, and local density computation is performed within the ranges, so that the comparability and the reliability of computation results among the various influence ranges are guaranteed; and the method takes account of differences of the point density of the different pixels within the influence ranges, and a density value distribution method based on the distances is adopted in the V polygon where each point is located, so that the results are more reasonable and accurate.

Description

[0001] This case is a divisional application of the Chinese invention patent application 201210146965.2, the filing date is 2012-05-11, and the name is "a method for making point density thematic maps based on Voronoi diagrams". technical field [0002] The invention proposes a method for making a point density thematic map, which belongs to the interdisciplinary field of Voronoi diagram (Voronoi polygon is also called "Tyssen polygon") application technology in computational geometry, cartography and geographic information system (GIS). Background technique [0003] The calculation of point density refers to estimating the number of points per unit area at the location of any point in the area according to the distribution of points in the area. In geoscience applications, the calculation of point density is a theoretical abstraction after summarizing and summarizing issues such as settlement density calculations and building density calculations. ICA), computer vision and ...

Claims


Application Information

Patent Timeline
IPC IPC(8): G06F17/30G09B29/00
Inventor 王结臣芮一康崔璨王豹周生路
Owner NANJING UNIV
Why Eureka
Try Eureka