
Method for measuring signal frequency and harmonic parameters of electric power system

A power system and signal frequency technology, applied in the field of measuring frequency and harmonic parameters, can solve problems such as large number of items, long calculation time, and unsatisfactory spectrum side lobe characteristics

Inactive Publication Date: 2013-10-16
WUHAN UNIV
View PDF2 Cites 27 Cited by
  • Summary
  • Abstract
  • Description
  • Claims
  • Application Information

AI Technical Summary

Problems solved by technology

[0004] However, due to the unsatisfactory spectral side lobe characteristics of the above window function, the suppression effect on spectrum leakage is limited, the analysis error of the frequency, amplitude and phase of the signal in the experiment is relatively large, and the number of iteration formulas is high and the number of items is large. longer time
Therefore, high-precision and fast frequency measurement and harmonic analysis are difficult to achieve

Method used


Image

  • Method for measuring signal frequency and harmonic parameters of electric power system
  • Method for measuring signal frequency and harmonic parameters of electric power system
  • Method for measuring signal frequency and harmonic parameters of electric power system

Examples


Embodiment

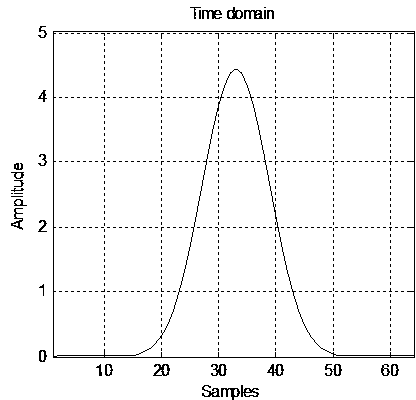
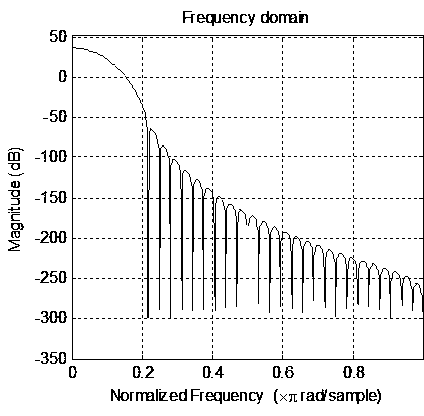
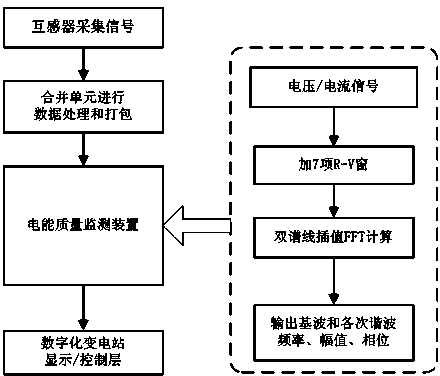
[0044] The schematic diagram of the present invention is shown in figure 2 , where the waveform of the actual signal is shown in image 3 , the windowed waveform is shown in Figure 4 , the harmonic amplitude and phase error analysis forms are shown in Table 1.

[0045] Specific embodiments of the present invention will be described in detail below in conjunction with the accompanying drawings, but they are not intended to limit the present invention.

[0046] The present invention can be used as a digital substation to perform harmonic measurement in a system that samples power signals according to the IEC61850-9-2 standard frame digital sampling rate. At present, the sampling rate of most digital substations is 10kHz, and a voltage harmonic signal is selected. x(t), such as image 3 shown.

[0047] The harmonic detection method of asynchronous sampling of the present invention comprises six steps:

[0048] Step a: at a fixed sampling frequency f s =10000Hz sampling ha...


PUM


Abstract

The invention relates to a method for measuring the signal frequency and harmonic parameters of an electric power system. The frequency, the amplitude and the phase of harmonics are acquired through modifying two maximum spectrum lines close to real frequency points in FFT data acquired by applying seven term Rife-Vincent (I) window to sampling data, wherein the seven term Rife-Vincent W(n)=sigma<k>(i=0)(-1)bicos(2pi / Nin), n=0, 1,.. N-1, wherein b0=1, b1=12 / 7, b2=15 / 14, b3=10 / 21, b4=1 / 7, b5=2 / 77 and b6=1 / 462. The method provided by the invention is simple to implement and can achieve very high precision in harmonic analysis applications of a digital substation, and the calculation is smaller than a general cosine window.

Description

technical field [0001] The invention relates to a method for measuring frequency and harmonic parameters, in particular to a method for measuring frequency and harmonic parameters based on bispectral interpolation FFT of a 7-item Rife-Vincent window. Background technique [0002] In the digital substation, the voltage and current signals collected by the transformer are sent to the merging unit (for preliminary data processing and data packaging), and then the merging unit is sent to the power quality monitoring device (this device completes the analysis of various indicators of power quality) . The voltage and current frequency in the power system is constantly changing, but the IEC61850-9-2 standard stipulates that the sampling frequency is a constant value, generally 10kHz. Serious spectrum leakage and fence effects can occur with conventional harmonic software algorithms. Spectrum leakage and fence phenomenon cause large errors in the amplitude, phase angle and frequen...

Claims


Application Information

Patent Timeline
IPC IPC(8): G01R23/02G01R23/16
Inventor 刘开培汪立张俊敏乐健
Owner WUHAN UNIV
Learn More