
Method of optimizing static safe and stable operation limit of electric power system

A power system and stable operation technology, which is applied in the field of static security and stability analysis and optimization of power systems, can solve problems such as the power grid operation mode where the power system under evaluation is at the limit of static security and stable operation, and achieve shortening of the work process and formulation time, and improving The effect of voltage quality and safety and stability, simple and easy to compile

Active Publication Date: 2014-04-23
GUANGXI UNIV
View PDF3 Cites 24 Cited by
  • Summary
  • Abstract
  • Description
  • Claims
  • Application Information

AI Technical Summary

Problems solved by technology

[0008] The present invention aims to solve the problem that the existing power system identification method cannot make the evaluated power system in the power grid operation mode of the static safe and stable operation limit, and provides a static safe and stable operation limit optimization method of the power system. The power grid of the evaluated power system is always in the power grid operation mode of the static safe and stable operation limit, and can perform power flow limit optimization calculation on the power grid of the evaluated power system, so as to realize that the power grid of the evaluated power system can pass BPA under the specified operation mode The power system calculation and analysis software obtains the power grid operation mode optimization data required for the static safety and stability operation limit of the evaluated power system, and can automatically calculate and verify the power grid operation mode optimization data. The verification results can be directly used to guide the compilation of the evaluated power system. The power grid operation mode under the static, safe and stable operation limit of the system to ensure the safe, stable and reliable operation of the power grid

Method used


Image

  • Method of optimizing static safe and stable operation limit of electric power system
  • Method of optimizing static safe and stable operation limit of electric power system
  • Method of optimizing static safe and stable operation limit of electric power system

Examples


Embodiment

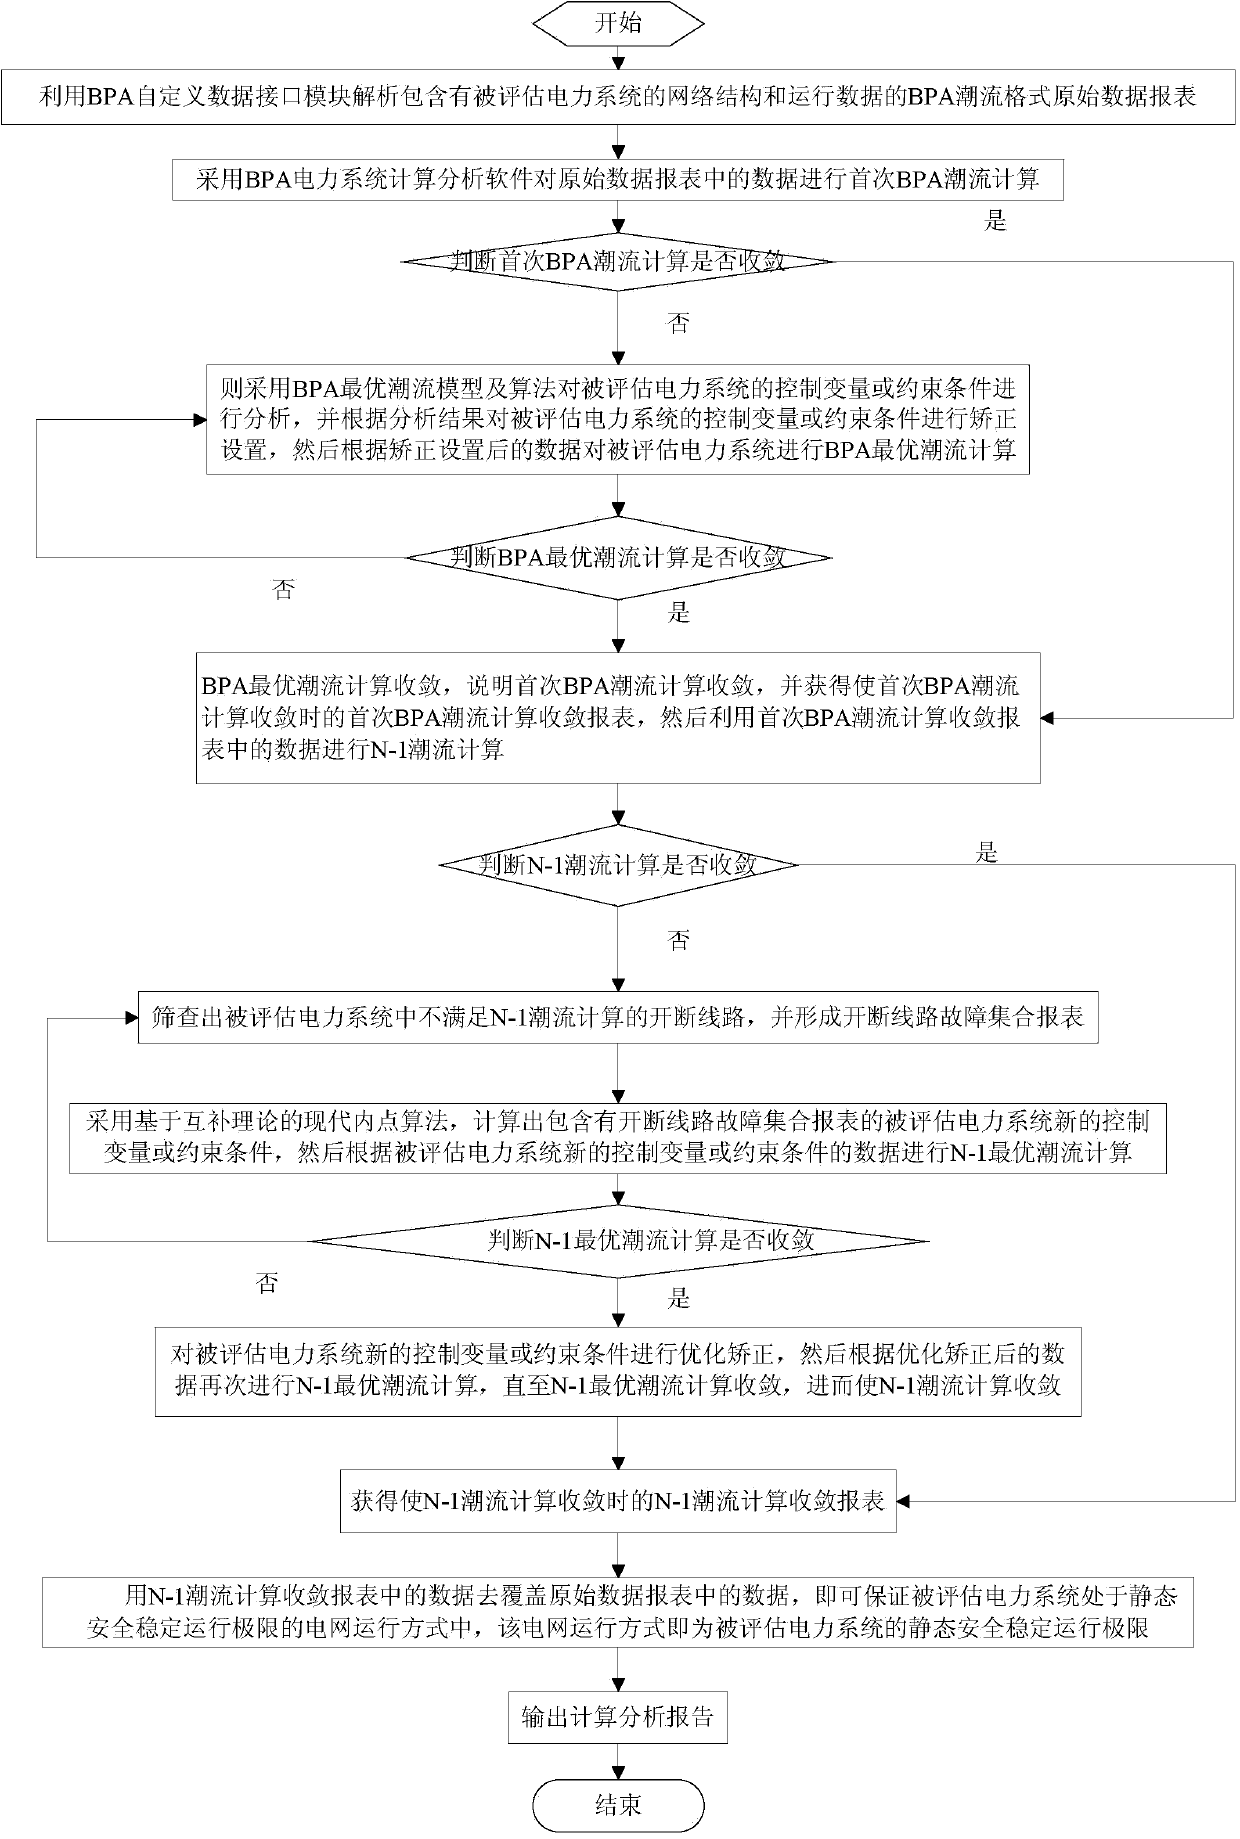
[0031] Embodiment: A method for optimizing static safe and stable operation limits of power systems, participated in figure 1 As shown, the steps are as follows:

[0032] Step 1, use the custom data interface module of BPA power system calculation and analysis software to analyze the original data report in BPA power flow format containing the network structure and operation data of the evaluated power system, and then analyze the network structure and operation data of the evaluated power system. While the data is analyzed by BPA network nodes, the network structure and operation data including the evaluated power system are also processed by BPA network node equivalents;

[0033] Step 2, then use the BPA power system calculation and analysis software to perform the first BPA power flow calculation on the data in the original data report;

[0034] Step 3: If the first BPA power flow calculation does not converge, then use the BPA optimal power flow model and algorithm to ana...

example 1

[0050] Example 1: Use BPA to perform N-1 simulated fault interruption: when the simulated disconnection of the lines from station A to station B will cause overloading of the lines from station A to station C; the simulated disconnection of the lines from station A to station C will cause ~ The line at station B is overloaded; the simulated disconnection of the lines at station D~B will cause the line at station A~C to be overloaded.

[0051] Table 1, Table 2 and Table 3 show the overload situation of power grid simulated disconnection line before optimization: when the line from station A to station B is disconnected, the load on the line from station A to station C is 331.8MVA, and the load rate is 121.8%; When the line from Station A to Station C is disconnected, the load on the line from Station A to Station B is 331.9MVA, and the load rate is 121.8%; when the line from Station D to Station B is disconnected, the load on the line from Station A to Station C is 303.4 MVA, t...

example 2

[0071] Example 2: Use BPA to perform N-1 simulated fault interruption: When the simulated disconnection of one circuit from station A to station B will cause the overload of the two circuits from station A to station B.

[0072] Table 9 shows the overload situation of the power grid simulated disconnection line before optimization: when one circuit line from station A to station B is disconnected, the load on the second circuit circuit from station A to station B is 486.8MVA, and the load rate is 123.7%.

[0073] The overload situation of the simulated disconnection line of the power grid after optimization is shown in Figure 10: when the one-circuit line from station A to station B is disconnected, the load on the two-circuit line from station A to station B is 392.9MVA, and the load rate is 99.82%.

[0074] Table 9 Simulated disconnection of line overload from station A to station B before optimization

[0075]

[0076] Table 10 Simulated disconnection of the line overloa...


PUM

PropertyMeasurementUnit
Loadaaaaaaaaaa

Abstract

The present invention discloses a method of optimizing the static safe and stable operation limit of an electric power system. The method comprises the steps of using a BPA electric power system calculating and analyzing software to analyze an original data report containing the network structure and operation data of an evaluated electric power system; then carrying out the BPA power flow calculation on the data in the original data report; if the BPA power flow calculation is not convergent, correcting a control variable or a constrained condition until the BPA load flow calculation is convergent; then carrying out the N-1 power flow calculation; if the N-1 power flow calculation is not convergent, carrying out the N-1 optimal power flow calculation until the N-1 optimal power flow calculation is convergent, and outputting an N-1 power flow calculation report; and then using the data in the N-1 power flow calculation report to substitute for the data in the original data report, so that the situation that the evaluated electric power system is located in a power grid operation manner of the static safe and stable operation limit is guaranteed.

Description

technical field [0001] The invention relates to the field of static safety and stability analysis and optimization of power systems, in particular to a method for optimizing static safety and stability operating limits of power systems. Background technique [0002] With the development of the power system, the grid scale of the power system is getting larger and larger, and the security and stability of the power grid are becoming more and more complicated. In particular, the static security and stability of the power grid has increasingly become the focus of the power system. In order to improve the safe and stable operation of the power grid, reduce the loss of the power grid, and ensure the safe and economical operation of the power grid, the ability to regulate the transmission power of the transmission section of the power grid should be enhanced, and the physical and operational restrictions on control variables, state variables, and variable functions should be reason...

Claims


Application Information

Patent Timeline
IPC IPC(8): H02J3/00
Inventor 阳育德李凌李滨邓秋荃梁振成孙艳韦化
Owner GUANGXI UNIV
Learn More