Acoustic Time-difference Discrimination Method for Complex Lithology Natural Gas Formation
A technology of sonic time difference and natural gas layer, which is applied in wellbore/well components, measurement, earth-moving drilling, etc., to improve the discrimination effect and have a good application prospect.
- Summary
- Abstract
- Description
- Claims
- Application Information
AI Technical Summary
Problems solved by technology
Method used
Image
Examples
Embodiment 1
[0043] As the best implementation mode of the present invention, it uses formation lithology and mineral composition, porosity, water saturation and formation water resistivity factors to calculate a theoretical value curve of acoustic wave time difference, and compare the theoretical value curve of acoustic wave time difference obtained by calculation with the actual measured value. The gas layer can be identified according to the difference between the two acoustic time-difference curves.
[0044] The specific method of "calculating a theoretical value curve of acoustic time difference by using formation lithology mineral composition, porosity, water saturation and formation water resistivity factors" is as follows:
[0045] a. Experimentally determine rock-electricity parameters
[0046] The cored rock samples were subjected to rock electrical experiments under simulated formation conditions to obtain the rock cementation index m, water saturation index n and coefficients a...
Embodiment 2
[0068] As a verification example of the present invention, with reference to the accompanying drawings in the description:
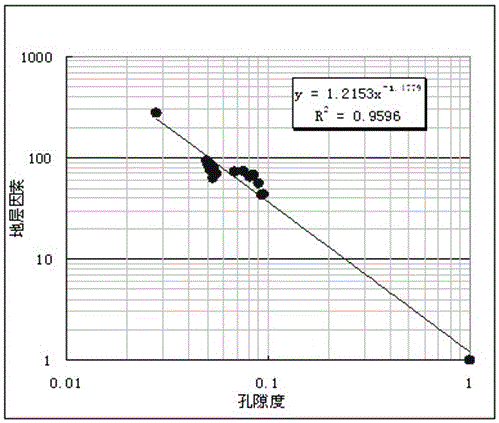
[0069] figure 1 The cross plot of formation factors and porosity obtained from the results of lithoelectric experiments on clastic rock formations in a certain block. The lithoelectric experiments were carried out under the conditions of simulated formation temperature, formation pressure and formation water salinity, and the cementation index was obtained according to the experimental results. m=1.5 and a=1.2;
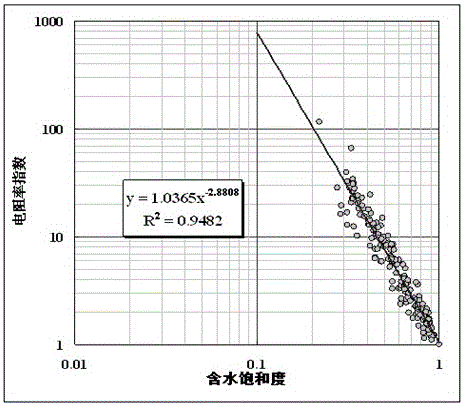
[0070] figure 2 It is the intersection graph of resistivity index and water saturation obtained from the rock electric experiment, and the saturation index n=2.9 and b=1.0 are obtained according to the experimental results;
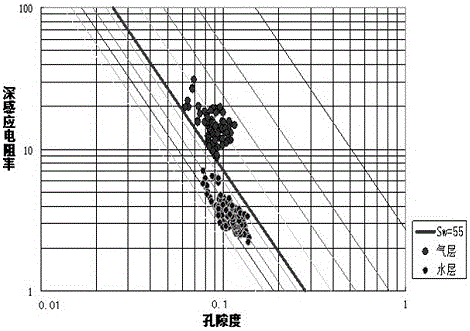
[0071] image 3 The porosity-deep induction resistivity intersection diagram of the natural gas layer and the water layer in this block, and the water saturation SW=55% of the boundary line between the gas layer and the...
PUM
 Abstract
Description
Claims
Application Information
 - R&D
- Intellectual Property
- Life Sciences
- Materials
- Tech Scout
- Unparalleled Data Quality
- Higher Quality Content
- 60% Fewer Hallucinations
Browse by: Latest US Patents, China's latest patents, Technical Efficacy Thesaurus, Application Domain, Technology Topic, Popular Technical Reports.
© 2025 PatSnap. All rights reserved.Legal|Privacy policy|Modern Slavery Act Transparency Statement|Sitemap|About US| Contact US: help@patsnap.com


