
Methods and systems for visualizing and evaluating data

A technology of data and emission data, applied in the fields of biochemical equipment and methods, data visualization, other database browsing/visualization, etc., can solve problems such as low amplification and no amplification

Active Publication Date: 2014-10-08
LIFE TECH CORP
View PDF4 Cites 2 Cited by
  • Summary
  • Abstract
  • Description
  • Claims
  • Application Information

AI Technical Summary

Problems solved by technology

Therefore, it is challenging to determine where the threshold should be set to accurately distinguish between negative and positive numbers, as each sample may have no or low amplification
In addition, it is also a challenge to e.g. determine whether a sample volume contains one copy or multiple copies

Method used

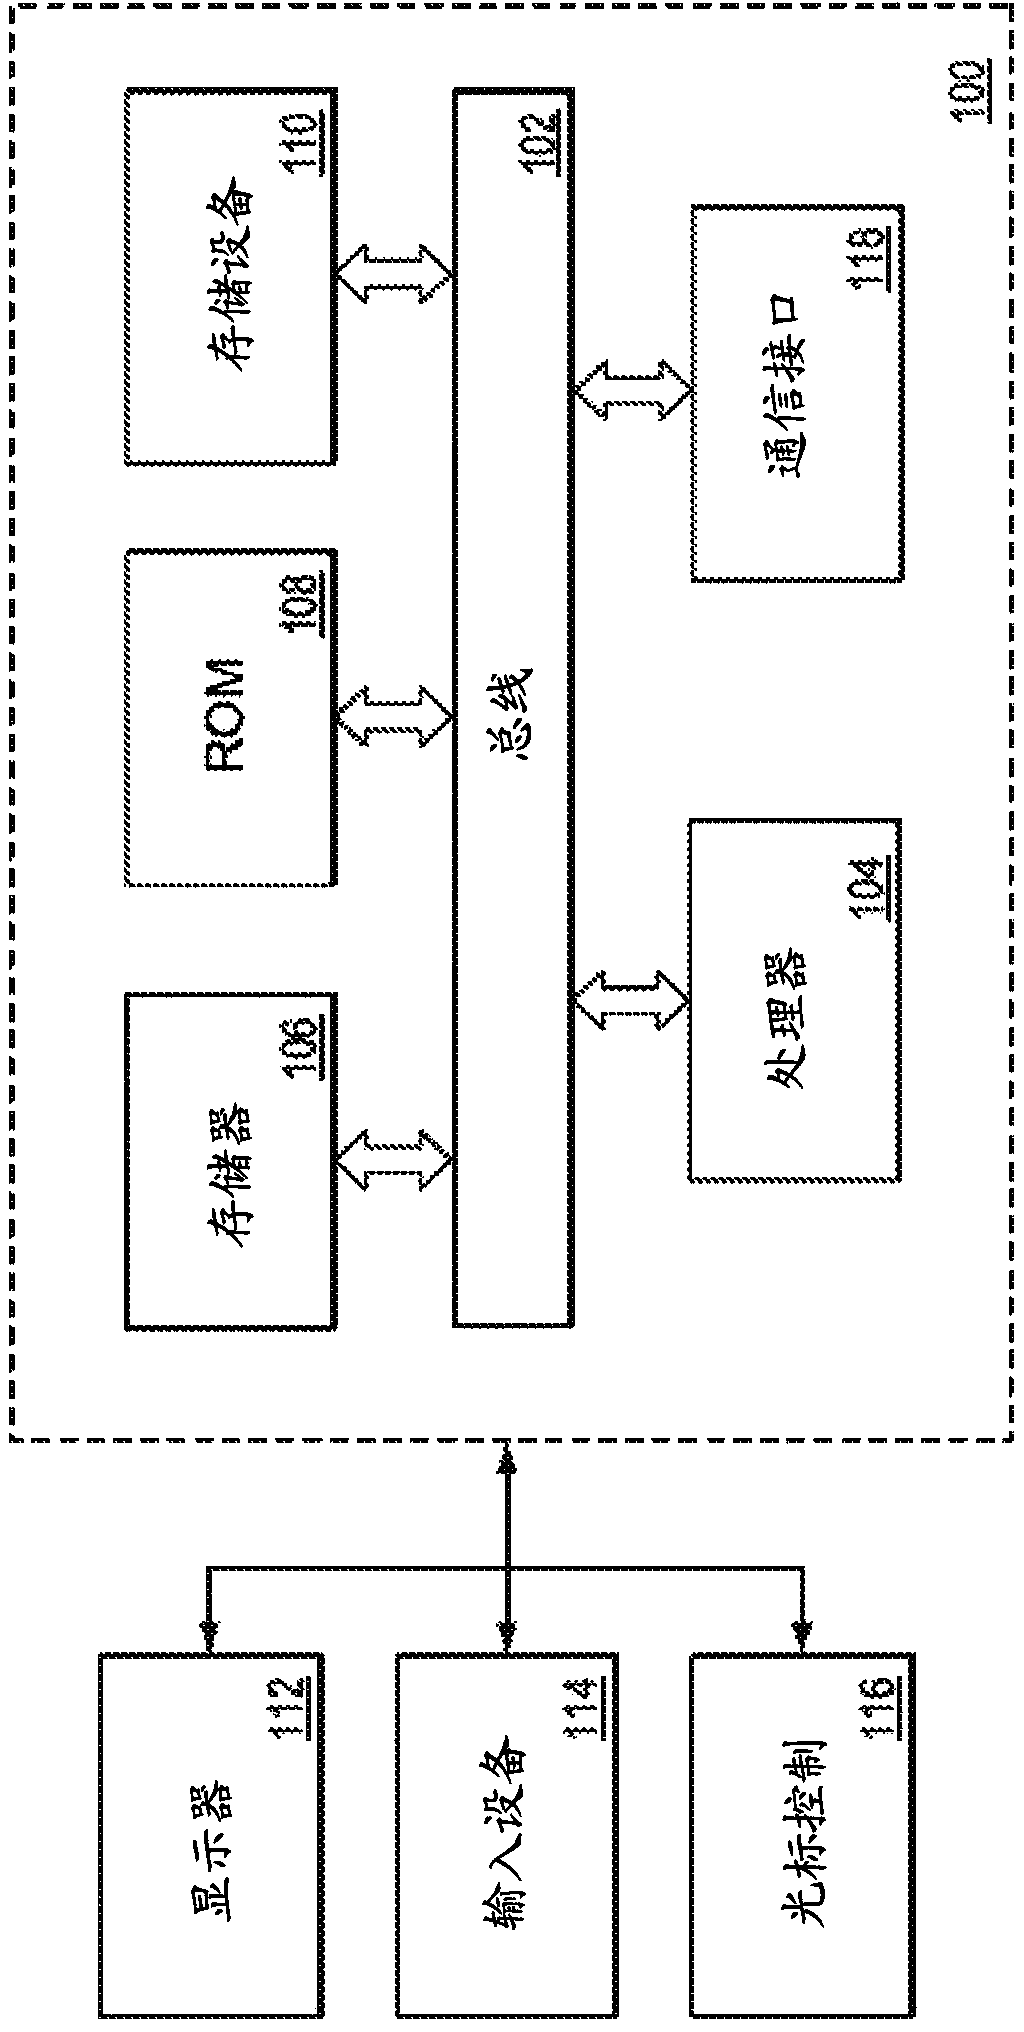
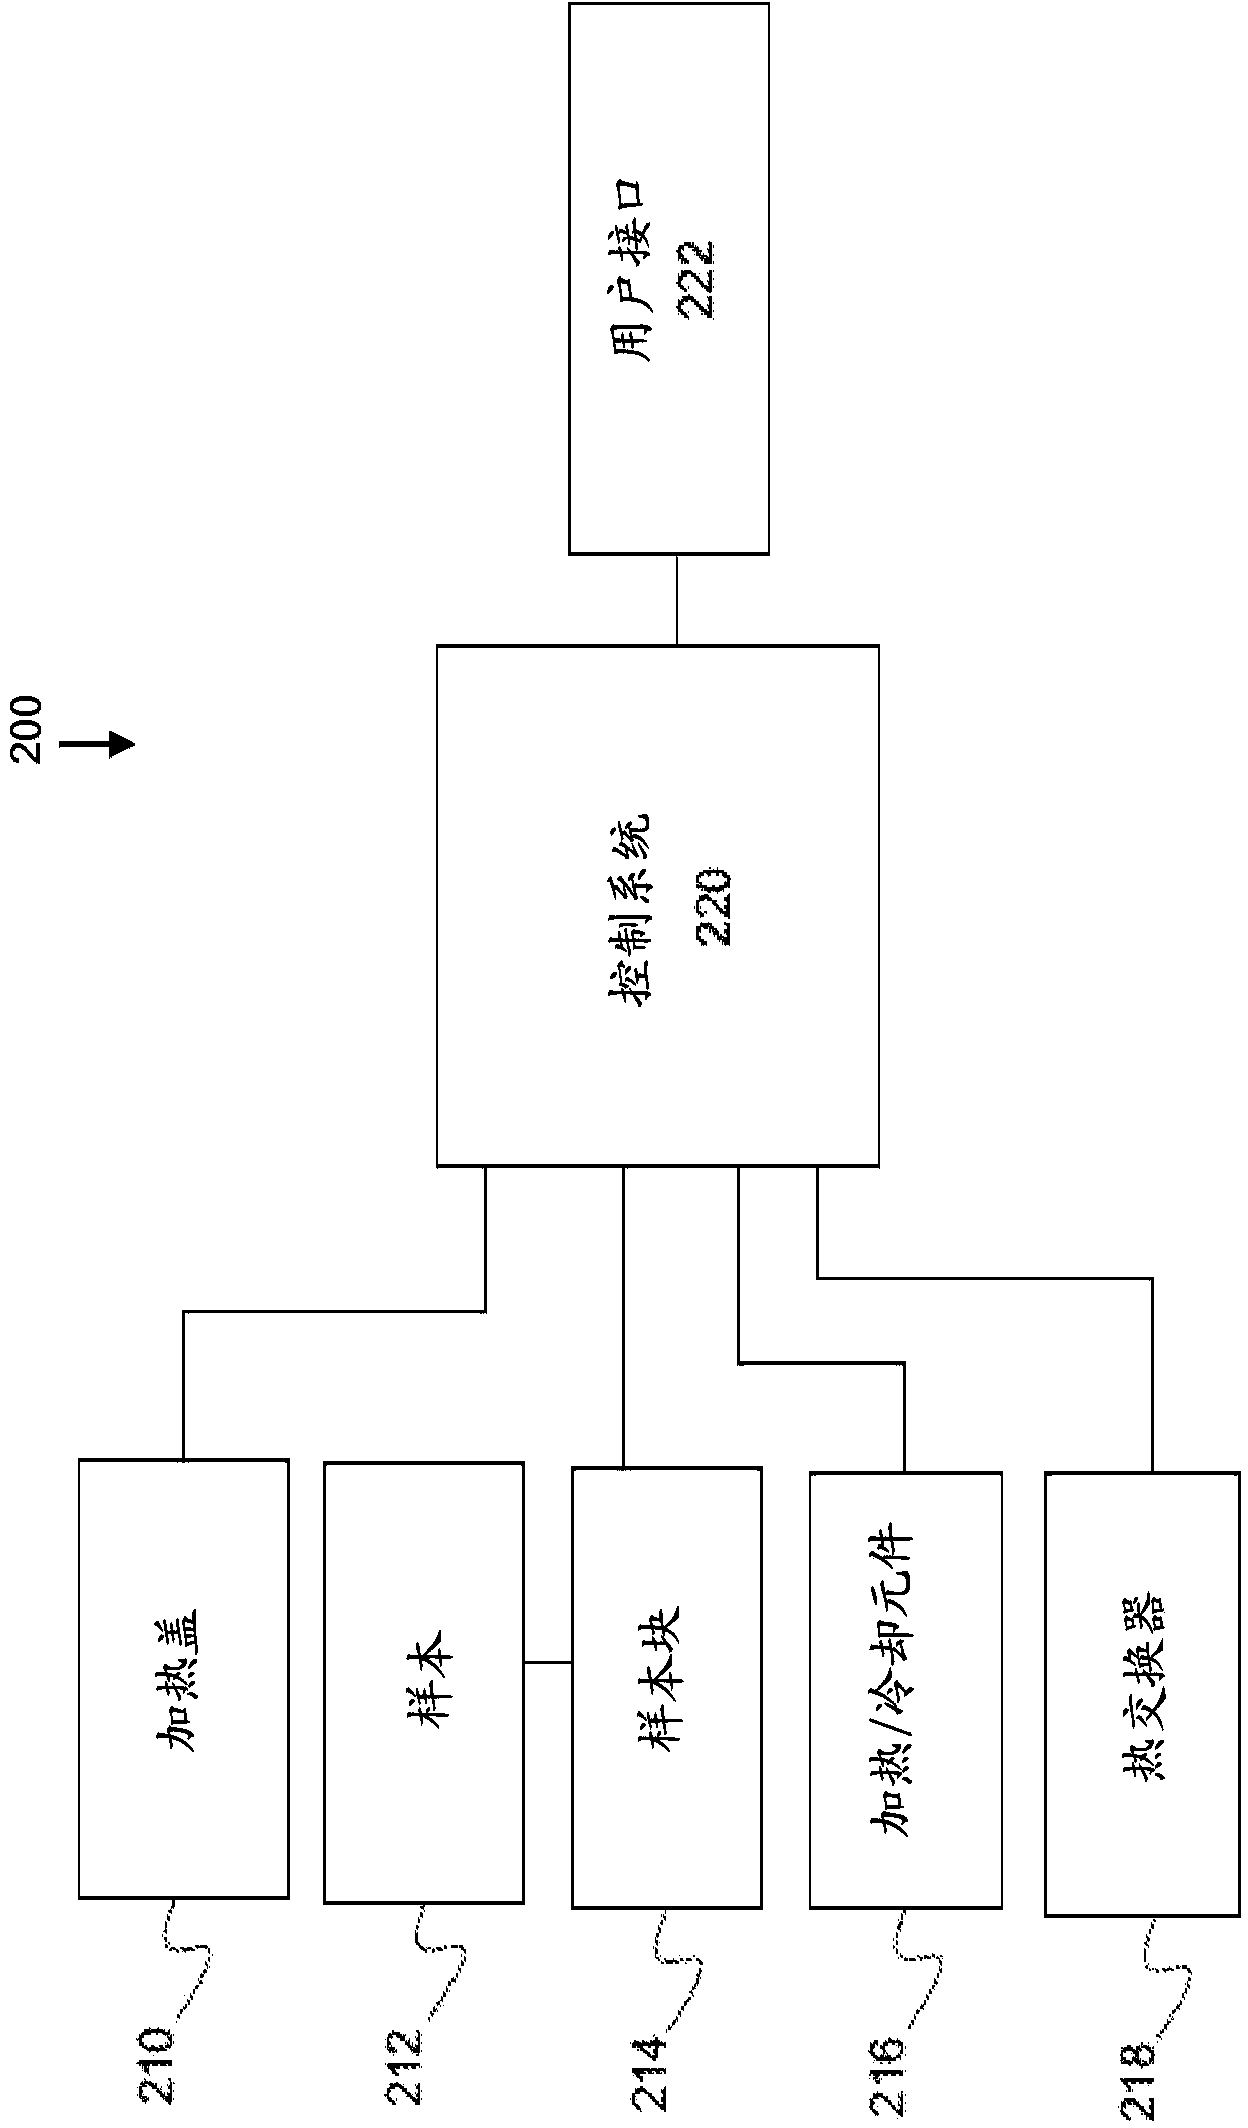
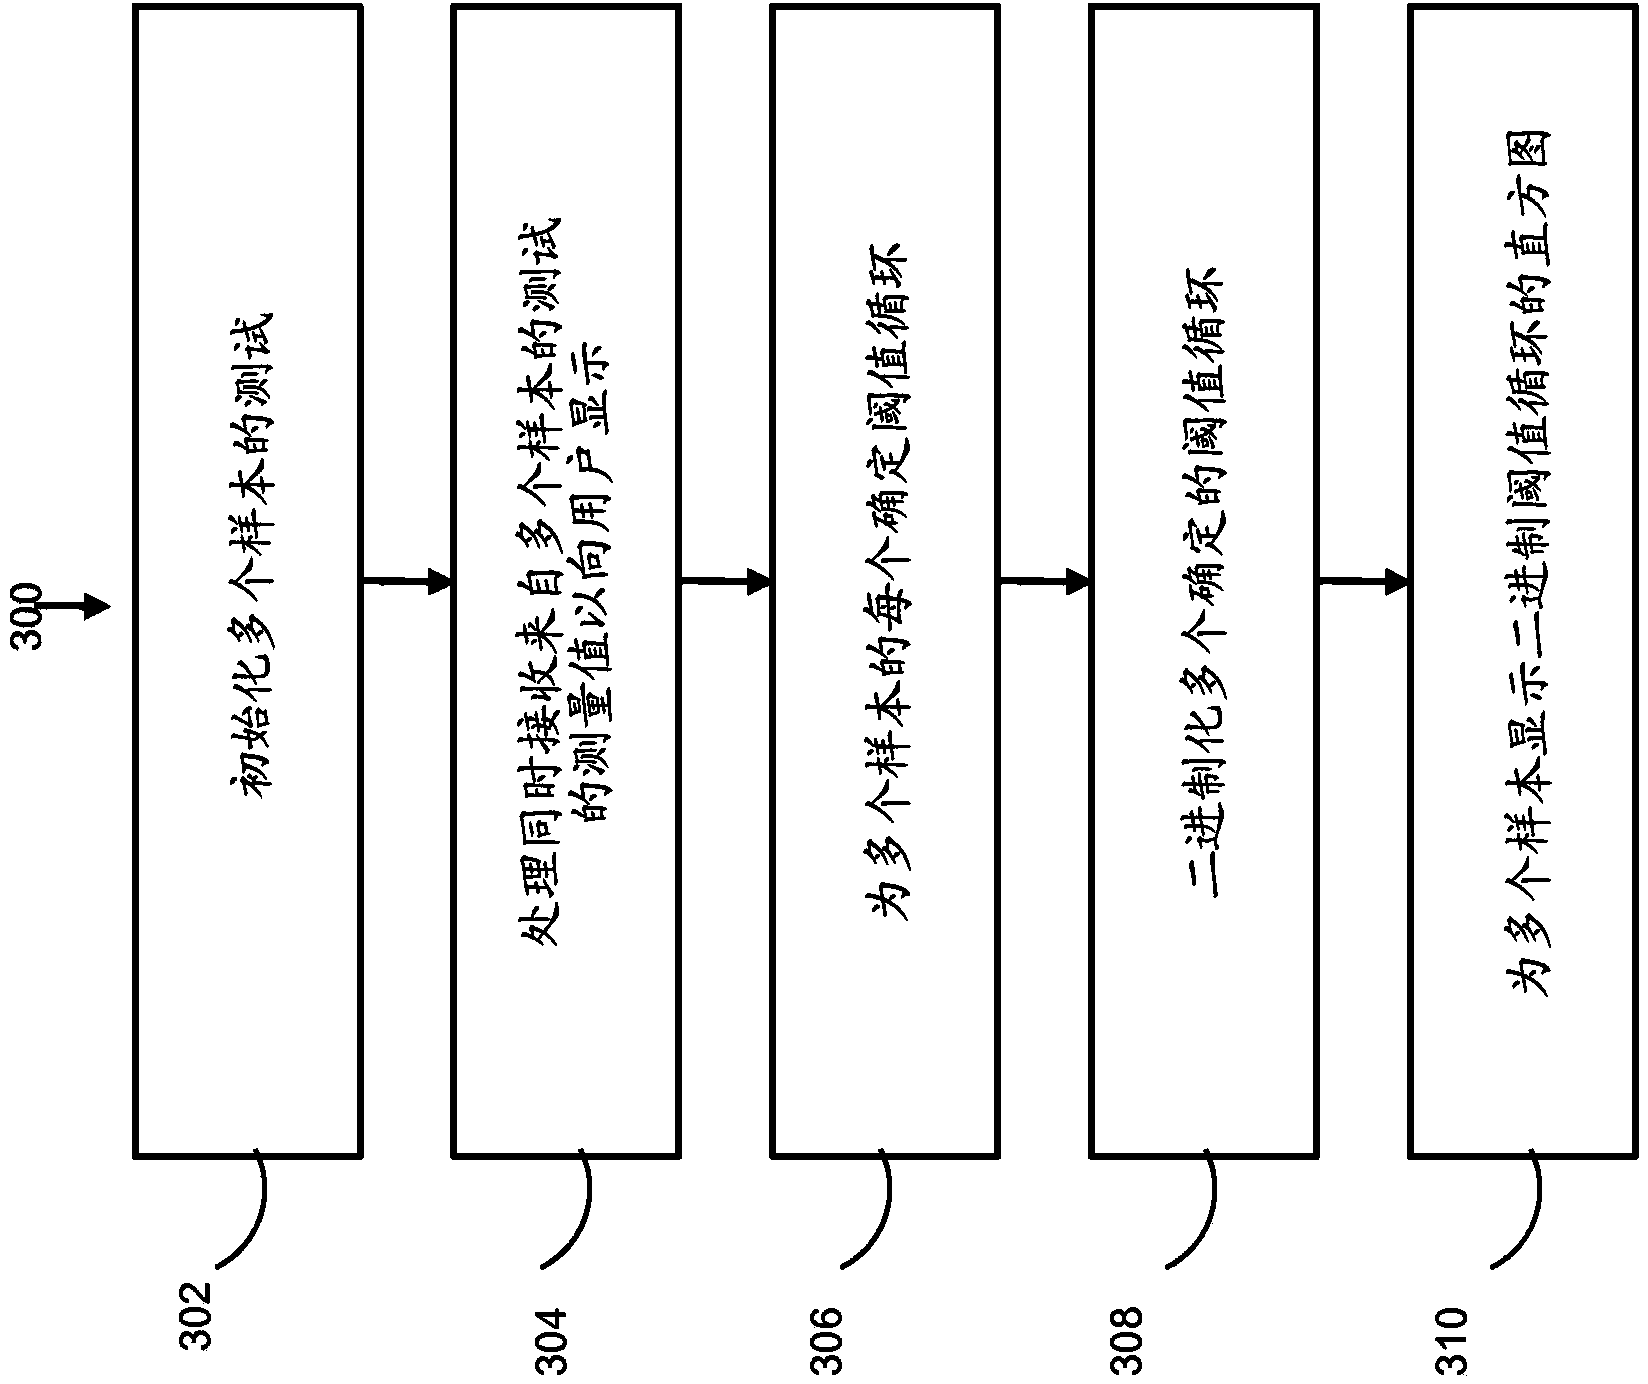

Image

  • Methods and systems for visualizing and evaluating data
  • Methods and systems for visualizing and evaluating data
  • Methods and systems for visualizing and evaluating data

Examples


Embodiment Construction

[0023] Exemplary systems of methods related to various embodiments described herein include the systems described in U.S. Provisional Patent Application No. 61 / 541,453 (Docket No. LT00578PRO), U.S. Provisional Patent Application No. 61 / 541,342 (Docket No. LT00581PRO), U.S. Provisional Patent Application No. 29 / 403,049 (Docket No. LT00582DES), U.S. Provisional Patent Application No. 61 / 541,495 (Docket No. LT00583PRO), U.S. Provisional Patent Application No. 61 / 541,366 (Docket No.: LT00584.1PRO), and U.S. Provisional Patent Application No. 61 / 541371 (Docket No. LT00594PRO), all of which were filed on September 30, 2011, and are hereby incorporated by reference in their entirety.

[0024] In order to provide a more comprehensive understanding of the present invention, a large number of specific details, such as specific configurations, parameters, examples, etc., will be described below. However, it should be realized that these descriptions are not intended to limit the scope of...


PUM


Abstract

A computer-implemented method of generating a digital polymerase chain reaction (dPCR) result is provided. The method includes detecting a first set of emission data from a plurality of samples, each included in a sample region of a plurality of sample regions, at a first time during an amplification period. The method further includes determining a positive or negative amplification determination for each sample of the plurality of samples based in part on the first set of emission data. A dPCR result is generated based on the positive or negative amplification determinations for the plurality of samples.

Description

[0001] Cross References to Related Applications [0002] This application claims the benefit of priority to U.S. Provisional Application No. 61 / 541,342, filed September 30, 2011, and U.S. Provisional Application No. 61 / 660,960, filed June 18, 2012, both of which are The contents are incorporated herein by reference. Background technique [0003] Polymerase chain reaction (PCR) instrumentation enables reliable quantification of DNA or RNA levels in biological samples. Commercially available PCR instruments and associated data acquisition and analysis software process qPCR assay data generated from biological samples. These systems pass the quantification cycle (C q C T or C RT ) values ​​are calculated as fractional PCR cycle numbers to report quantitative results. OK C q The value can be used to estimate the initial amount of DNA material. [0004] In contrast to qPCR, digital PCR (dPCR) result set typically requires analysis of thousands of PCR reactions. In general,...

Claims


Application Information

Patent Timeline
Patent Type & Authority Applications(China)
IPC IPC(8): C12Q1/68G16B40/10G16B45/00
CPCG06F19/24C12Q1/6851G06F16/904G16B20/00G16B40/10C12Q2537/165C12Q2563/159G16B40/00
Inventor 戈登·亚纳威曼朱拉·阿利米纳蒂吴若云大卫·方特斯丘沈明
Owner LIFE TECH CORP
Learn More