Method and device for detecting p-wave and t-wave in electrocardiogram signal
An electrocardiogram and signal technology, applied in the field of signal processing, can solve the problems of complex design, poor P wave detection effect, complex calculation, etc., to achieve accurate position detection and improve the detection efficiency
- Summary
- Abstract
- Description
- Claims
- Application Information
AI Technical Summary
Problems solved by technology
Method used
Image
Examples
Embodiment 1
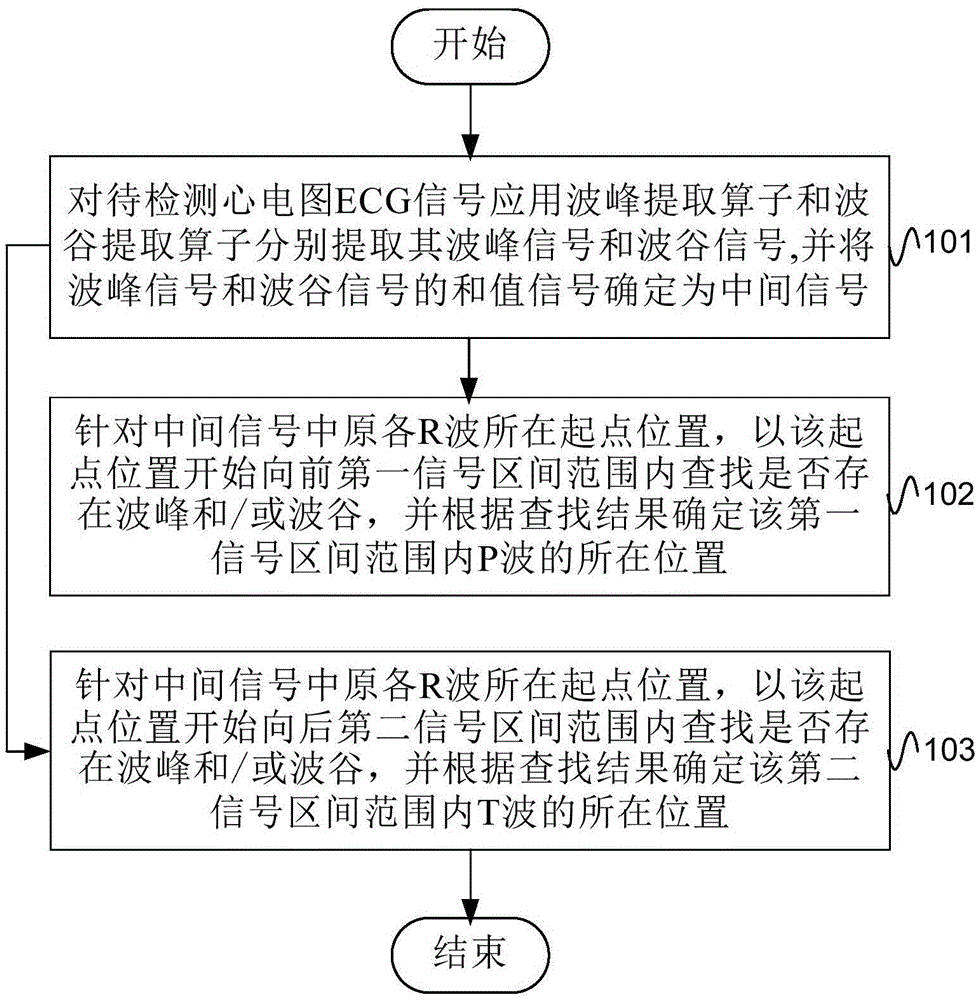
[0021] figure 1 It is a method flowchart of an embodiment of the method for detecting P waves and T waves in the electrocardiogram signal provided by the present invention, and the execution body of the method may be a detection device integrated with digital signal processing functions. Such as figure 1 As shown, the method for detecting P waves and T waves in the electrocardiogram signal specifically includes:
[0022] S101, applying a peak extraction operator and a valley extraction operator to extract the peak signal and the valley signal of the ECG signal to be detected respectively, and determining the sum signal of the peak signal and the valley signal as an intermediate signal;
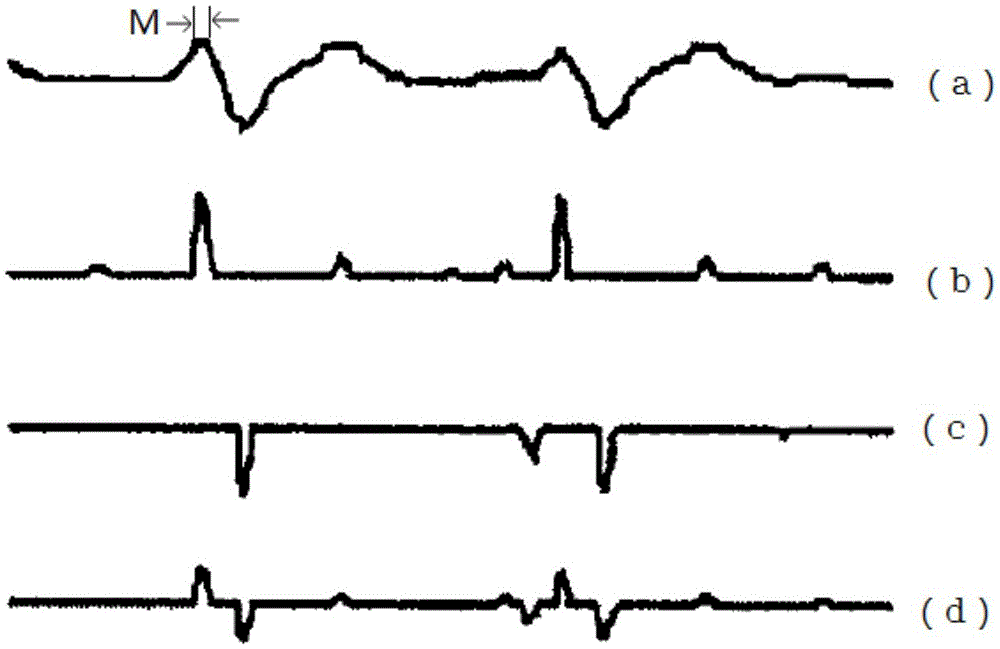
[0023] For a one-dimensional digital signal f(n) to be filtered with a signal length of N, the nth signal in (n=0,1,2,...,N-1) performs a structural element k(m) with a length of M ), the expansion operation (or corrosion operation) of (m=0,1,2,...,N-1) is: first invert the signal f(n) with ...
Embodiment 2
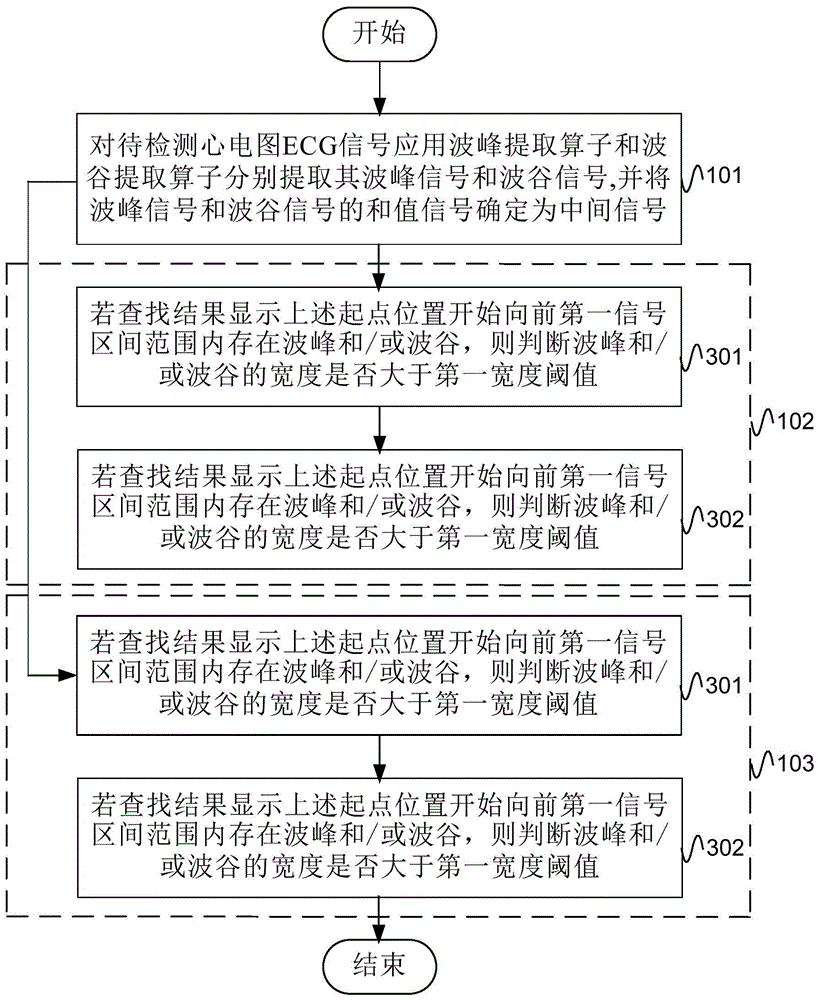
[0044] image 3 The method flowchart of another embodiment of the method for detecting P wave and T wave in the electrocardiogram signal provided by the present invention is as follows figure 1 A specific implementation of the method shown. Such as image 3 As shown, the method for detecting P wave and T wave in the electrocardiogram signal is the same as figure 1 The difference of the illustrated embodiment is that the above steps 102 and 103 are further refined. Specifically, the refinement steps for step 102 include:
[0045] S301, if the search result shows that there are peaks and / or valleys within the first signal interval from the above starting point, then determine whether the width of the peaks and / or valleys is greater than the first width threshold;
[0046] Specifically, if there are peaks and / or troughs within the specified first signal interval range, it indicates that the interval range may contain P waves. Usually, the P wave has a certain width range, an...
Embodiment 3
[0059] Figure 4 A structural schematic diagram of an embodiment of the device for detecting P waves and T waves in the electrocardiogram signal provided by the present invention, the device shown in the structural schematic diagram can perform the following steps: figure 1 The method steps of the illustrated embodiment. Such as Figure 4 As shown, the device for detecting P waves and T waves in the electrocardiogram signal specifically includes: a calculation module 41, a first processing module 42 and a second processing module 43; wherein:
[0060] Calculation module 41, is used for applying peak extraction operator and valley extraction operator to extract its peak signal and valley signal respectively for the electrocardiogram ECG signal to be detected, and the sum value signal of peak signal and valley signal is determined as intermediate signal;
[0061] The first processing module 42 is used for starting from the starting position of each R wave in the intermediate s...
PUM
 Abstract
Description
Claims
Application Information
 - R&D
- Intellectual Property
- Life Sciences
- Materials
- Tech Scout
- Unparalleled Data Quality
- Higher Quality Content
- 60% Fewer Hallucinations
Browse by: Latest US Patents, China's latest patents, Technical Efficacy Thesaurus, Application Domain, Technology Topic, Popular Technical Reports.
© 2025 PatSnap. All rights reserved.Legal|Privacy policy|Modern Slavery Act Transparency Statement|Sitemap|About US| Contact US: help@patsnap.com


