
Optimal noise coefficient testing method

A technology of noise figure and test method, applied in the direction of noise figure or signal-to-noise ratio measurement, to achieve the effect of overcoming expensive equipment, reducing test cost, and overcoming few test resources

Active Publication Date: 2015-04-29
SHANGHAI HUAHONG GRACE SEMICON MFG CORP
View PDF5 Cites 5 Cited by
  • Summary
  • Abstract
  • Description
  • Claims
  • Application Information

AI Technical Summary

Problems solved by technology

[0004] The technical problem to be solved by the present invention is to provide a test method for an optimal noise figure, which can use a 50 ohm system to test and calculate the optimum noise figure of the device through calculation, and can overcome the shortcomings of less test resources and expensive equipment, thereby being able to Reduce the cost of testing, and will not cause device oscillation, improve test efficiency

Method used

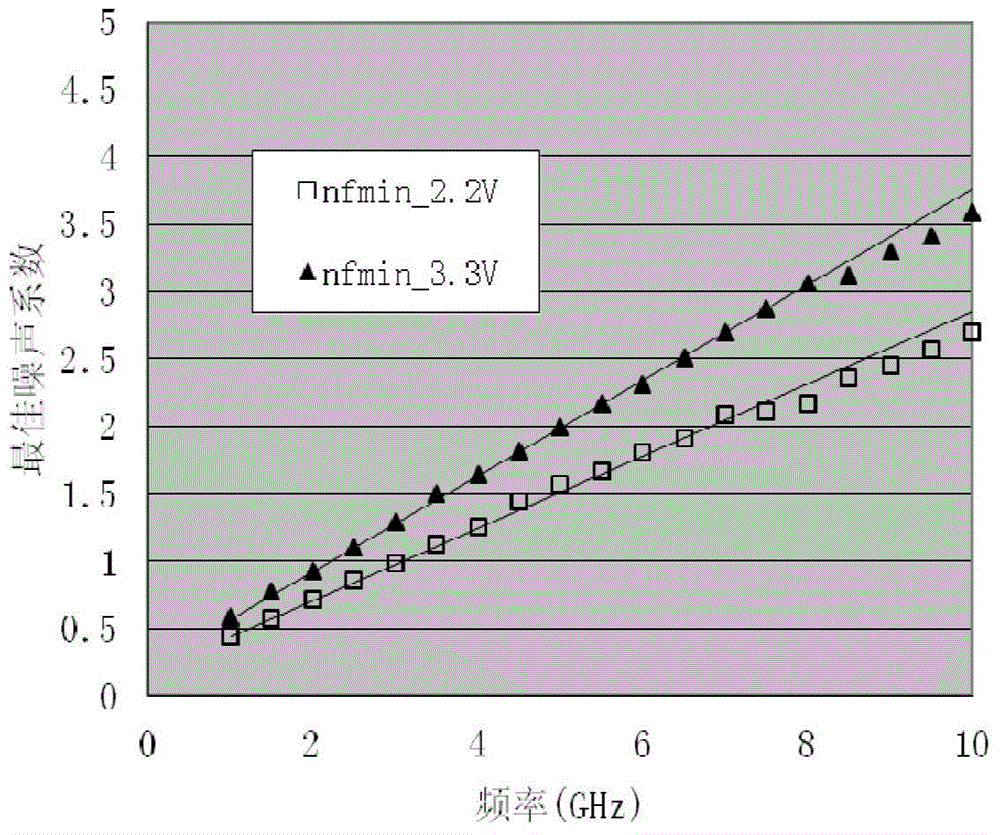
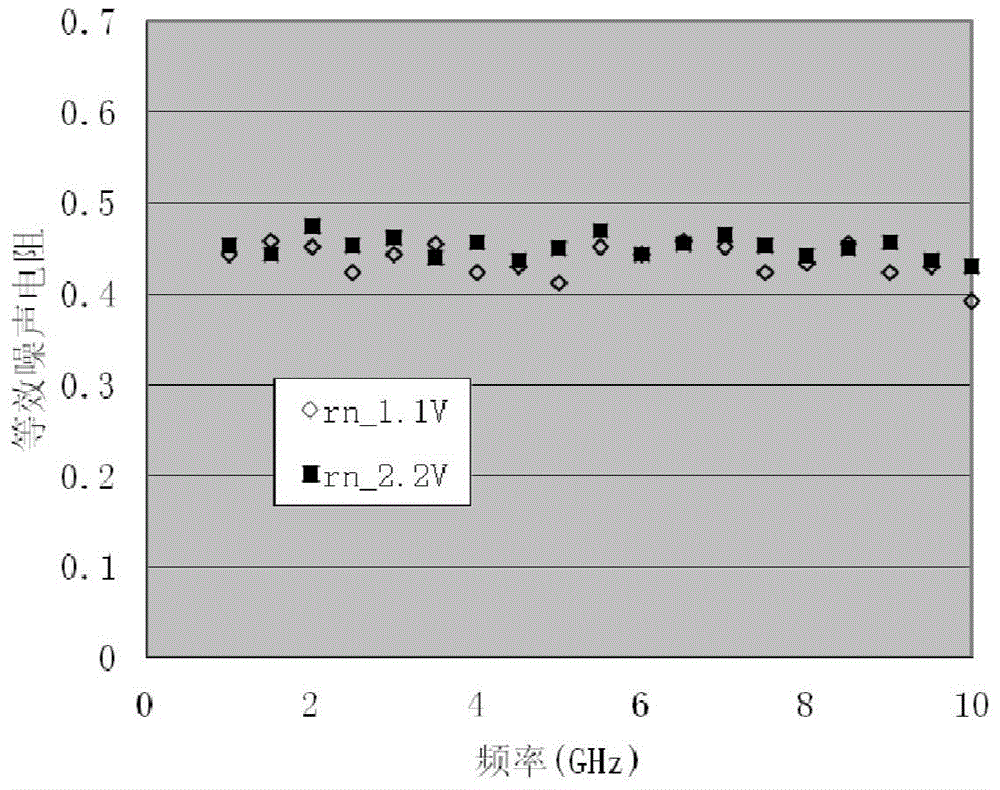
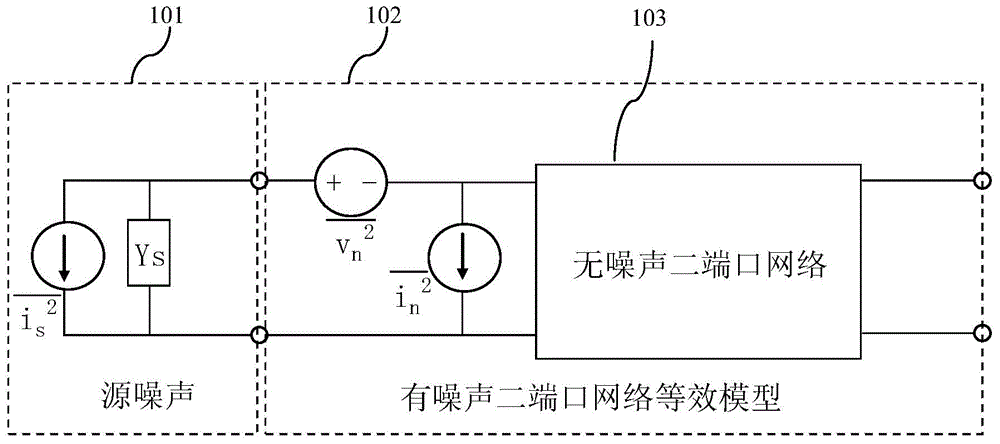

Image

  • Optimal noise coefficient testing method
  • Optimal noise coefficient testing method
  • Optimal noise coefficient testing method

Examples


Embodiment Construction

[0042] High frequency noise theoretical formula: F = F min + R n G s [ ( G s - G opt ) 2 + ( B s - B opt ) 2 ] , F stands for noise figure, F min Indicates the best noise figure, R n Indicates the equivalent noise resistance, G s is the source conductance, B s is the source susceptance, G opt Indicates the best source conductance, B opt Indicates the optimum source susceptance.

[0043] Among them, the optimal noise fi...


PUM


Abstract

The invention discloses an optimal noise coefficient testing method. The method comprises steps as follows: a test structure I, a test structure II, a test structure III, a de-embedding structure and a direct-connection structure are manufactured on a silicon slice; a 50-ohm system is used for testing a first noise coefficient of the test structure I and a second noise coefficient of the test structure II at different frequencies; the test structure III, the de-embedding structure and the direct-connection structure are tested to obtain a first scattering parameter, a de-embedding scattering parameter and a direct-connection scattering parameter; the first noise coefficient, the second noise coefficient and the first scattering parameter are de-embedded to obtain a third noise coefficient, a fourth noise coefficient and a second scattering coefficient respectively; a fifth noise coefficient is derived; first equivalent noise resistance and second equivalent noise resistance are derived; first optimal source admittance and second optimal source admittance are derived; optimal source conductivity is derived; an optimal noise coefficient is derived. According to the optimal noise coefficient testing method, the 50-ohm system is used for testing, the optimal noise coefficient of a device is derived, the defects that a few of test resources are available and equipment is expensive can be overcome, and the device cannot oscillate.

Description

technical field [0001] The invention relates to a manufacturing process method of a semiconductor integrated circuit, in particular to a method for testing an optimal noise figure. Background technique [0002] In radio frequency integrated circuits, such as low-noise amplifiers, the noise figure of the device is a very important indicator; among the four noise parameters, the most important parameter is the optimal noise figure, which has a guiding effect on the design of the circuit and the selection of the device . [0003] However, in the testing process, there are currently two main methods for testing high-frequency noise. One is to test the noise figure under 50 ohms (Ohm), which is not the best noise figure; the other is to use the tuner method and software. Test the noise parameters in the best way, including the best noise figure. At present, this method has few domestic test resources and expensive equipment. It is also easy to cause vibration and low efficiency ...

Claims


Application Information

Patent Timeline
Patent Type & Authority Applications(China)
IPC IPC(8): G01R29/26
Inventor 黄景丰
Owner SHANGHAI HUAHONG GRACE SEMICON MFG CORP
Learn More