Best Noise Figure Test Method
A technology of noise figure and test method, which is applied in the measurement of noise figure or signal-to-noise ratio, etc., to achieve the effect of overcoming the lack of test resources, reducing test cost and improving test efficiency
- Summary
- Abstract
- Description
- Claims
- Application Information
AI Technical Summary
Problems solved by technology
Method used
Image
Examples
Embodiment Construction
[0042] High frequency noise theoretical formula: F stands for noise figure, F min Indicates the best noise figure, R n Indicates the equivalent noise resistance, G s is the source conductance, B s is the source susceptance, G opt Indicates the best source conductance, B opt Indicates the optimum source susceptance.
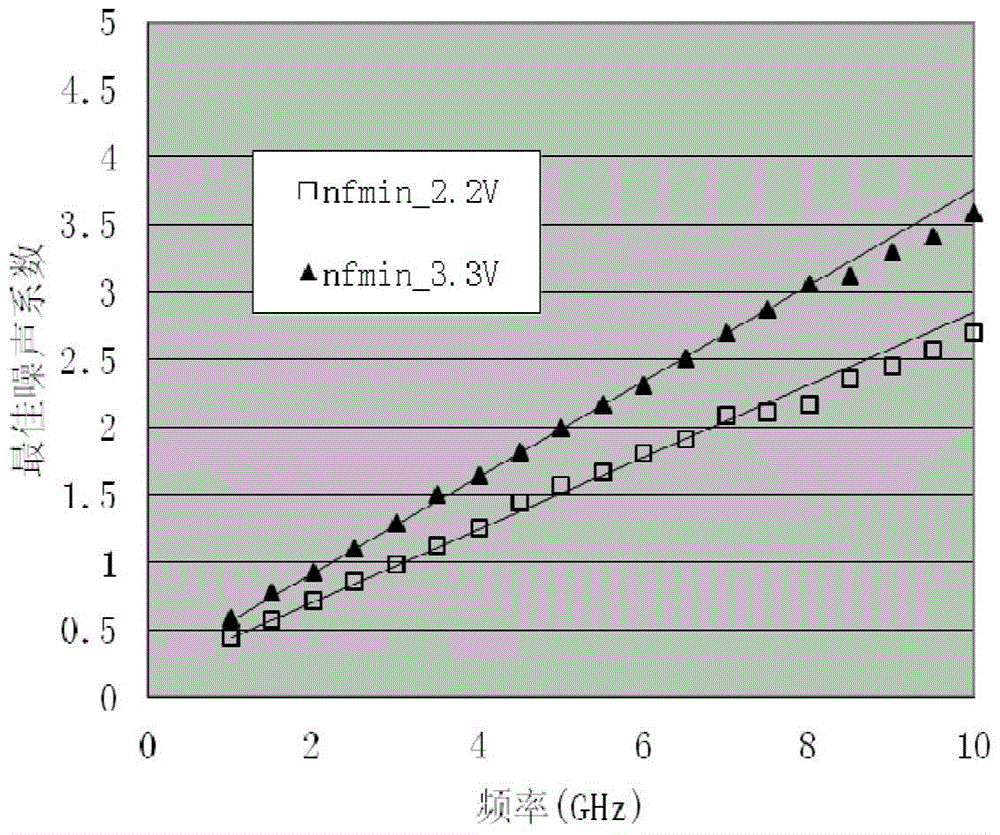
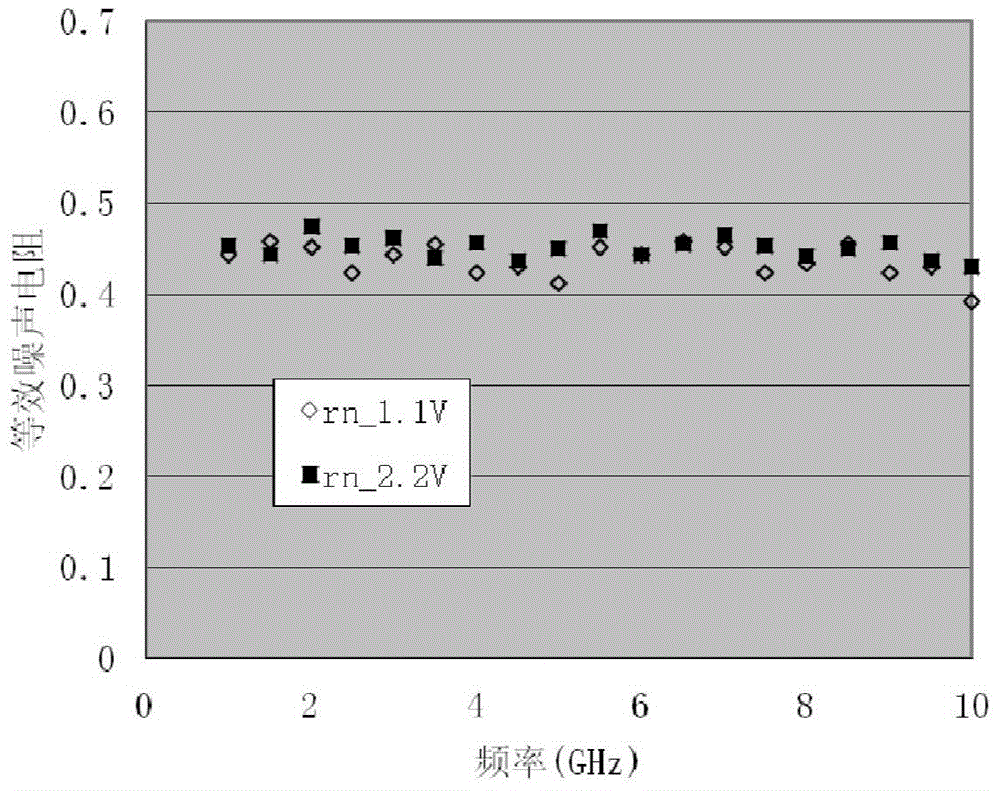
[0043] Among them, the optimal noise figure has a linear relationship with frequency, the optimal source susceptance has a proportional relationship with frequency, and the equivalent noise resistance and optimal source susceptance do not vary with frequency. Such as Figure 1A Shown is the relationship between the optimal noise figure and frequency, Figure 1A Shows two relationship curves with test voltages of 2.2V and 3.3V respectively; Figure 1B Shown is the relationship between the equivalent noise resistance and frequency, Figure 1B Two relationship curves for test voltages of 1.1V and 2.2V are shown in .
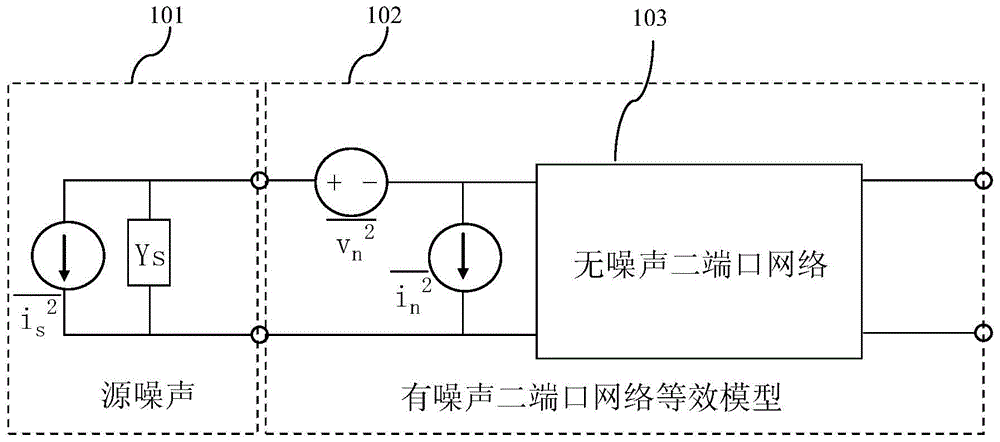
[0044] Such as figure 2 As shown, the ...
PUM
 Abstract
Description
Claims
Application Information
 - R&D
- Intellectual Property
- Life Sciences
- Materials
- Tech Scout
- Unparalleled Data Quality
- Higher Quality Content
- 60% Fewer Hallucinations
Browse by: Latest US Patents, China's latest patents, Technical Efficacy Thesaurus, Application Domain, Technology Topic, Popular Technical Reports.
© 2025 PatSnap. All rights reserved.Legal|Privacy policy|Modern Slavery Act Transparency Statement|Sitemap|About US| Contact US: help@patsnap.com


