
Three-dimensional visualization method for engineering structure disease information

A technology of engineering structures and diseases, applied in image data processing, 3D modeling, instruments, etc., can solve the problems of low utilization efficiency of engineering structure disease information, heavy thinking burden of users, etc., and achieve the effect of improving information utilization efficiency

Inactive Publication Date: 2015-07-08
JIANGSU PROVINCIAL COMM PLANNING & DESIGN INST
View PDF3 Cites 8 Cited by
  • Summary
  • Abstract
  • Description
  • Claims
  • Application Information

AI Technical Summary

Problems solved by technology

[0004] The purpose of the present invention is to provide a three-dimensional visualization method for displaying engineering structure disease information in view of the defects of low utilization efficiency and heavy thinking burden of existing engineering structure disease information, which can effectively improve engineering structure disease information. Utilization efficiency, providing more convenient means of information display

Method used


Image

  • Three-dimensional visualization method for engineering structure disease information
  • Three-dimensional visualization method for engineering structure disease information
  • Three-dimensional visualization method for engineering structure disease information

Examples


Embodiment

[0061] Existing engineering structures such as image 3 As shown, there are two diseases BH1 and BH2, and the information on the location of the diseases can be found in image 3 , and the attribute information of the disease itself is "1 severe steel bar corrosion" and "horizontal crack, length 0.2m, width 0.15mm".

[0062] In order to display the disease in 3D, a 3D model is established according to the drawing information of the structure, and placed in the 3D scene coordinate system, such as Figure 4 shown.

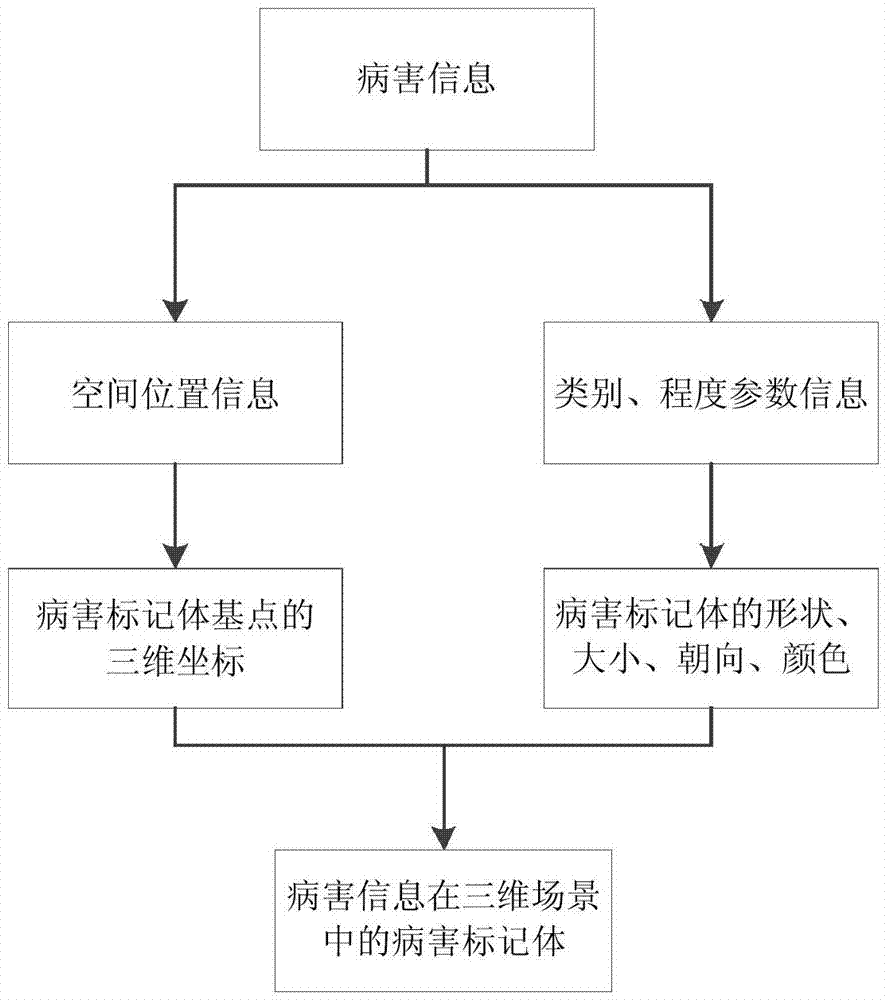
[0063] In this example, BH1 and BH2 are discretized as: {"Disease Type": "Reinforcement Corrosion", "Severity": "Severe"} and {"Disease Type": "Horizontal Crack", "Length": "0.2m", "width": "0.15mm"}. In order to distinguish between these two diseases, only their type attributes, namely "corrosion of steel bars" and "horizontal cracks" are used in this example. In this example, the shape category attribute of the disease marker is used to associate with the type ...


PUM


Abstract

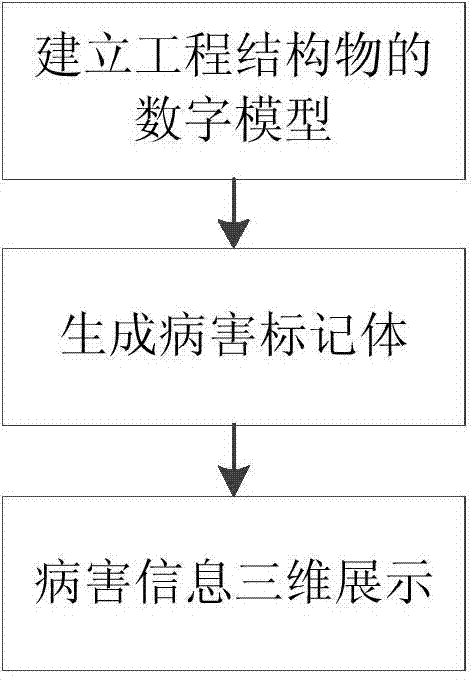
The invention relates to a three-dimensional visualization method, in particular to a three-dimensional visualization method for engineering structure disease information. The three-dimensional visualization method includes the following steps: 1, building a three-dimensional model of an engineering structure according to drawing information, and placing and fixing the three-dimensional model into a three-dimensional scene coordinate system; 2, extracting attribute information and position information from the disease information, and then determining disease marking bodies in a three-dimensional scene according to the following steps: 2a, determining the appearance attributes of the disease marking bodies according to the disease attribute information, and assigning base points of the disease marking bodies; 2b, determining three-dimensional coordinates of the base points of the disease marking bodies in the three-dimensional scene according to the disease position information; 3, adding the disease marking bodies into the three-dimensional scene one by one, and displaying the three-dimensional space.

Description

technical field [0001] The invention belongs to the technical field of engineering structure survey computer-related applications, and relates to a method for displaying engineering structure survey information, in particular to a three-dimensional visualization method for engineering structure disease information. Background technique [0002] With the end of the large-scale construction period in my country's cities, transportation and other fields, the identification and evaluation of engineering structures such as houses, bridges and culverts are increasing. Buildings, bridges, culverts and other engineering structures need to investigate the condition of the structure itself and record the occurrence of diseases in the process of safety and usability identification or evaluation. Relevant national standards (such as "Civil Building Reliability Appraisal Standard", "Industrial Building Reliability Appraisal Standard", "Highway Bridge Culvert Maintenance Specification" an...

Claims


Application Information

Patent Timeline
Patent Type & Authority Applications(China)
IPC IPC(8): G06T17/00
Inventor 李成涛章世祥
Owner JIANGSU PROVINCIAL COMM PLANNING & DESIGN INST
Learn More