Supercharge Your Innovation With Domain-Expert AI Agents!

A Screen Display Method of Image Logging Data

A technology for screen display and logging data, applied in the direction of digital output to display equipment, buildings, etc., can solve the problems of slow graphics refresh speed, slow display speed, large graphics amplitude, etc., to reduce the number of data reading and drawing. , the effect of improving the drawing speed

Active Publication Date: 2018-03-13
CHINA PETROLEUM & CHEM CORP +1
View PDF3 Cites 0 Cited by
  • Summary
  • Abstract
  • Description
  • Claims
  • Application Information

AI Technical Summary

Problems solved by technology

[0003] However, the amount of data involved in the drawing process of acoustoelectric imaging images is very large, and the range of the drawn graphics is also large.
The drawn well logging diagrams are usually drawn on the screen or printed out after a large number of numerical calculations, proportional calculations, coordinate transformations and coordinate mappings, and the graphics refresh speed is usually too slow
Especially for imaging logging with high sampling density and large depth scale, more image information needs to be displayed for the same depth segment, and the display speed is very slow

Method used


Image

  • A Screen Display Method of Image Logging Data
  • A Screen Display Method of Image Logging Data
  • A Screen Display Method of Image Logging Data

Examples


Embodiment 1

[0041] Combine now figure 1 The flow chart shown in this embodiment describes in detail the method for displaying the imaging logging data on the screen.

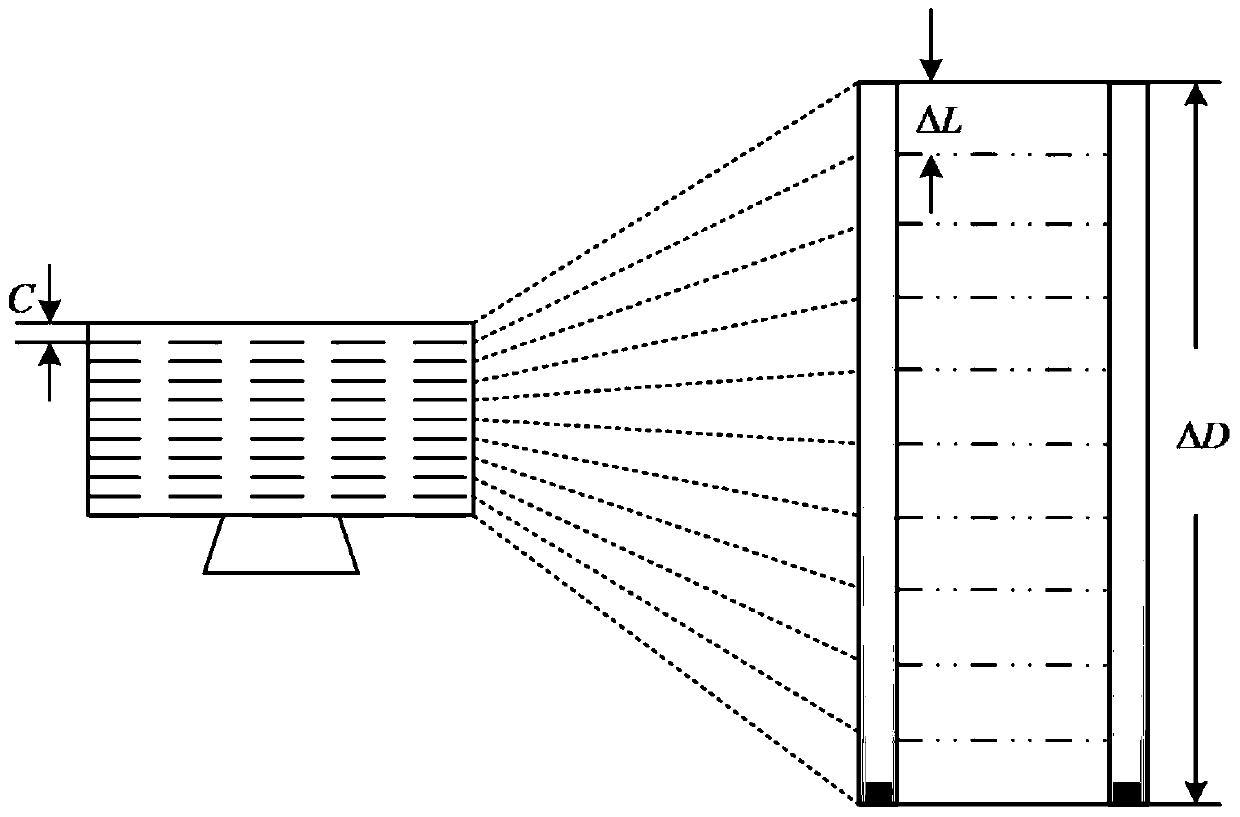
[0042] In step S101, according to the display resolution of the screen and the drawing scale, calculate the logging control volume segment to be displayed in the effective drawing height interval of the screen, and the logging control volume interval corresponding to the vertical point distance of the screen; preferably, in this embodiment The logging control interval represents the depth interval, and the logging control interval represents the depth interval.

[0043] The display resolution of the screen and the effective drawing height range of the screen can be obtained through the device context DC (DeviceContext), determined by the display device hardware parameters.

[0044] The drawing scale is preset by the user. In the image display process, the display scale of the entire logging image can be changed by control...

Embodiment 2

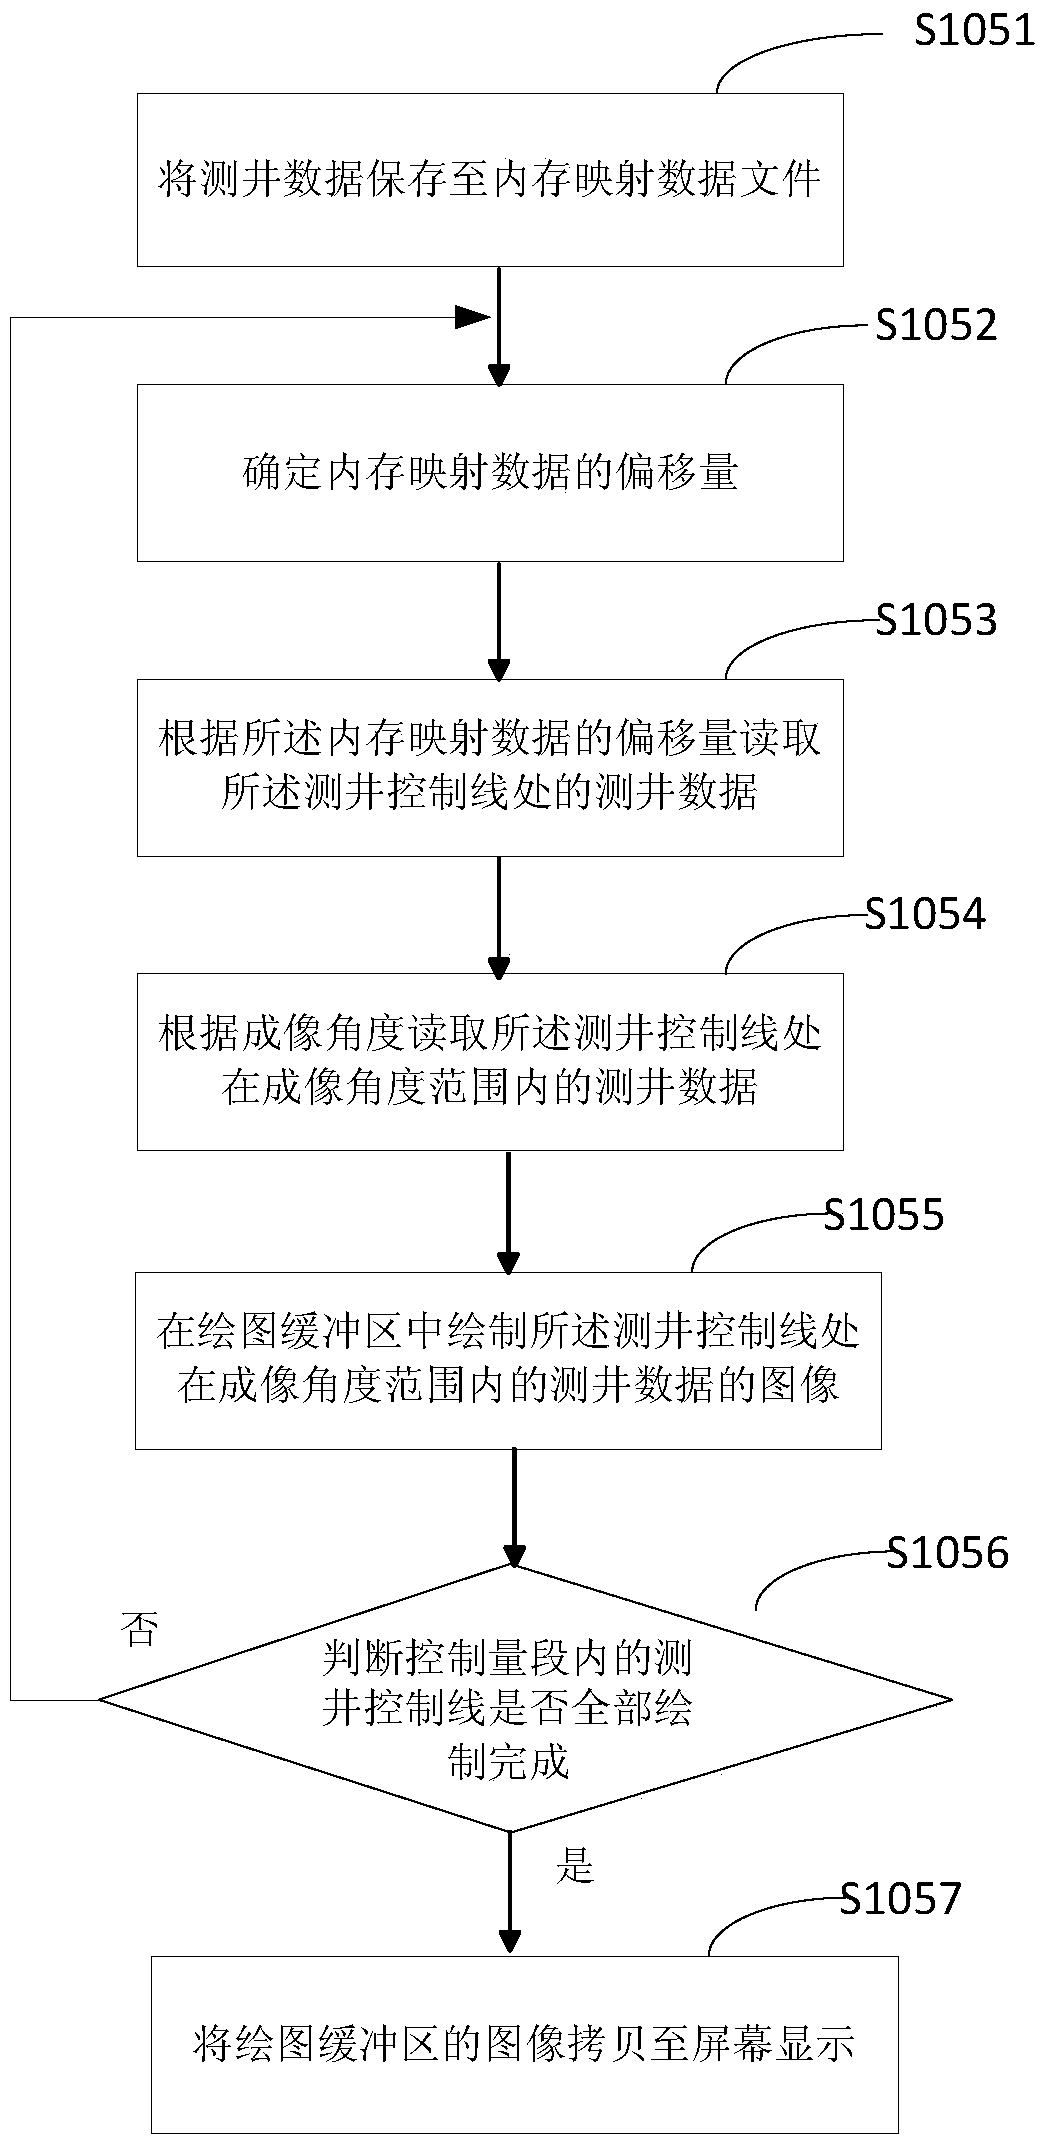
[0066] This embodiment provides a method for displaying imaging logging data on the screen. The difference from Embodiment 1 is that when an event occurs that scrolls the screen image, the method provided by this embodiment can draw the image to be displayed in the memory. A screen of images is then printed to the screen, thereby realizing continuous scrolling display of logging images.

[0067] Combine the following Figure 4 The flow of the method provided in Example 2 will be described in detail.

[0068] In step S401, according to the display resolution of the screen and the drawing scale, the logging control volume segment to be displayed in the effective drawing height interval of the screen and the corresponding logging control volume interval corresponding to the vertical point distance of the screen are calculated.

[0069] In step S402, a well logging control line to be displayed is set around the well wall according to the well logging control volume section and th...


PUM


Abstract

The invention discloses a screen display method of imaging logging data. According to the display resolution and the drawing scale of the screen, the logging control section to be displayed in the effective drawing height interval of the screen is calculated, and the logging control corresponding to the vertical point distance of the screen is calculated. setting the logging control line to be displayed around the borehole wall according to the logging control interval and the logging control interval; setting the number of lateral sampling points according to the imaging angle; establishing a drawing buffer in the memory, the drawing buffer The height of the area is the number of logging control lines to be displayed, and the width of the drawing buffer is the number of horizontal sampling points; the image of the logging data at the logging control line is drawn in the drawing buffer, and the drawing buffer is The image of the area is copied to the screen display. The method can reduce the number of times of reading and drawing of logging data, and improve the drawing speed of well logging images.

Description

technical field [0001] The invention relates to the technical field of well logging image display, in particular to a screen display method for imaging well logging data. Background technique [0002] Imaging logging technology uses a sensor array to scan and measure downhole, collects a large amount of bottom layer information along the borehole longitudinal, circumferential or radial direction to obtain logging data, and obtains a two-dimensional image of the borehole wall through image processing technology after being transmitted to the uphole. The traditional well logging data display adopts the depth-by-depth point drawing technology, that is, the data is read point by point according to the depth record sequence, and then drawn on the screen by depth point to display the well logging image. This technique is feasible for situations with low sampling density and small data volume, such as conventional well logs. [0003] However, a large amount of data is involved in ...

Claims


Application Information

Patent Timeline
Patent Type & Authority Patents(China)
IPC IPC(8): G06F3/14E21B47/002
Inventor 王卫谢关宝陆黄生廖东良承达瑜吴非
Owner CHINA PETROLEUM & CHEM CORP
Features
  • R&D
  • Intellectual Property
  • Life Sciences
  • Materials
  • Tech Scout
  • Unparalleled Data Quality
  • Higher Quality Content
  • 60% Fewer Hallucinations
Learn More