
Monitoring data display method and monitoring equipment

A technology of monitoring equipment and data display, which is applied in the field of monitoring data display methods and monitoring equipment, can solve the problems of slow display status data, error-prone, heavy workload, etc., and achieve strong usability and practicability, less error-prone, Achieve the effect of simple process

Active Publication Date: 2015-11-11
EDAN INSTR
View PDF4 Cites 18 Cited by
  • Summary
  • Abstract
  • Description
  • Claims
  • Application Information

AI Technical Summary

Problems solved by technology

[0004] In view of this, the present invention provides a monitoring data display method and monitoring equipment to solve the problems of slow display status data, heavy workload, and error-prone problems in the prior art

Method used


Image

  • Monitoring data display method and monitoring equipment
  • Monitoring data display method and monitoring equipment
  • Monitoring data display method and monitoring equipment

Examples


example 1

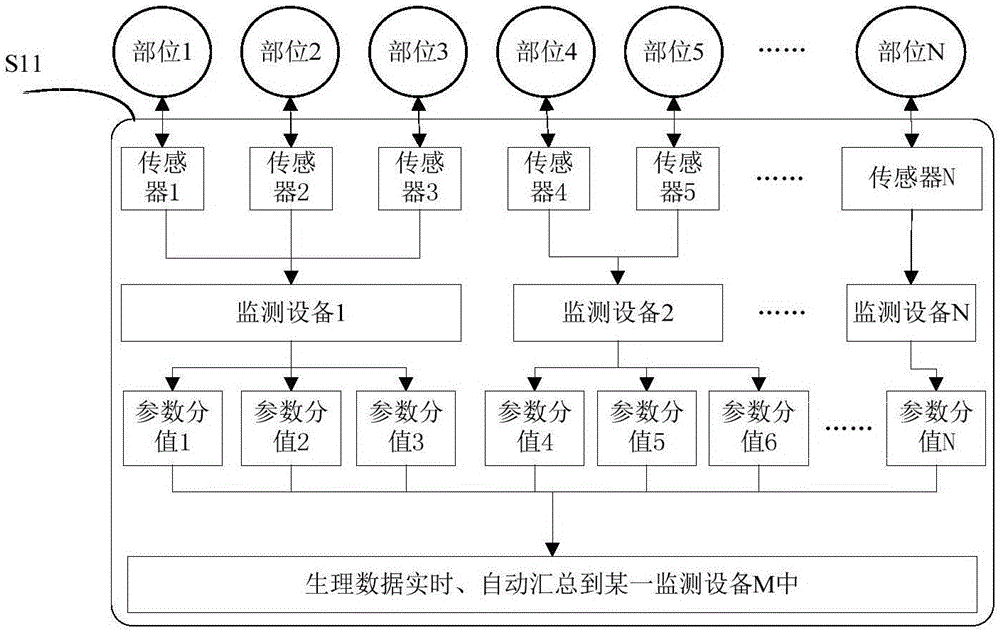
[0056]Example 1: Use a multi-parameter monitor to collect the monitoring data of an acquisition object, such as: heart rate (HR), respiration rate (RESP), blood oxygen saturation (SPO2), pulse rate (PR), rectal temperature, consciousness State (AVPU, response to external stimuli), systolic blood pressure (SYS), etc.

example 2

[0057] Example 2: Use a blood gas biochemical analyzer to collect monitoring data of a patient, such as: arterial blood pH value, average partial pressure of oxygen (PaO2), bicarbonate (HCO3), serum sodium (Na+), serum potassium (K+ ), serum creatinine (Cr), etc.

example 3

[0058] Example 3: Through network data sharing, a vital sign monitor and a hematology analyzer are used to collect monitoring data of a patient: body temperature (TEMP), mean arterial pressure (MAP), leukocrit (HCT), white blood cell count Wait. The above-mentioned monitoring equipment is not limited to the above-mentioned ones.

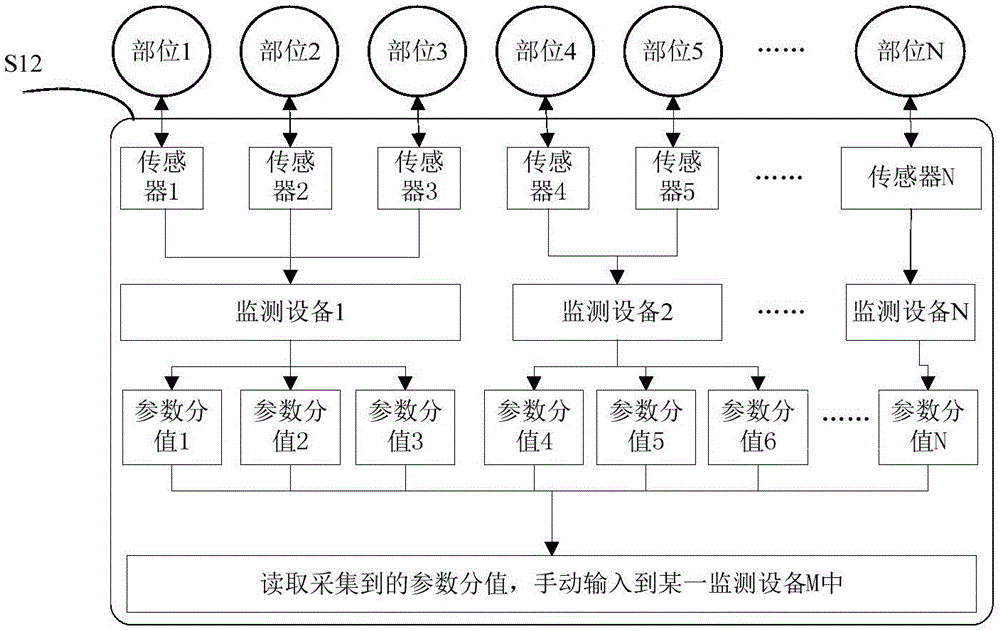
[0059] Step S12, such as image 3 As shown, step S1 can also be implemented by manual input, and the specific steps are: read monitoring parameter values ​​collected by one or more monitoring devices, and manually input them into a certain monitoring device. When the manual parameter input device is selected, the automatic acquisition mode is locked, and the manual parameter input mode is executed from step S1.

[0060] When it is detected that the monitoring parameter value entered manually exceeds the normal threshold range of the parameter, or exceeds the preset safety range, a prompt or alarm message can be sent. The mode of prompting or warni...


PUM


Abstract

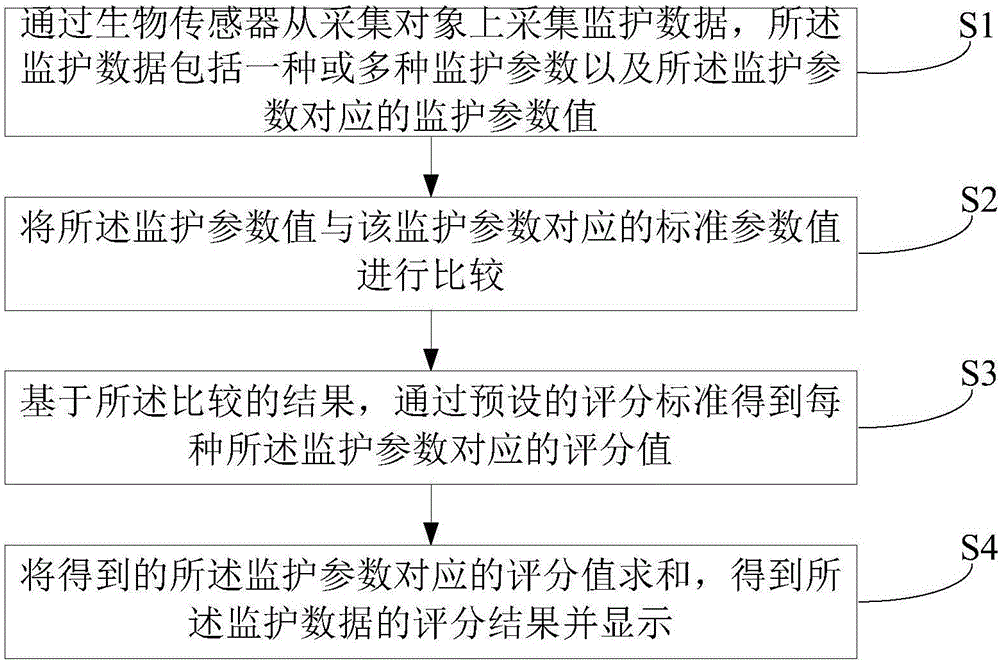
The invention provides a monitoring data display method. The method comprises following steps: collecting monitoring data from collection objects through biosensors, wherein the monitoring data includes one or more monitoring parameters and monitoring parameter values corresponding to the monitoring parameters; comparing the monitoring parameter values and standard parameter values corresponding to the monitoring parameters; acquiring score values of the corresponding monitoring parameters according to a preset scoring standard based on comparison results; and calculating the sum of the score values of the corresponding monitoring parameters so as to obtain and display a score result of the monitoring data. According to the invention, the score result can be rapidly displayed, a worker can conveniently, easily and efficiently check the result, and the accuracy of the result is high.

Description

technical field [0001] The invention belongs to the field of medical equipment, in particular to a monitoring data display method and monitoring equipment. Background technique [0002] In medical institutions, in order to enable users to know the patient's status information in a timely manner, it is usually necessary to display the patient's data, so as to facilitate medical staff to check the patient's physical status in a timely manner, and provide help for users to take timely countermeasures . [0003] In the current clinical treatment, users often manually score the collected data according to the collected data, based on the user's own experience or common sense of medical care, which makes the speed of displaying status data slow, heavy workload, and error-prone. Contents of the invention [0004] In view of this, the present invention provides a monitor data display method and monitor equipment to solve the problems of slow display status data, heavy workload an...

Claims


Application Information

Patent Timeline
IPC IPC(8): A61B5/00A61B19/00
Inventor 金琳琳胡欢孙铄潘能冲
Owner EDAN INSTR
Learn More