Method for visually displaying data source information by dragging on basis of browser

A technology for displaying data and browsers, applied in other database browsing/visualization, electronic digital data processing, and other database retrieval, etc., can solve problems such as high threshold, incompatibility with mainstream browsers, complex data analysis, etc., and achieve low entry threshold , Reduce reading and thinking time, simple and fast operation

Inactive Publication Date: 2016-02-17
SUZHOU GUOYUN DATA GOD TECH CO LTD
View PDF2 Cites 9 Cited by
  • Summary
  • Abstract
  • Description
  • Claims
  • Application Information

AI Technical Summary

Problems solved by technology

[0002] The current data analysis tools on the market have the following defects: (1) only a small number of people who understand technology can use them; (2) they are installed locally and cannot be compatible with mainstream browsers; (3) need to write complex SQL statements, the threshold High; (4) Data analysis is complex and requires understanding of data structures and databases

Method used


Image

  • Method for visually displaying data source information by dragging on basis of browser

Examples


Embodiment Construction

[0020] The present invention will be further described in detail below in conjunction with the accompanying drawings, so that those skilled in the art can implement it with reference to the description.

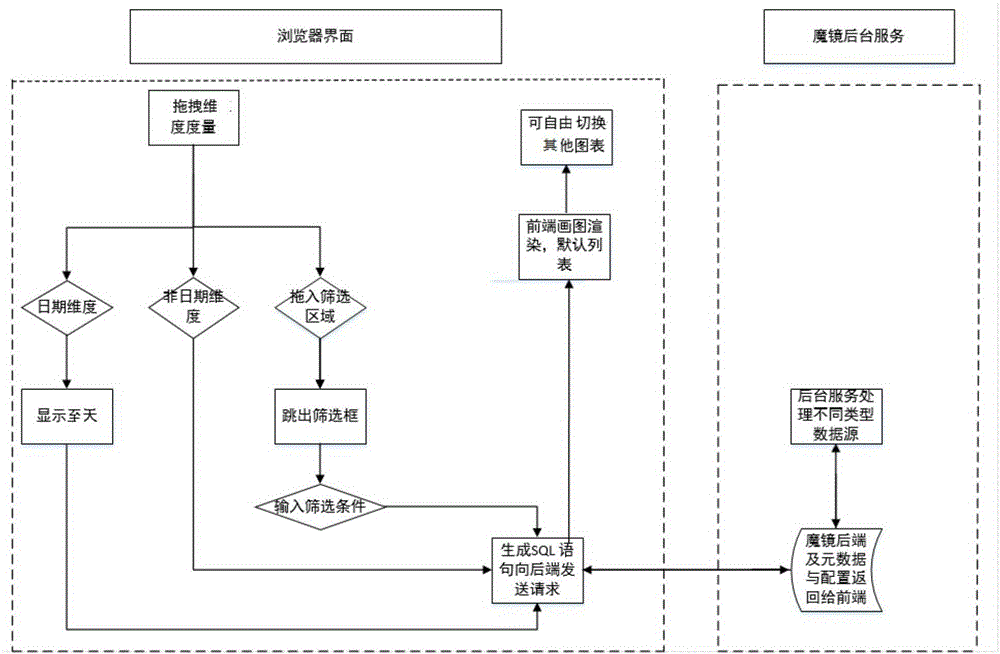
[0021] For the browser-based method of visually dragging and dropping data source information, please refer to the attached figure 1 , including: rendering the chart on the browser side and filling in the information returned by the backend, that is, requesting the backend service to configure different data sources, metadata configuration, and automatically generating a visual chart through the front-end code including JS and html technology, including the following steps:

[0022] Step 1) Drag and drop dimension measurement: that is, drag different data types into each area, wherein the data types are divided into date-type dimensions, non-date-type dimensions, and filter areas;

[0023] Step 2) According to the differences of the dragged-in regions and the data types, it i...


PUM


Abstract

The invention relates to a method for visually displaying data source information by dragging on the basis of a browser. The method comprises the following steps: step 1) measuring drag dimensionality, namely dragging different types of data to each area, the data types are divided into date type dimensionality, non-date type dimensionality and screening area; step 2) automatically generating or configuring the dimensionality, measurement, and SQL (structured query language) statements of automatic generation according to the differences of areas-dragged in and the data types, and sending a request to backend; step 3) according to an array returned from the backend, rendering and constructing visual analysis graphics through JS and html technologies, and displaying data according to the visual graphics; step 4) acquiring data once, then storing the data into browser caching, freely switching other diagrams until the dimensionality and the measurement are changed. According to the method, relation and change condition among data can be more intuitively shown to users, read and think time of the users can be reduced, data validity can be improved, the simple operational motion of visual dragging can perform an analysis of large data.

Description

technical field [0001] The invention relates to a method for displaying data source information, in particular to a method for displaying data source information based on browser-based visual dragging. Background technique [0002] The current data analysis tools on the market have the following defects: (1) only a small number of people who understand technology can use them; (2) they are installed locally and cannot be compatible with mainstream browsers; (3) need to write complex SQL statements, the threshold High; (4) Data analysis is complex and requires understanding of data structures and databases. Contents of the invention [0003] In order to overcome the deficiencies of the prior art, the purpose of the present invention is to provide a browser-based method for visually dragging and displaying data source information, which is easy to operate and easy to get started with. [0004] To achieve the above object, the present invention is achieved through the follow...

Claims


Application Information

Patent Timeline
Patent Type & Authority Applications(China)
IPC IPC(8): G06F17/30
CPCG06F16/904G06F16/90335
Inventor 卓国庆
Owner SUZHOU GUOYUN DATA GOD TECH CO LTD
Why Eureka
Try Eureka