Crude oil type near infrared spectrum identification method
A near-infrared spectroscopy and identification method technology, which is applied in the field of identifying crude oil types by near-infrared spectroscopy, can solve the problems of limited application, long calculation time, and large amount of mathematical calculation, and achieves the effect of reducing the amount of calculation and improving the identification speed.
- Summary
- Abstract
- Description
- Claims
- Application Information
AI Technical Summary
Problems solved by technology
Method used
Image
Examples
example 1
[0044] Establishment of near-infrared spectrum database of crude oil samples
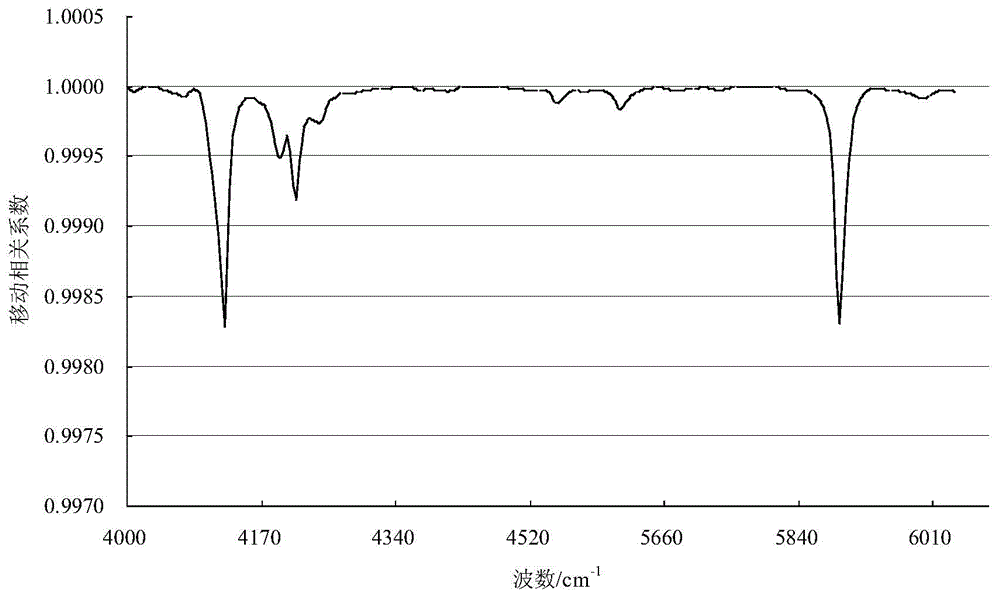
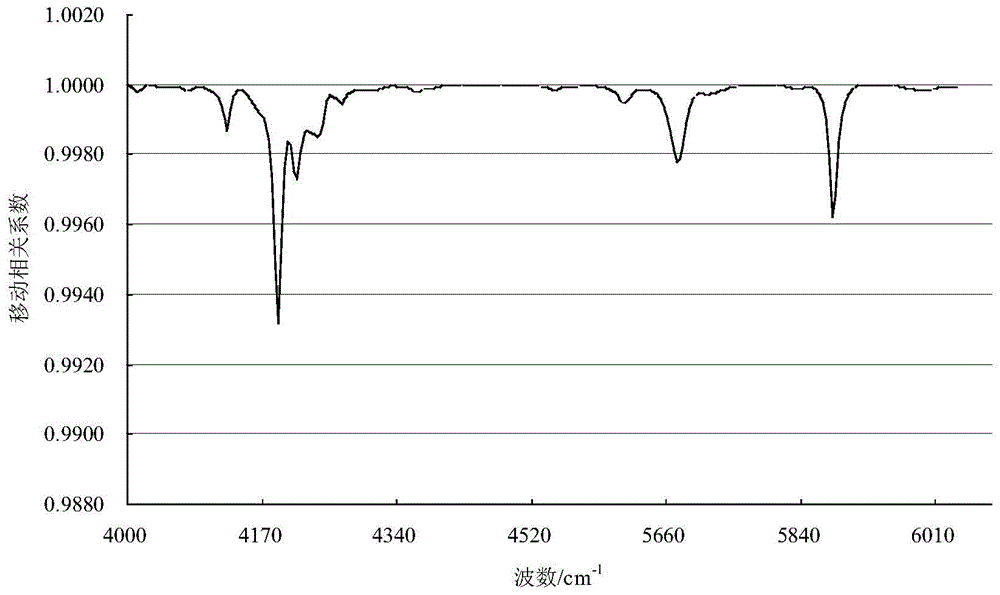
[0045] 655 representative crude oil samples were collected, and the crude oil varieties basically covered the world's major crude oil producing areas. Measure the near-infrared spectrum of the crude oil sample, carry out the second order differential, take 6076.0~5556.0cm -1 and 4628.0~4000.0cm -1 For the absorbance in the spectral range, the near-infrared spectrum database X of crude oil samples was established. The dimension of X is 655×289, where 655 is the number of samples collected for crude oil, and 289 is the number of sampling points for the near-infrared spectrum absorbance.
[0046] Perform principal component analysis on X to obtain the spectral library score matrix T and spectral library load matrix P. The dimension of T is 655×15, of which 655 is the number of samples of crude oil collected, and 15 is the number of main factors; the dimension of P is 289 ×15, where 289 is the number ...
example 2
[0048] The following examples identify unknown crude oil samples according to the method of the present invention.
[0049] (1) Build a neighboring spectral database
[0050] According to the same conditions as the establishment of the near-infrared spectrum database X, the near-infrared spectrum of the unknown crude oil A in Table 1 was measured, and the second-order differential was performed on it, taking 6076.0 to 5556.0 cm -1 and 4628.0~4000.0cm -1 The absorbance of the spectral range constitutes the vector x A , whose dimension is 1×289. Multiply the vector x by the spectral library loading matrix P A Obtain the score vector t of crude oil A to be identified, whose dimension is 1×15.
[0051] With the score vector t as the feature, calculate the Euclidean distance between the score vector t and each sample in the spectral library score matrix T according to formula ②, k=15 in formula ②.
[0052] From the spectral library score matrix T, select 30 samples with the sm...
example 3
[0058] (1) Build a neighboring spectral database
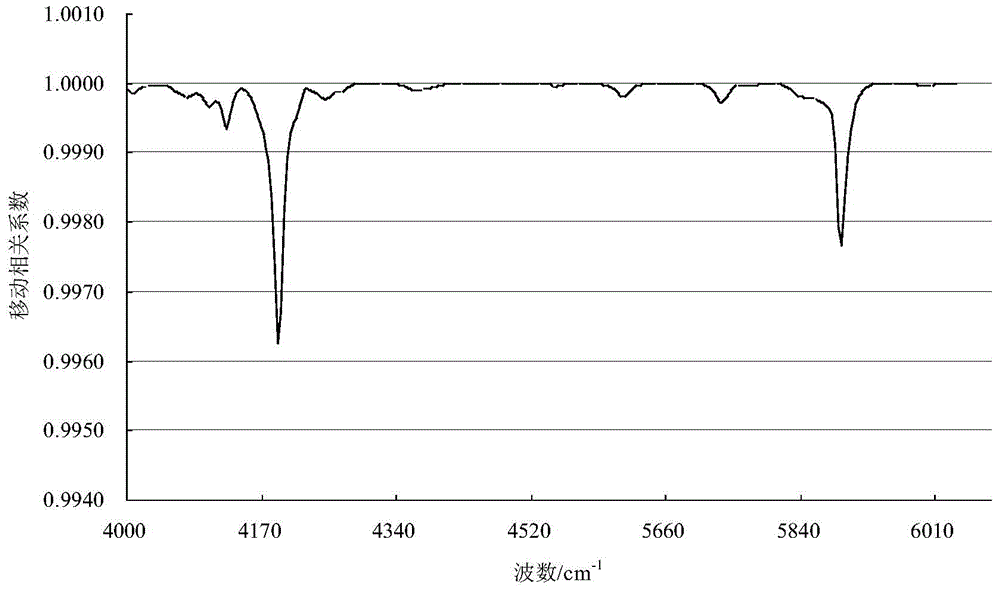
[0059] According to the same conditions as the establishment of the near-infrared spectrum database X, the near-infrared spectrum of the unknown crude oil B in Table 1 was measured, and the second-order differential was performed on it, taking 6076.0 to 5556.0 cm -1 and 4628.0~4000.0cm -1 The absorbance of the spectral range constitutes the vector x B , whose dimension is 1×289. Multiply the vector x by the spectral library loading matrix P B Obtain the score vector t of crude oil B to be identified, and its dimension is 1×15.
[0060] With the score vector t as the feature, calculate the Euclidean distance between the score vector t and each sample in the spectral library score matrix T according to formula ②, k=15 in formula ②.
[0061] From the spectral library score matrix T, select 20 samples with the smallest distance from t, and the corresponding sample numbers in the near-infrared spectral database X are: 201, 111,...
PUM
 Abstract
Description
Claims
Application Information
 - R&D
- Intellectual Property
- Life Sciences
- Materials
- Tech Scout
- Unparalleled Data Quality
- Higher Quality Content
- 60% Fewer Hallucinations
Browse by: Latest US Patents, China's latest patents, Technical Efficacy Thesaurus, Application Domain, Technology Topic, Popular Technical Reports.
© 2025 PatSnap. All rights reserved.Legal|Privacy policy|Modern Slavery Act Transparency Statement|Sitemap|About US| Contact US: help@patsnap.com


