System and method for identifying urban expressway traffic bottlenecks
An expressway and traffic technology, applied in traffic flow detection and other directions, can solve the problems of no traffic bottleneck research, no consideration of road inherent attributes, single data source, etc., to achieve the effect of data fusion and utilization, and data mining.
- Summary
- Abstract
- Description
- Claims
- Application Information
AI Technical Summary
Problems solved by technology
Method used
Image
Examples
Embodiment approach 1
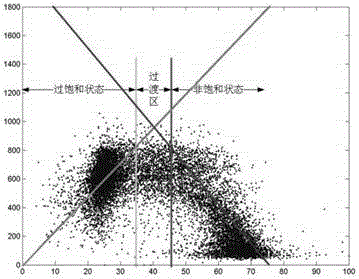
[0027] This embodiment mainly relates to a method for identifying road traffic bottlenecks. The method mainly includes the following steps: data acquisition step, data fusion step, calculation step, traffic bottleneck identification step (see attached figure 1 ). The following are the specific introductions:
[0028] 1. Data collection step: collect mobile navigation data of road vehicles and road fixed detector data.
[0029] The data sources collected in this step include two parts. The first part is the floating car data collected through the navigation software of the vehicle or mobile terminal. The data records the ID number of the vehicle and the position, time, speed and other information of each vehicle per minute, where the position includes longitude and latitude, time year, month, date, hour, minute, second and other information (as attached figure 2 shown). The second part is the microwave data collected by fixed detectors on the roads in the city. The dat...
Embodiment approach 2
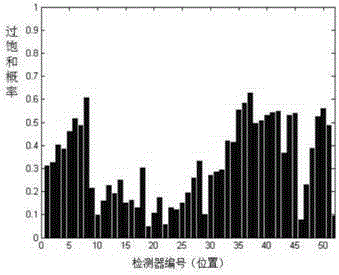
[0059] This embodiment mainly relates to a method for verifying road traffic bottlenecks. This method can also be used to verify whether the level of supersaturation probability can represent the primary and secondary of the bottleneck, and can be used to determine the specific location and spread range of the traffic bottleneck in the detector area. The specific method is as follows:
[0060] According to the data obtained in the data collection step, make the speed space-time distribution map of the relevant road sections (such as Figure 10 shown). This graph can show the change of speed with space on a certain road in 24 hours a day, the horizontal axis is 24 hours, the vertical axis is position, and the color depth represents the size of the speed. From the space-time distribution diagram of speed, we can see the change of speed in time and space, so as to find the area with lower speed, that is, the area where congestion occurs, and we can also see the initial location...
Embodiment approach 3
[0064] This implementation mode mainly involves control countermeasures for different types of traffic bottlenecks, as follows.
[0065] For the different types of traffic bottlenecks identified in the first implementation mode, corresponding measures can be taken for governance:
[0066] (1) For the first type of typical bottleneck, it is mainly because the traffic bottleneck is an important destination and traffic fortress, and the upstream traffic flow is relatively large, so it is possible to divert the upstream traffic flow to the bottleneck in advance and divert a part of the traffic flow Guide to auxiliary roads or other urban roads to the destination, so as to reduce the pressure on the main road; or promote the construction of public transportation, and transfer some car users to public transportation to reduce the demand for urban expressways; The congestion charging policy of the government alleviates severe congestion in local areas.
[0067] (2) For the second ty...
PUM
 Abstract
Description
Claims
Application Information
 - R&D
- Intellectual Property
- Life Sciences
- Materials
- Tech Scout
- Unparalleled Data Quality
- Higher Quality Content
- 60% Fewer Hallucinations
Browse by: Latest US Patents, China's latest patents, Technical Efficacy Thesaurus, Application Domain, Technology Topic, Popular Technical Reports.
© 2025 PatSnap. All rights reserved.Legal|Privacy policy|Modern Slavery Act Transparency Statement|Sitemap|About US| Contact US: help@patsnap.com


