
A Suspicious Point Discrimination Method Based on Measured Data

A technology of measured data and discrimination method, applied in the direction of electrical digital data processing, special data processing applications, instruments, etc., can solve the problems of low accuracy, slow speed, unreal data, etc., to reduce maintenance, reduce economic losses, save money artificial effect

Active Publication Date: 2018-11-02
HEILONGJIANG INST OF TECH
View PDF5 Cites 0 Cited by
  • Summary
  • Abstract
  • Description
  • Claims
  • Application Information

AI Technical Summary

Problems solved by technology

[0003] The purpose of the present invention is to propose a method for discriminating suspicious points based on actual measured data in order to solve the shortcomings of the existing on-site measured and reported data that are not true, and the accuracy and speed of finding suspicious data are low and slow.

Method used


Image

  • A Suspicious Point Discrimination Method Based on Measured Data
  • A Suspicious Point Discrimination Method Based on Measured Data
  • A Suspicious Point Discrimination Method Based on Measured Data

Examples


specific Embodiment approach 1

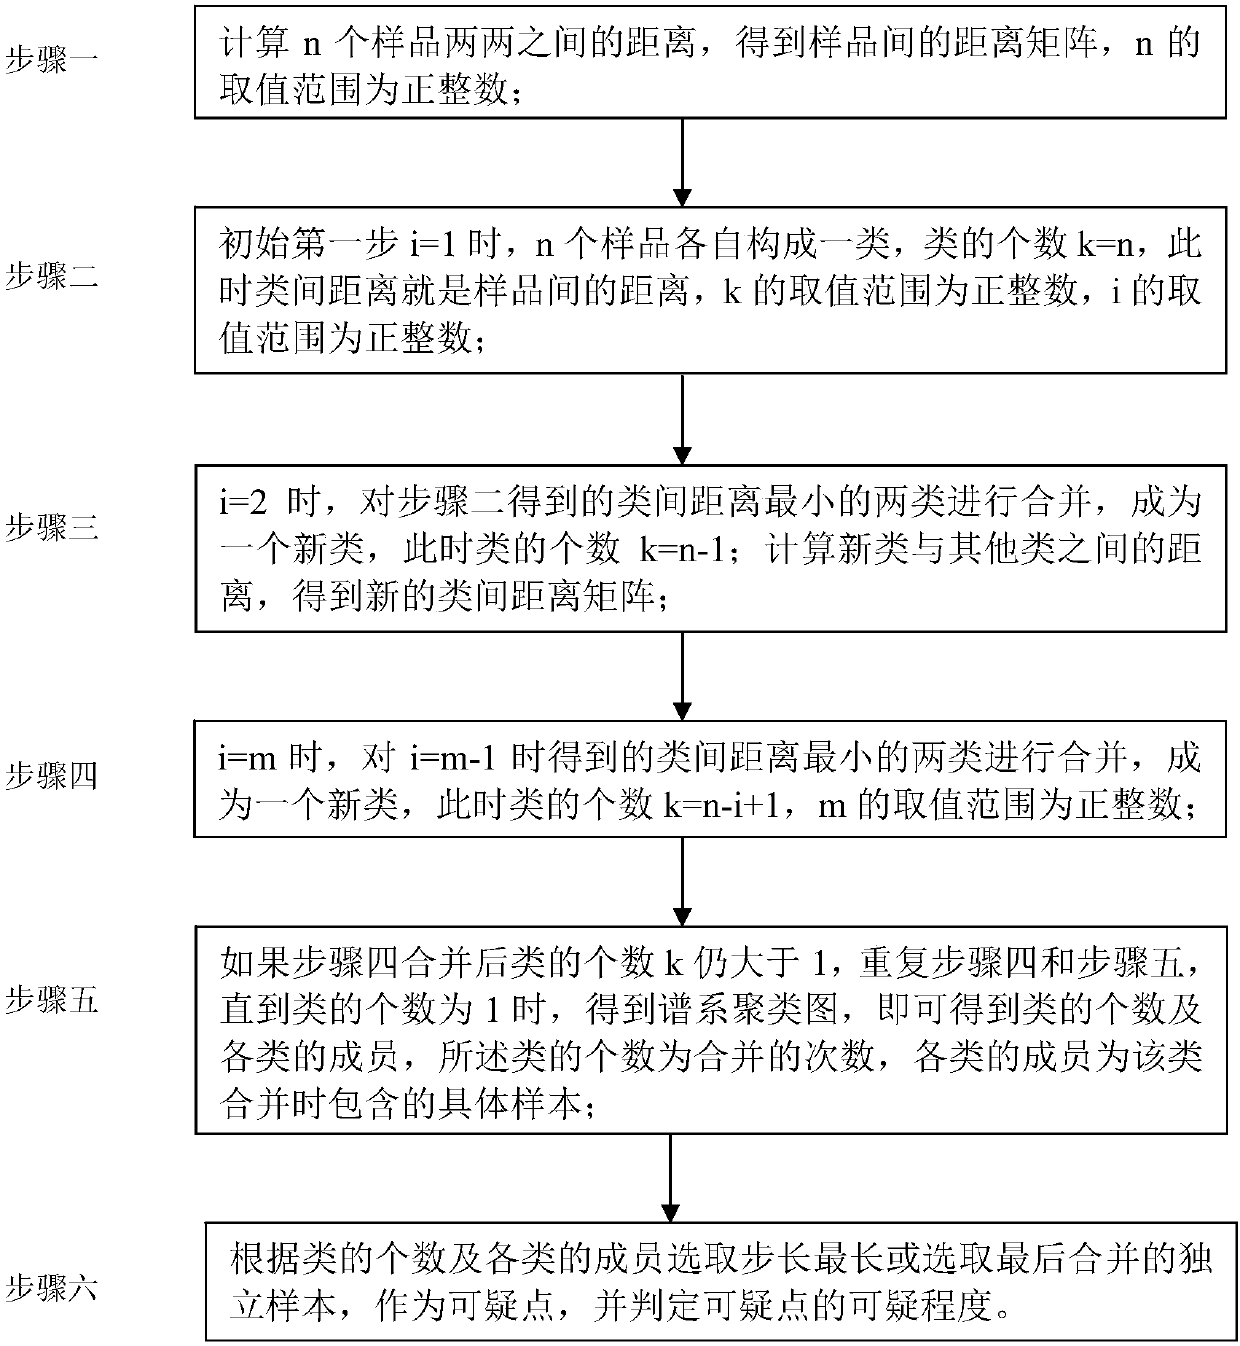
[0028] Specific implementation mode one: combine figure 1 Describe this embodiment, a method for discriminating suspicious points based on measured data in this embodiment is specifically carried out in accordance with the following steps:

[0029] cluster analysis method

[0030] Cluster analysis, also known as group analysis, is a multivariate statistical method to study and classify samples or indicators according to the characteristics of errors themselves. The so-called "class", in layman's terms, is a collection of similar elements. The principle of cluster analysis is to directly compare the properties of various things, classify those with similar properties into one class, and classify those with large differences in properties into different classes.

[0031] Cluster analysis is a new branch of practical multivariate statistical analysis. It is in the development stage. Although it is not perfect in theory, it can solve many practical problems. Therefore, this met...

specific Embodiment approach 2

[0101] Specific embodiment 2: The difference between this embodiment and specific embodiment 1 is that in the step 1, the distance between any two measured data positions in the n measured data positions is calculated to obtain the n measured data positions The distance matrix between, the value range of n is a positive integer; the specific process is called:

[0102] The distance between any two measured data locations among the n measured data locations is obtained through the Pearson correlation coefficient distance.

[0103] Other steps and parameters are the same as those in Embodiment 1.

specific Embodiment approach 3

[0104] Specific embodiment three: this embodiment is different from specific embodiment one or two in that: when i=2 in the step three, the two classes with the smallest inter-class distance obtained in step two are merged to form a new class, here When the number of classes k=n-1; calculate the distance between the new class and other classes to obtain a new inter-class distance matrix; the specific process is called:

[0105] The distance between the new class and other classes is calculated by the default method of the SPSS (Statistical Product and Service Solution) software, the inter-class average chain method, and a new inter-class distance matrix is ​​obtained.

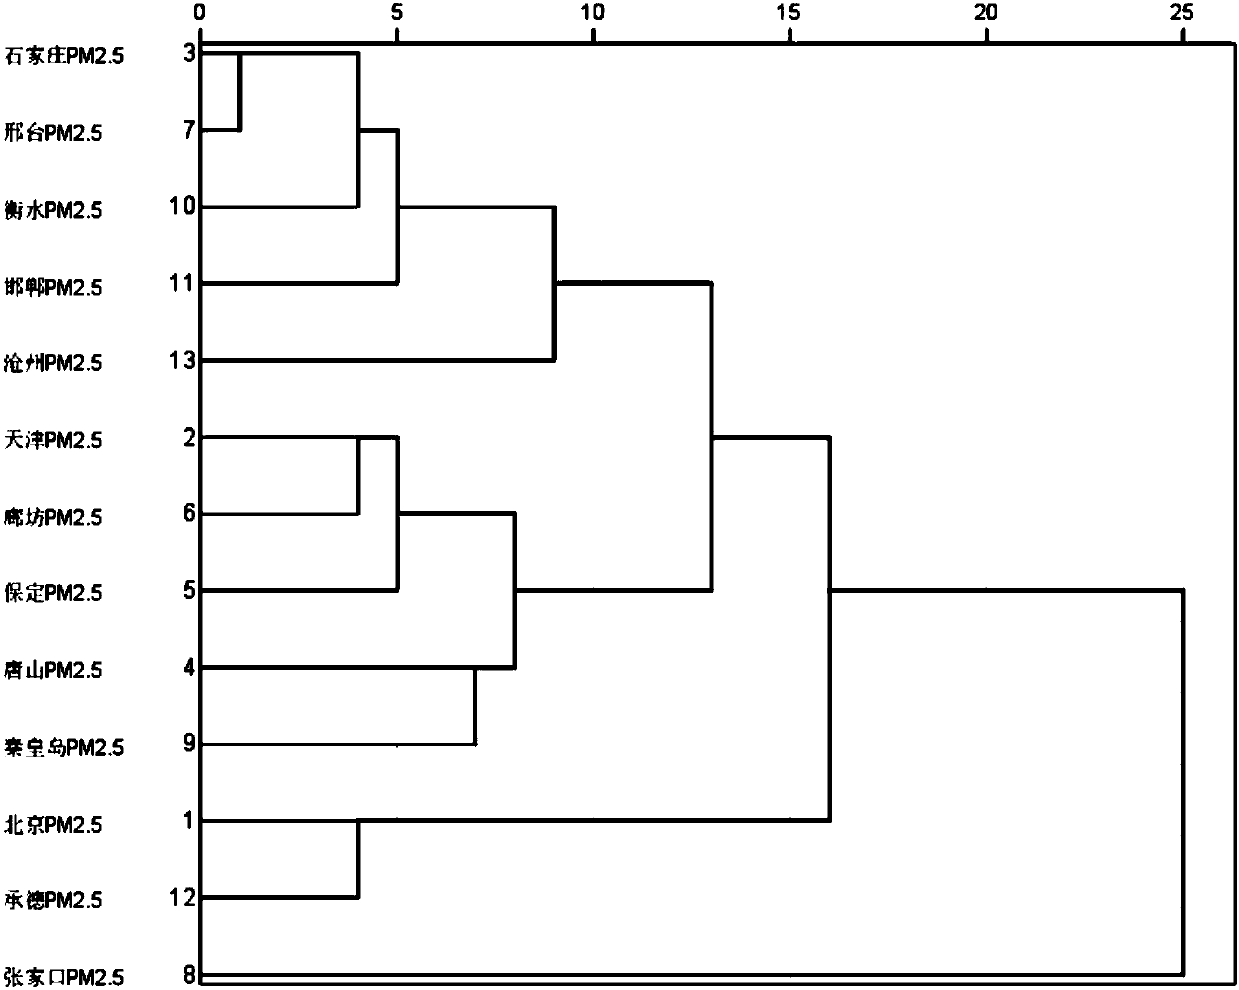
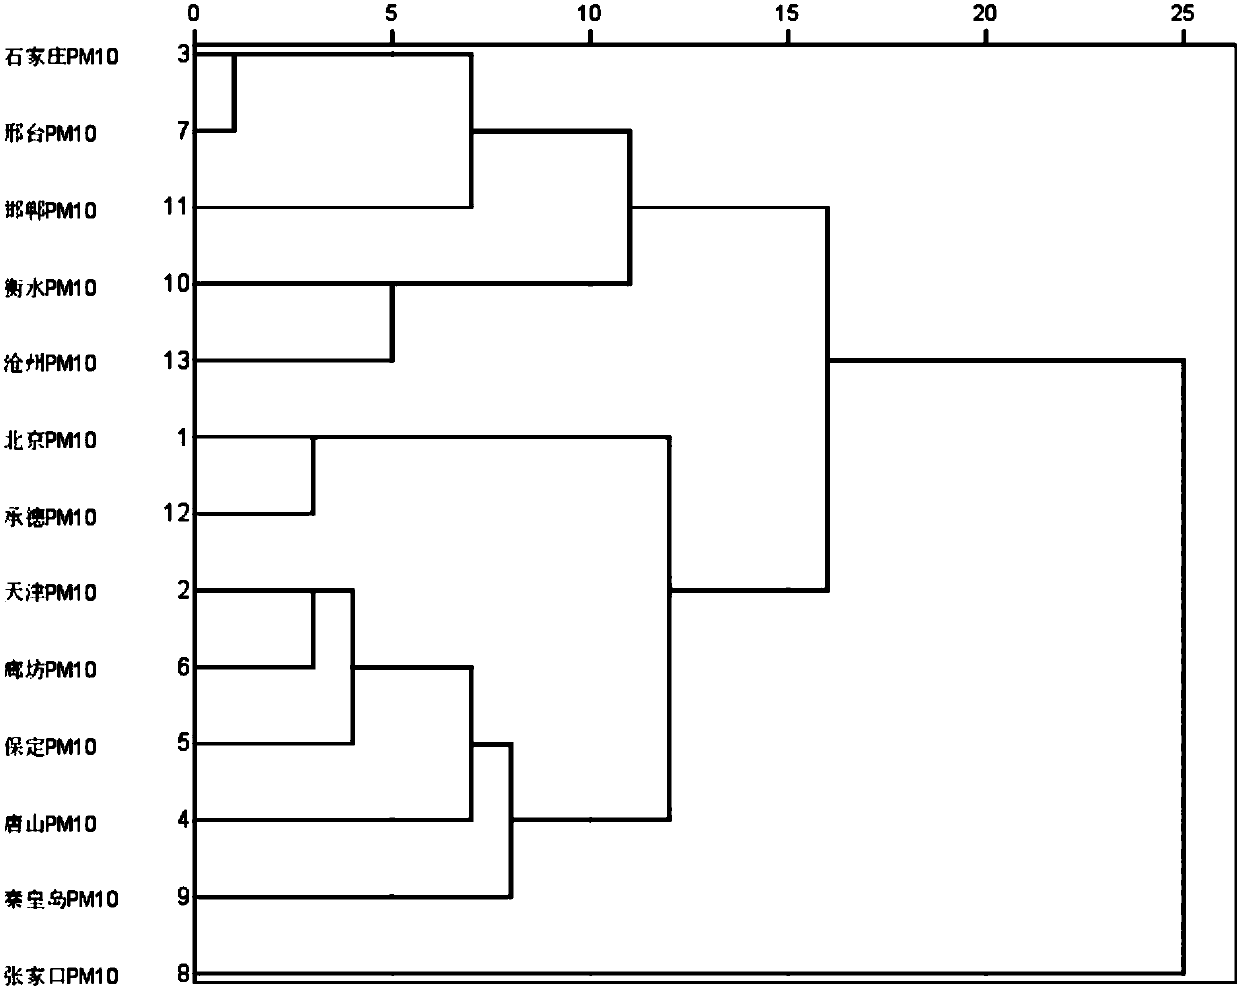
[0106] Using the Hierarchical Cluster method of SPSS software, cluster analysis was performed on a data value data of different samples. The specific clustering method is the Between-groups linkage method, and the Pearson correlation coefficient (Pearson correlation) is selected for the distance measurement. T...


PUM


Abstract

The invention relates to a measured data-based doubtful point discrimination method, and aims at solving the disadvantage that the existing field measurement reported data is unreal so that the search of doubtful data is low in accuracy and low in speed. The method comprises the following steps of: 1, obtaining a matrix of distances between positions of n measured data; 2, when i is equal to 1, forming a class for each of the n measured data, wherein distances between the classes are the distances between the n measured data; 3, when i is equal to 2, combining two classes, the distance between which is the minimum, obtained in step 2 to form a new class, and calculating the distances between the new class and the other classes to obtain a matrix of new class distances; 4, when i is equal to m, combining two classes, the distance between which is the minimum, obtained when i is equal to m-1 to form a new class; 5, obtaining the number of the classes and members of each class; and 6, discriminating doubtful degrees of doubtful point data. The method provided by the invention is used for the field of data doubtful point discrimination.

Description

technical field [0001] The invention relates to a suspicious point discrimination method based on measured data. Background technique [0002] We call the qualified standard of the measured data on the road site the specification, which is the national standard, and the update is more common. Therefore, we need to update the entire system in time, and the standards of the measured data under different geographical conditions may vary. Different, for different regions, there may be problems that need to be investigated in the future; and the core technology is relatively simple, mainly a combination of several programs, but the database is large, which will affect the running speed. It is very common that the data reported by the field measurement of the highway is not true, but the large-scale unqualified data construction unit will not lie about the data, and will definitely conduct re-testing and re-paving and rolling, but the artificial modification of individual data, th...

Claims


Application Information

Patent Timeline
Patent Type & Authority Patents(China)
IPC IPC(8): G06F17/50
CPCG16Z99/00
Inventor 徐建成孙歌武鹤
Owner HEILONGJIANG INST OF TECH
Learn More