Ocean sectional diagram drawing method based on GIS platform

A cross-section and marine technology, applied in the direction of editing/combining graphics or text, etc., can solve the problems of incomplete cartography data, incompatibility with each other, inconsistent format of cartography data and cartography results, etc.

Inactive Publication Date: 2016-12-07
NAT MARINE DATA & INFORMATION SERVICE
View PDF4 Cites 21 Cited by
  • Summary
  • Abstract
  • Description
  • Claims
  • Application Information

AI Technical Summary

Problems solved by technology

The traditional cross-sectional distribution map is not for the purpose of drawing, but is mostly drawn based on Matlab, Surfer, and AutoCAD software, and is used for report illustration illustrations. In terms of editing and typesetting, it cannot achieve the effect of map publication
Moreover, due to the incompatibility between these softwares, the attribute information in the process of mapping and drawing cannot be completely preserved, resulting in the inconsistency of the format of the existing marine cross-section mapping data and mapping results, and the incompleteness of the mapping data

Method used


Image

  • Ocean sectional diagram drawing method based on GIS platform
  • Ocean sectional diagram drawing method based on GIS platform
  • Ocean sectional diagram drawing method based on GIS platform

Examples


example

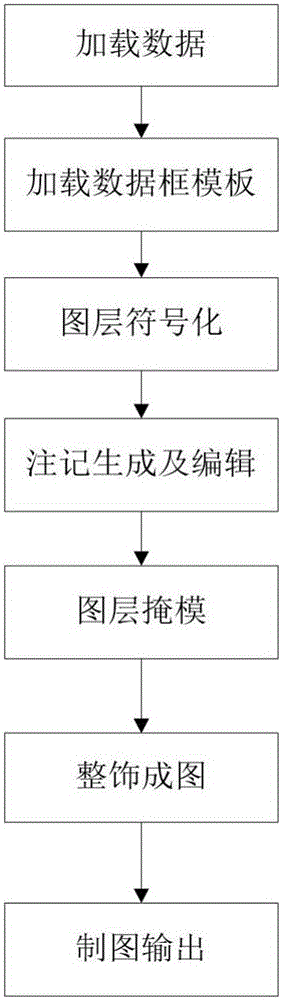
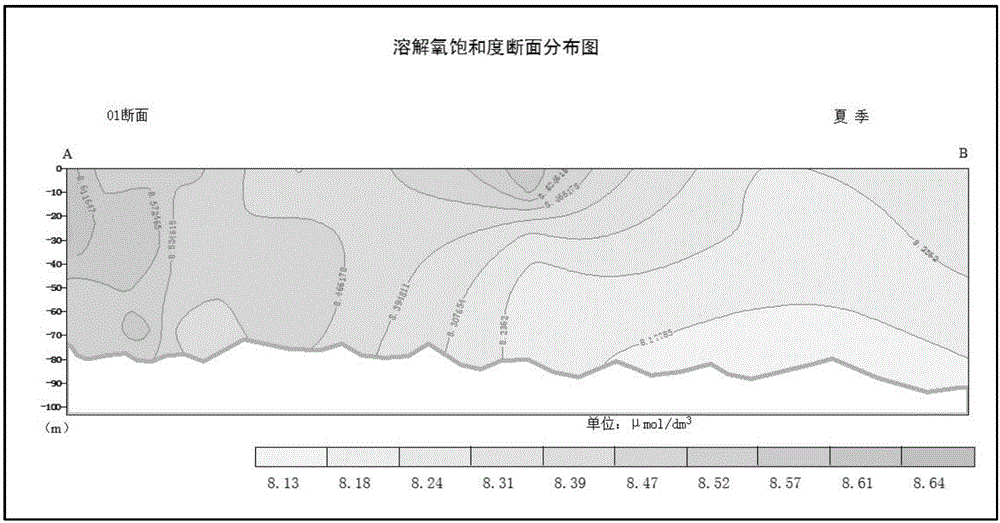
[0073] In order to clearly describe the content of the present invention, the making of a dissolved oxygen saturation cross-sectional distribution diagram is selected to describe the execution steps in detail, as attached figure 1 shown.

[0074] (1) Load data

[0075] ①Submarine terrain data generation: import ST01 cross-section data through Arcmap’s Add XY Data, the data is a point file containing latitude and longitude information, export the point file to shp format, and then use the command Features to Polygon to automatically connect the point file into a surface file, And export the file as "seabed terrain.shp".

[0076] ②Generation of marine environmental element data: Import the spring dissolved oxygen saturation data on the ST01 section through Arcmap's Add XY Data, and the data is in three columns, including longitude, latitude, and value. Through the GeoStatisticalAnalyst function in Arcmap, the Kriging method is used to interpolate the dissolved oxygen saturatio...


PUM


Abstract

An ocean sectional diagram drawing method based on a GIS platform comprises the following steps of (1) data loading, wherein loaded data comprises ocean environmental element data and seabed landform data used for drawing; (2) data frame template loading; (3) layer symbolization, wherein symbolization of a sectional distribution diagram is a gradient blank diagram represented by isopleths and a hypsometric tending method, and graded chroma for filling follows the gradient method and the color system is maintained fixed; (4) note generation and edition; (5) layer masking, namely, isopleth covering, which is used for covering noted characters with isopleths; (6) diagram finishing; and (7) diagram outputting. The invention firstly integrates all flows of ocean sectional diagram drawing on the GIS platform, changes the present situations that drawing formats and platforms of existing ocean sectional diagram drawings are different, typesetting and editing are difficult, and standards are not uniform, and automatic drawing of a traditional sectional diagram on the GIS platform is achieved.

Description

technical field [0001] The invention belongs to the technical field of marine information, in particular to a method for drawing a marine section map based on a GIS platform. Background technique [0002] A marine section map is a map that reflects the statistical distribution of a certain element along a certain vertical section, and is used in marine hydrology, meteorology, chemistry, biological ecology, and geology. Traditional cross-sectional distribution maps are not for cartographic purposes, but are mostly drawn based on Matlab, Surfer, and AutoCAD software, and are used for report illustrations and schematic illustrations. In terms of editing and typesetting, the effect of map publication cannot be achieved. Moreover, due to the incompatibility between these softwares, the attribute information in the process of mapping and drawing cannot be completely preserved, resulting in the inconsistency of the format of the existing marine cross-section mapping data and mappin...

Claims


Application Information

Patent Timeline
Patent Type & Authority Applications(China)
IPC IPC(8): G06T11/60
CPCG06T11/60
Inventor 樊妙邢喆章任群李艳雯孙毅焦红波张苗苗杨晓彤王力彦侯辰
Owner NAT MARINE DATA & INFORMATION SERVICE
Why Eureka
Try Eureka