Homogenous data set characteristic quality visualization method

A data set and data subset technology, applied in the field of machine learning, can solve the problem of no quantitative research or visual analysis of feature stability and feature correlation, and achieve the effect of helping manual feature selection, increasing intuitive understanding and strong interpretability

Inactive Publication Date: 2016-12-14
上海晶赞企业管理咨询有限公司
View PDF0 Cites 2 Cited by
  • Summary
  • Abstract
  • Description
  • Claims
  • Application Information

AI Technical Summary

Problems solved by technology

In traditional feature selection methods, the evaluation of feature quality often only considers feature correlation, such as the mutual information between features and labels, without quantitative research or visual analysis of feature stability and feature correlation as a binary index.

Method used


Image

  • Homogenous data set characteristic quality visualization method
  • Homogenous data set characteristic quality visualization method
  • Homogenous data set characteristic quality visualization method

Examples


Embodiment 1

[0043] Table 1

[0044]

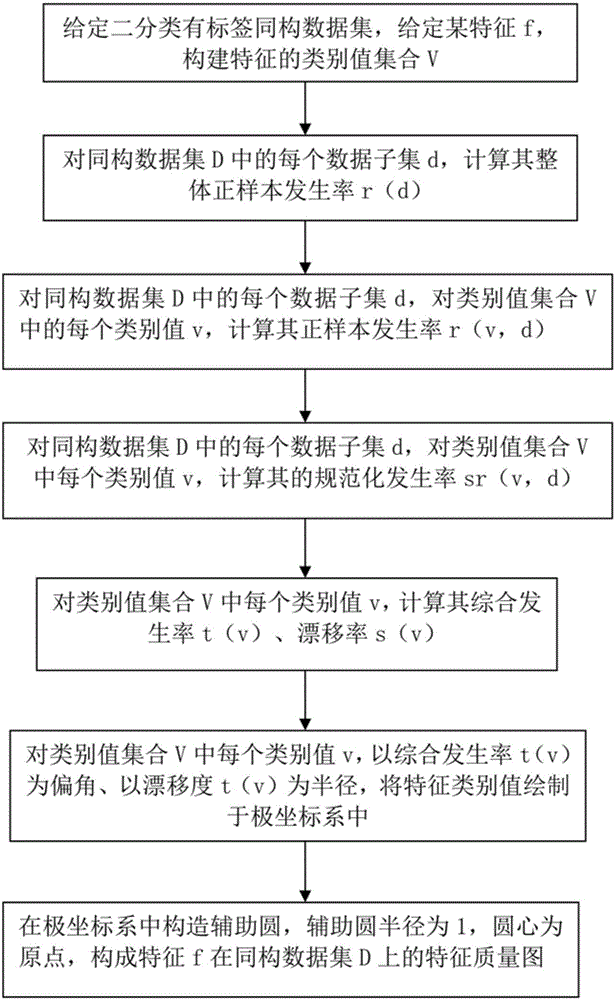
[0045] This embodiment is a conversion rate model of an advertiser, and the isomorphic data set D is the sample data of the customer, and the label is whether to convert or not. In this example, the steps of HoDFQV, a feature quality visualization method for isomorphic datasets, are as follows:

[0046] Step 1, given the isomorphic data set D, D is the conversion rate sample set, given the feature f, f is dayofweek, that is, the day of the week, and constructs a feature category value set V = {1, 2, 3, 4, 5, 6, 7}, respectively represent Monday to Sunday, divide the isomorphic data set D into K=3 data subsets according to the week, that is, D={1, 2, 3}.

[0047] Step 2, for each data subset d in the isomorphic data set D, calculate its overall positive sample incidence rate r(d), the calculation formula is r(d)=pos(d) / ins(d), where pos (d), ins(d) represent the number of positive samples and the total number of samples in d; when d=1, r(1)=767 / 84...

Embodiment 2

[0057] This example is an advertising conversion rate model, where the data set is sample data of a customer in an e-commerce industry, and the label is whether to convert or not. In this example, the steps of HoDFEP, a visual evaluation process of homogeneous dataset features, are as follows:

[0058] Step 1. Given a homogeneous data set D and a feature set F, the number of features to be selected is N. The feature set F includes two features {hourofday, dayofweek} respectively representing the time of day and the day of the week, and the number of features to be selected is N=1.

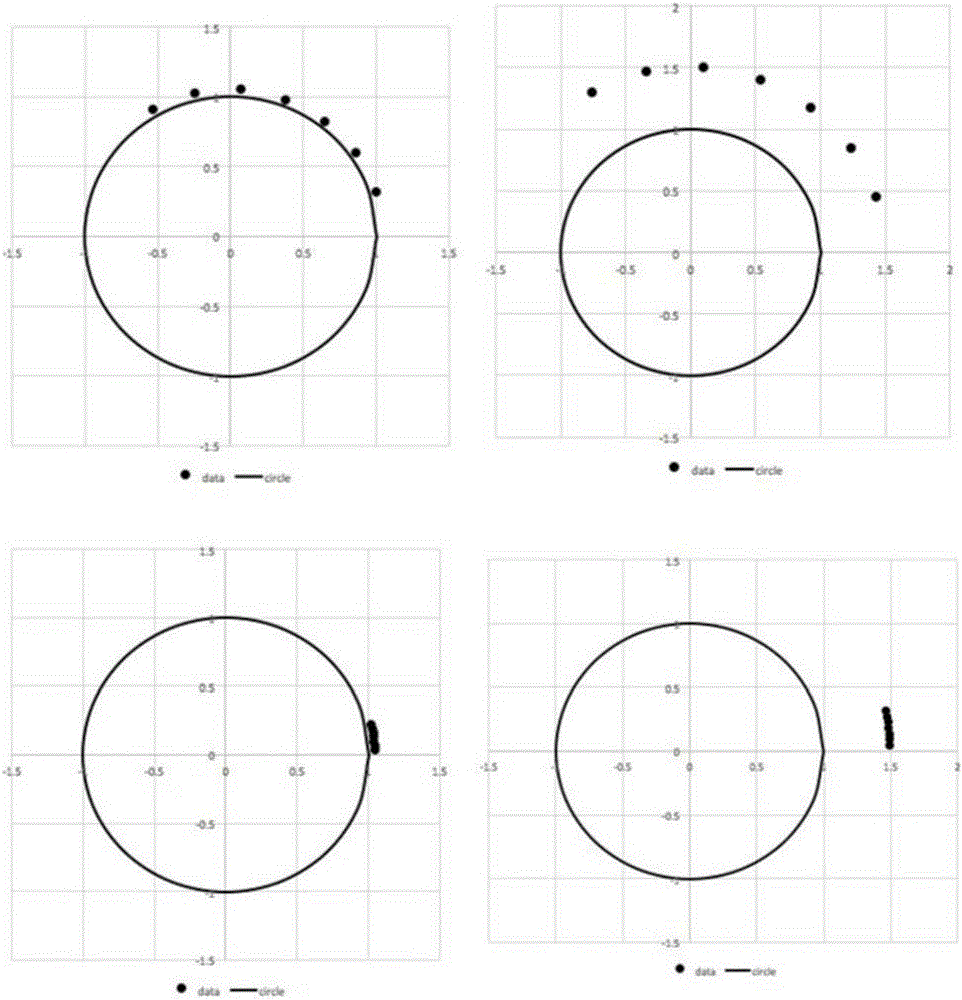
[0059] Step 2, calculate the index data of the feature hourofday and dayofweek respectively, including the number of category values, incidence rate, normalized incidence rate, drift degree, comprehensive incidence rate, etc., to form an index set M; draw the feature quality map of the feature hourofday and dayofweek, Constitute a graph set G.

[0060] Step 3, according to the index set M and the...


PUM


Abstract

The invention relates to a homogenous data set characteristic quality visualization method. Statistics is carried out on homogenous data set characteristics and label sample distribution, the positive sample occurrence rate, the standardization occurrence rate, driftance and the comprehensive occurrence rate of each class value of any characteristic in a characteristic set are calculated, the class value set of the characteristic is mapped into a point set in a polar coordinate system with the driftance as the radius and the comprehensive occurrence rate as the drift angle, and a characteristic quality graph is obtained. The characteristic quality visualization method can be effectively applied to four typical characteristic engineering problems including characteristic evaluation, characteristic attribution, characteristic selection and characteristic improvement in monitored learning. When facing the homogenous data set with data distribution having tendency drift, a monitored robot learning model can solve the training set and testing set distribution difference problem and then effectively carry out characteristic evaluation, characteristic attribution and characteristic selection, and even the model effect can be improved by improving characteristics.

Description

technical field [0001] The invention relates to the field of machine learning, in particular to a method for visualizing feature quality of isomorphic data sets. Background technique [0002] In recent years, with the development of the big data industry, many industries have generated massive amounts of data, and the data types, data scale, and data dimensions are constantly expanding. In order to discover knowledge and value from large amounts of data, machine learning algorithms are increasingly used in industry. In addition to the continuous expansion of data samples, the types and dimensions of data features are also growing rapidly, and the feature dimensions can reach tens of millions or even larger. High-dimensional feature data not only brings storage and calculation problems, but also makes it impossible to accurately understand the causal relationship in the data. Massive features will bring some problems to the follow-up machine learning algorithm in terms of s...

Claims


Application Information

Patent Timeline
Patent Type & Authority Applications(China)
IPC IPC(8): G06F17/30G06N99/00G06Q30/02
CPCG06F16/904G06N20/00G06Q30/0242
Inventor 汤奇峰薛守辉
Owner 上海晶赞企业管理咨询有限公司
Why Eureka
Try Eureka