

Method for withstanding false targets on basis of station's position error fusion algorithm
A fusion algorithm and false target technology, applied in radio wave measurement systems, instruments, etc., can solve the problems of radar station accuracy, affecting the identification of true and false targets, and large positioning errors, so as to reduce resource consumption, reduce the probability of being deceived, The effect of increasing the reference value
- Summary
- Abstract
- Description
- Claims
- Application Information
AI Technical Summary
Problems solved by technology
Method used
Image

Examples
Embodiment Construction
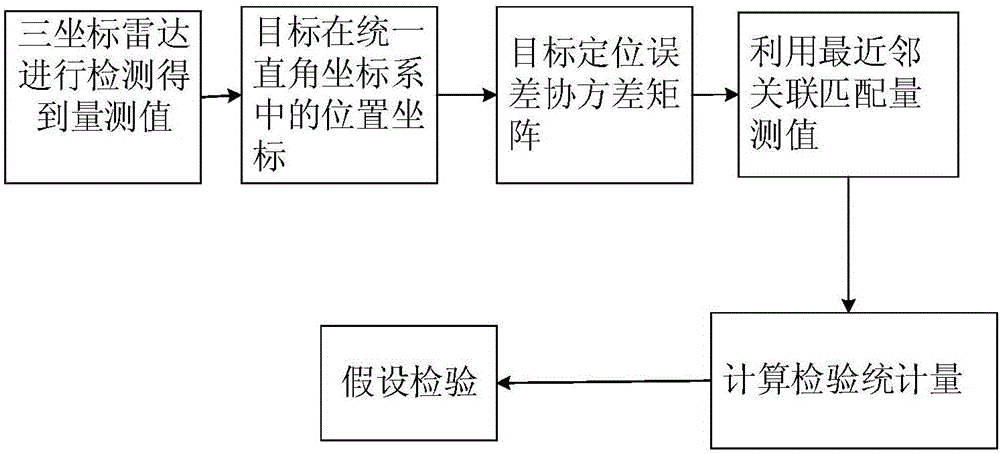
[0018] refer to figure 1 , the specific implementation steps of the present invention are as follows:
[0019] Step 1, the networked radar measures the target.
[0020] Each node radar in the networked radar system measures the target separately, and the measurement value of the i-th node radar for the k-th target is obtained as in, is the radial distance of the kth target relative to the ith node radar, is the azimuth angle of the kth target relative to the ith node radar, is the elevation angle of the kth target relative to the ith node radar;
[0021] Step 2, Coordinate Transformation
[0022] Carry out coordinate transformation on the measured value of the target obtained in (1), and obtain the coordinates of the target in the unified rectangular coordinate system in:
[0023]
[0024] In the formula, Respectively, the radial distance, azimuth angle and elevation angle information of the target relative to the node radar, are the x-axis coordinates, y-ax...
PUM
 Abstract
Description
Claims
Application Information